
Thursday may have proved to be a signal to investors or at least traders that the selling pressure will continue to persist as global economic and political uncertainty also persists. The two have gone hand-and-hand since October. We can suggest the Fed’s “autopilot” commentary sparked the market correction, but other factors have been looming over the market.
On Thursday, the Dow Jones Industrial Average (DJIA) dropped 464.06 points to close at 22,859.6. At one point, the Dow was down nearly 700 points before rebounding nearly 350 points. Thursday’s losses piled onto a terrible week and brought its two-day declines to more than 800 points and its 5-day losses to more than 1,700 points. The S&P 500 (SPX) shed 1.58% to end the trading day at 2,467.41 while the Nasdaq Composite (NDX) fell 1.6% and closed at 6,528.41 after dipping into bear market territory during the session. In addition to the strong equity selling pressure, the response to economic and geopolitical uncertainties, tax loss selling is likely part of the equation/activity as redemptions in 2019 are set to come forward. Lastly, as it pertains to the market pressures this week, the Volatility Index (VIX) tipped over 30 for the first time since the October correction began. With regards to the VIX achievement, this usually doesn’t signify the bottom for equities is at-hand, but rather there is at least one more leg lower.
What happened to equities on Thursday was a continuation of investor revolt and in reaction to the Fed’s less than acceptable dovish rate hike and forecasting of rate hikes for 2019. But it became much more than that as the threat of a government shutdown was viewed as increasingly probable. Speaker Paul Ryan announced that President Donald Trump would not sign a temporary government funding resolution if it did not include funding for the border wall project.
The Senate unanimously approved a bill Wednesday night to keep the government running through Feb. 8, without border wall money. Trump insisted Thursday that he would not sign it. It forced House Republicans to include the wall money in the new bill. The new bill was passed in the House, but is very likely to be dead on arrival in the Senate, setting up a situation for the government to shutdown at midnight Friday. Manmade crisis continue to plague investor sentiment and the stock market. But it didn’t’ even end with the threat of a government shutdown.
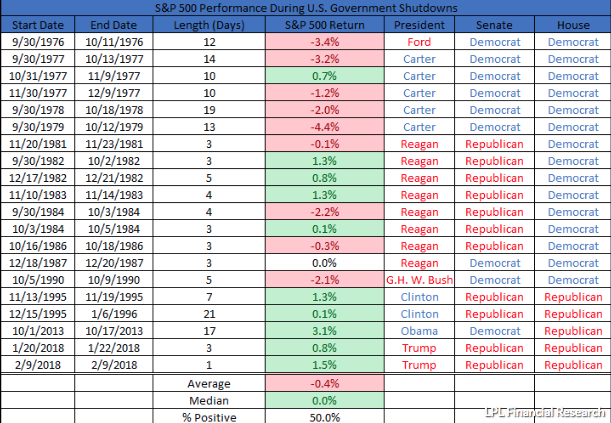
Moreover, though shutdowns haven’t typically done much damage to stock markets, they can be more harmful the longer they last, and investors may have been caught off guard by the news, after it was widely reported as late as Wednesday night that a deal to avert the shutdown had been reached.
The political framework of the United States government continues to come under fire in recent days as the White House made, what seems to be, a unilateral decision to extricate its military forces from Syria. The decision put Defense Secretary James Mattis at odds with President Donald Trump. The disagreement has led to the announcement of Mattis’ resignation, effective February 2019. With Chief of Staff John Kelly also resigning in past weeks, James Mattis was seen as the last stabilizing force within the White House Administration. To be clear, Finom Group isn’t expressing its opinion on the matter, but rather reporting on the matters related to the White House and the political strife felt through the global and domestic equity markets.
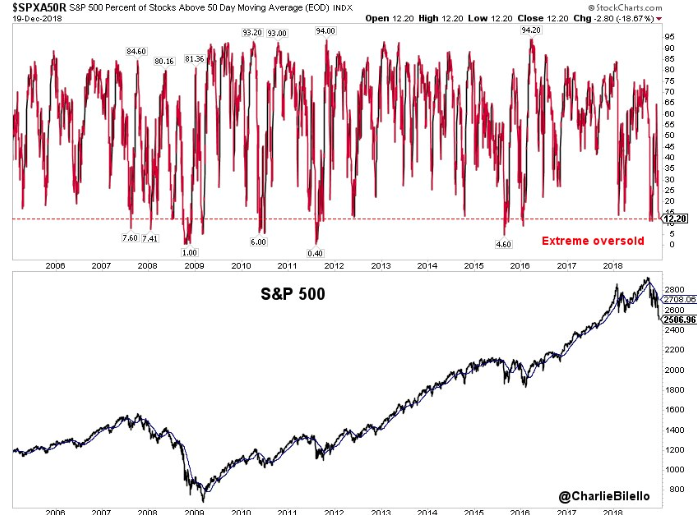
What Finom Group really desires to express at this point and given the backdrop of uncertainty is that risk-off remains in place for investors. Certainly the market is oversold, but the market has been oversold based on economic and corporate fundamentals for the better part of 100-150 S&P 500 points. The market is down to 12% of stocks in the S&P 500 that are above their 50-day moving average. This is representative of extreme oversold conditions.
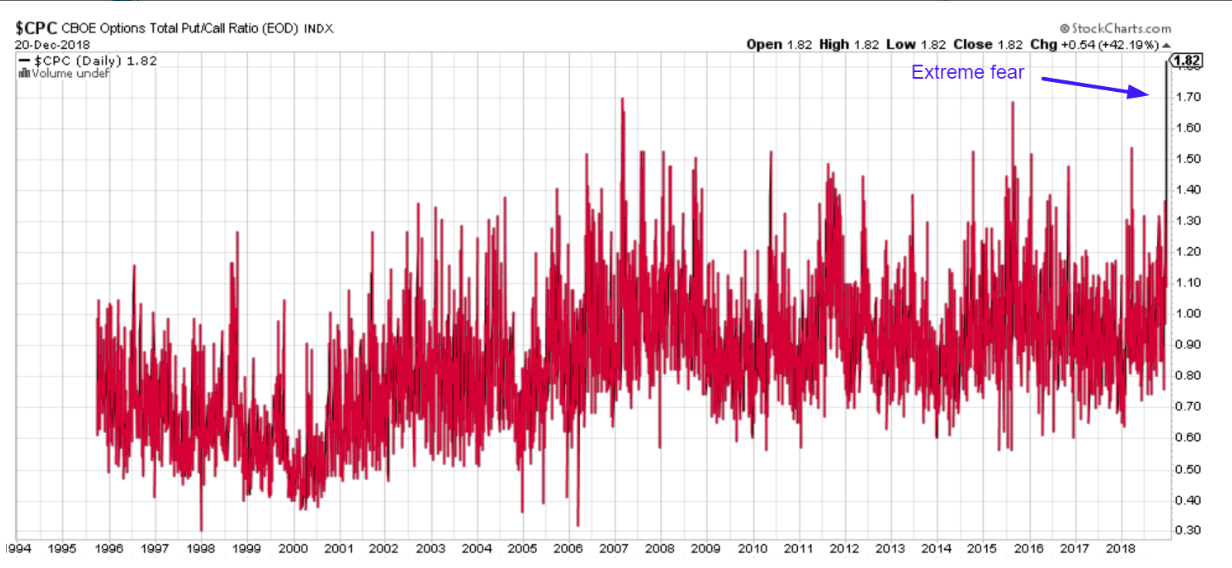
In addition to simplistic S&P 500 daily moving average representation indicating market stress and oversold conditions, we can also look at other indicators to gauge market conditions and what may come. Bearish sentiment in the stock market is at an extreme level presently. The Put/Call Ratio is at its highest level ever recorded, higher than during the Great Financial Crises in 2008. (See chart below)
When we combine the oversold indicators/conditions with the VIX achieving the 30-level for the first time during the current correction period, we are forced to conclude that the medium-term risk/reward is slanted bearish. This does not necessarily mean a near-term snap back rally won’t occur, but rather such a rally does not revert the market to a risk-on environment. So let’s discuss what would bring about a risk-on environment for traders. To be clear, investors can likely put there head down or overt their eyes from the market place over the next few weeks and months and probably be no worse off long-term. But for traders, the trading environment may prove treacherous near and mid-term.
In order to bring about a risk-on environment, a certain level of uncertainty (purposeful word choice) needs to be removed.
- With global trade policy still hanging in the balance and uncertainty over future tariff implementations or longstanding deals, corporations will have difficulty planning for capital spending. Capital spending includes hiring. We don’t like that type of uncertainty that can affect global economies.
- White House Administration is seemingly loses advisors and Senate confirmed members with each passing week. This brings about instability not only domestically, but amongst U.S. ally relationships.
- Fed dovish/hawkish stance on rate hikes and its balance sheet run-off. Please read our review and analysis of the latest Fed Press Conference and rate hike forecast for 2019.
The uncertainties bulleted above are critical, not only to the U.S. economy, but to the global economy and as the U.S. is the largest economy of the world. The trade feud with the 2nd largest economy of the world, China, is under the guidance of ongoing negotiations within a 90-day trade truce. At the end of this period, Finom Group is of the opinion that both sides of the trade feud will find concessions, but until then investors have little to no appreciation for uncertainty and find favor with raising cash levels, forgoing equities and to some degree even bonds. Coupling the trade feud with the uncertainty over the Fed’s rate hike forecast is a toxic mix for markets, as proven in this week’s massive losses to date. The expected weekly move for the S&P 500 this week is $65/points. We’ve already seen nearly 3X the expected weekly move. The market is telling us all we need to know, it is up to us as investors/traders how we handle what the market is telling us.
Despite the probability for further market declines and even more volatility in the market near-term, the longer-term outlook is still perceived to be bullish. The headwinds for the market and economy are real, but they aren’t dire and they aren’t likely to send the U.S. economy into a recession in 2019. We may finish 2018 with GDP near or at 3 percent. The government will release its final reading for Q3 GDP Friday. The expectation is for the final reading to have been lowered from 3.5% to 3.4 percent. Looking into Q4 2018 GDP, revisions are made on a week-to-week basis. We can see the ongoing process via the Atlanta Fed GDPNow forecast.
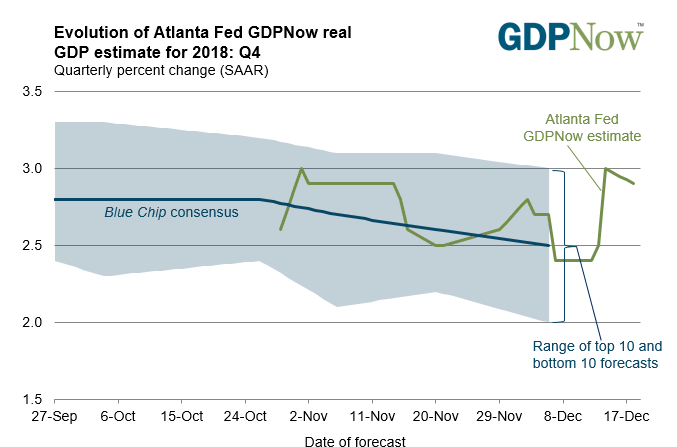
The GDPNow model estimate for real GDP growth (seasonally adjusted annual rate) in the fourth quarter of 2018 is 2.9% on December 18, down from 3.0% on December 14. The nowcast of fourth-quarter real residential investment growth decreased from -2.4% to -4.2% after the recent new residential construction release from the U.S. Census Bureau.
On Thursday, the latest Conference Board Leading Economic Index (LEI) for November increased fractionally to 111.8 from a revised 111.6 in October. The Coincident Economic Index (CEI) came in at 104.9, up from 104.7 the previous month.

“Positive contributions from building permits, the ISM® New Orders Index, the yield spread and consumer expectations for business conditions more than offset the negative contributions from weekly initial claims for unemployment insurance (inverted), stock prices and the average workweek. In the six-month period ending November 2018, the leading economic index increased 2.2 percent (about a 4.4 percent annual rate), slower than the growth of 2.9 percent (about a 5.9 percent annual rate) during the previous six months. However, the strengths among the leading indicators continue to be more widespread than the weaknesses.
The Conference Board CEI for the U.S., a measure of current economic activity, also increased in November. The coincident economic index rose 1.3 percent (about a 2.5 percent annual rate) between May and November 2018, faster than the growth of 0.9 percent (about a 1.8 percent annual rate) for the previous six months. Also, the strengths among the coincident indicators have remained very widespread, with all components advancing over the past six months. The lagging economic index continued to increase, but at a faster rate than the CEI. As a result, the coincidentto-lagging ratio is down slightly. Real GDP expanded at a 3.5 percent annual rate in the third quarter, after increasing 4.2 percent (annual rate) in the second quarter. [Full notes in PDF]
“The LEI increased slightly in November, but its overall pace of improvement has slowed in the last two months,” said Ataman Ozyildirim, Director of Economic Research at The Conference Board. “Despite the recent volatility in stock prices, the strengths among the leading indicators have been widespread. Solid GDP growth at about 2.8 percent should continue in early 2019, but the LEI suggests the economy is likely to moderate further in the second half of 2019.”
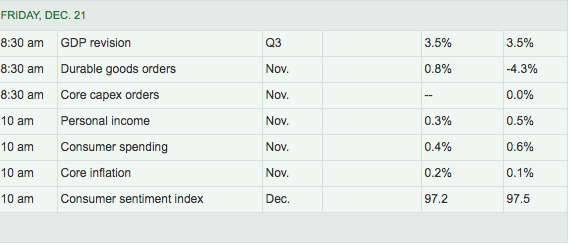
In addition to the recently released data and the anticipated Q3 GDP final reading, there is more data set to be released Friday as indicated in the table below from MarketWatch. Personal Income & Spending data is the most critical piece of information for not only investors, but also the Fed. The PCE data is the Fed’s key gauge of inflation in the economy.
With a government shutdown looming at midnight Friday and options expiration taking place, we expect greater than usual market volatility and volume in the market Friday. The S&P is down roughly 16% from its all-time highs set in September 2018.
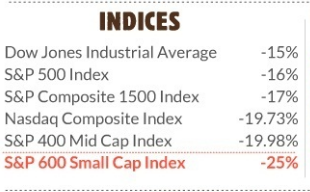
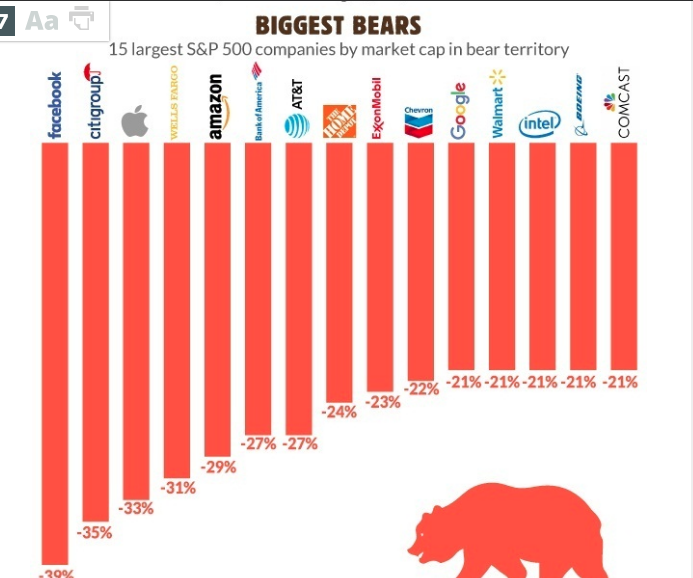
Technically, this is not the textbook definition of a bear market, but who needs a textbook definition to understand that most sectors and large-cap stocks are in a bear market, defined by a 20% decline from peak prices.

Given the uncertainty in the marketplace described above, with instability in the oil complex, with 2s/10s Treasury spreads having flattened to under 10bps recently and the extreme oversold conditions in the marketplace, this is not the time to be a hero as a trader. Near-term, further market declines are probable and any dead-cat bounces may prove to be opportunities to raise cash. The market can be reflexive at times and we do expect some reflexive market reactions very soon. The economy is structurally sound, which will eventually bring about a market recovery beyond simple reflexivity. Until then, capital preservation is well advised, depending on one’s risk-appetite and/or time horizon.


