

Research Report Excerpt #1
The primary trend for the S&P 500 is higher, either due to structure or earnings and presently both are favoring a continuation of the primary, long-term trend. Staying with an uptrend produces more opportunities than most are willing to believe and/or experience. Ironically it isn’t until after the fact that some start to “get it”. The colloquialism “the trend is your friend” is not necessarily about price action, but what the price action can produce for the average investor long-term and how it relates to the primary trend. Let me break this down in simpler terms using the index ETF (SPY):
- Primary trend for SPY is up long-term. So I own SPY as an investor!
- Buy low, sell high… and there will always prove a higher high with time.
- If I sell into strength, lock in some profits, but always maintain some exposure in accordance with a game plan and the primary trend, I also will be afforded an opportunity to once again buy at a lower price during pullbacks/consolidation. This was presented this past week, consolidation.
- I can compound my annual and/or long-term gains through this active portfolio management operation. This equates to the “more opportunities” mentioned above.
- Having knowledge of the primary trend makes the trend your friend.
Successful market participants grasp the notion of keeping things very simple by following the primary market trend. Successful investors avoid the noise, focus on the primary trend.
Research Report Excerpt #2
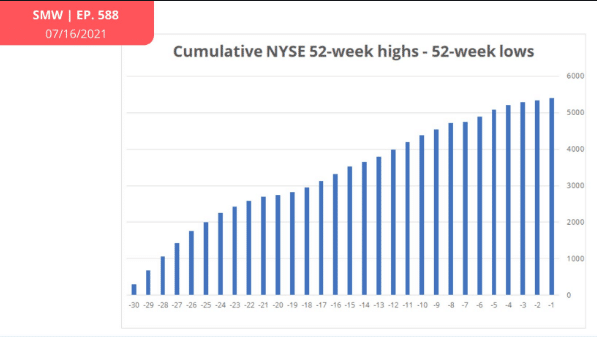
Recognize that while we are discussing FEWER or a DECLINING number of stocks making new highs, stocks are still making new highs, just fewer of them. That’s what the chart above reminds us. The NYSE 52-week highs minus 52-week lows is still ascending. Right now, the market is just choppy or sloppy, if you prefer. It will resolve itself over time as it always does. Funny thing is, cheaper prices have had a tendency to resolve the slop fest more rapidly.
Research Report Excerpt #3
Recall that the S&P 500 just ended a 3-week winning streak by finishing down ~1% this past week. Within this past week, however, the S&P 500 still managed to achieve an all-time high closing price on Monday.
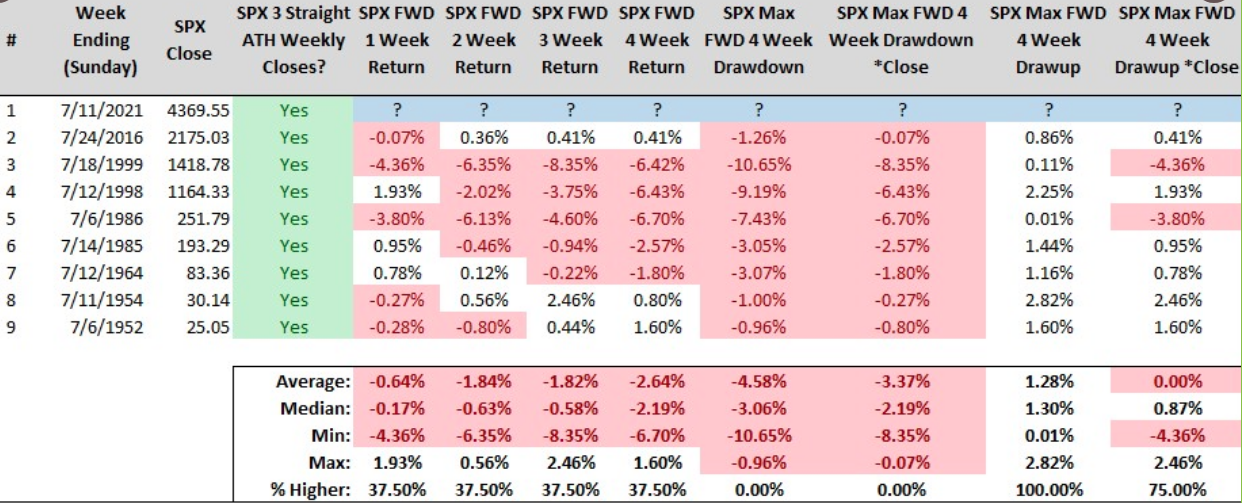
As shown in the quantitative study by Steve Deppe above, 3 consecutive all-time high weekly closes in the month of July have shown a negative bias into the “Ides of August”. This has only occurred 9 times since 1950. Looking forward, the percent higher rate is below 50% across all time frames and the maximum average drawdown is just under 5% over the forward 4-week period. By the way, this study from Steve Deppe is actually in keeping with a former study from Fundstrat that we analyzed, as follows:
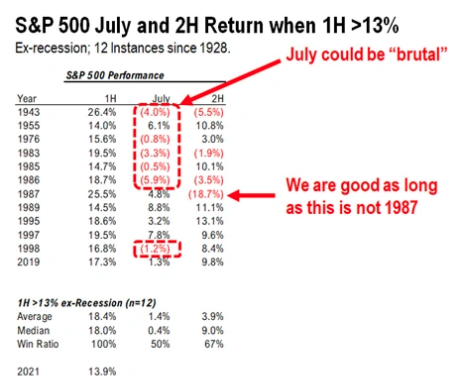
- JUST JULY: gains +0.4% when 1H >13%
- July gains +1.4% all years in general.
- So July has a lower probability of rising and a lower overall return when 1H is >13%.
- This could be seen as a form of market payback. So we would default to expecting July to be somewhat choppy.
- SPX is up .68% month-to-date.
- The caveat: Earnings season could prove a repeat of Q1’s earnings season.
Research Report Excerpt #4
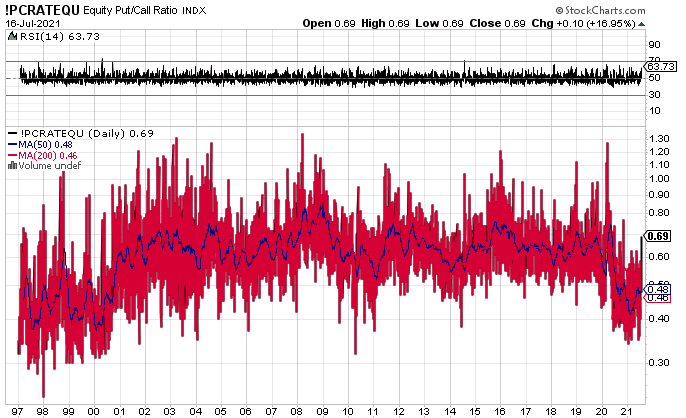
The chart above is that of the Equity Put/Call (P/C) Ratio. It goes all the way back to 1996. I’ve gone back this far because we’ve only seen such lower regimes in the P/C Ratio during that time period of the Dotcom boom and bust cycle, and it was even lower then. The current reading shows a pretty strong spike in the P/C Ratio, the largest since October 2020, the week leading into the Presidential Election, which coincided with a 5.8% weekly decline for the S&P 500. The current spike has resulted in a 1.3% drawdown from the all-time high in the S&P 500.
There are 2 schools of thought here to consider, of which none will we be able to know is predictive today and without the benefit of hindsight:
- The current P/C Ratio reading is the highest of the current regime. Ergo it could be the culmination of peak fear/hedging and closer to the end of the S&P 500 drawdown rather than the beginning of a bigger drawdown.
- The current P/C Ratio reading is normalizing to a higher regime. Ergo, this could still have room to run to the upside with much more downside in store for the S&P 500.
Research Report Excerpt #5
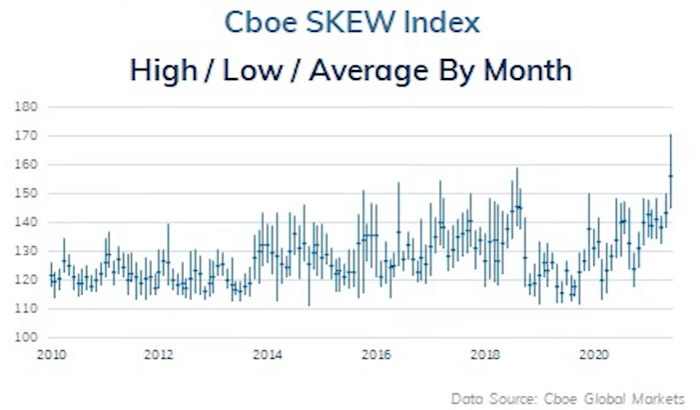
SKEW is a measure of tail-risk being priced by the options market. The chart identifies the SKEW index in June producing its greatest value ever, i.e. investors pricing in the greatest amount of perceived tail risk. While that sounds like an “oh my dear Lord, Christ in Heaven, God of all that is Holy” ominous mouthful situation, take a closer look at the chart.
Firstly, history suggests that the SKEW leads the S&P 500 by an average of 4-5 months. Meaning, if/when SKEW is elevated or well above average, the S&P 500 doesn’t typically have a corrective period for another 4-5 months down the road. Sometimes, the pullbacks are normal, some are garden variety 10% corrections and nothing more. Moreover, in looking at the chart, look at the spike in 2012. From 2012-2014 the S&P 500 delivered double-digit returns each year. Look at the spike to the then all-time high in 2017. Again, 2017 delivered a double-digit return. SKEW was docile in 2019 and the index also delivered a double-digit return (30%+). The point here is that, indeed, many investors are worried about what the SKEW is signaling and maybe that is one of the reasons the VIX Futures are remaining elevated, but SKEW has largely proven an unreliable and less actionable signal for investors. A good to know variable, but little call-to-action.
Research Report Excerpt #6
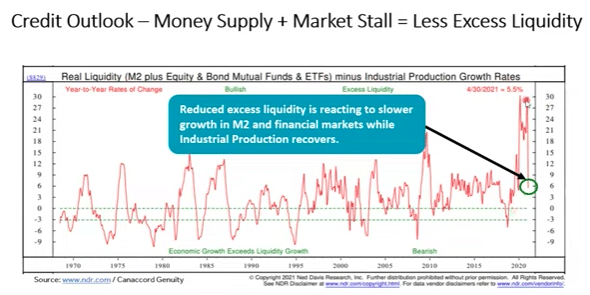
The money supply (M2) growth in the post-pandemic expansion cycle has been record setting. In a consumer-driven economy the answer to a recession has always been to throw money at the economy. Since World War II that has pretty much proven a “best practice”. But what you want to see after that big spike in M2 growth is for the move downward. That is what is identified in the chart above. The move downward identifies that some degree of that M2 growth is being put to work by way of an increase in Industrial Production.
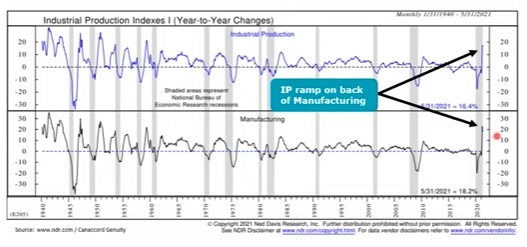
The ramp up in Industrial Production has knock-on effects which are mirrored in Purchasing Manufacturing Indexes (PMIs). We’ve seen ISM PMI’s above 60 for several months, including the latest monthly reading.
Research Report Excerpt #7
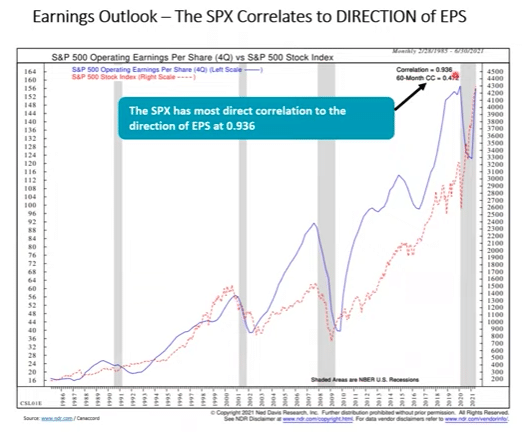
As the chart above shows, the market correlates with the direction of earnings. There has to be a negative direction in earnings in order to have a SUSTAINABLE drop in the S&P 500. Can there prove a 10%, garden variety correction without a directional change in earnings? Absolutely! What matters most is identifying whether or not the direction of earnings has turned negative or has sustained growth. If earnings growth doesn’t change and the S&P 500 drops 5-10%, investors are proven right if they buy that dip. We may be seeing peak earnings growth in Q2 2021, but that doesn’t mean earnings won’t grow thereafter. In fact…
Research Report Excerpt #8
If you’re worried about higher corporate tax rates, let the quantitative data put you at ease. LPL Financial crunched the numbers and found that overwhelming the market still trends higher:
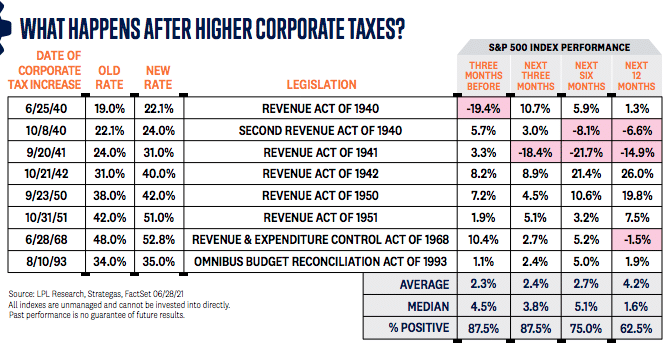
Again and for concerns over capital gains taxes, investors are best aligned with the trends in the economy and earnings more so than the tax implications. It is going to prove incredibly difficult to raise taxes during mid-term elections.
Research Report Excerpt #9
With earnings growth as robust as it proves and yields as low as they have been, investors’ best yield remains with equities. In fact…
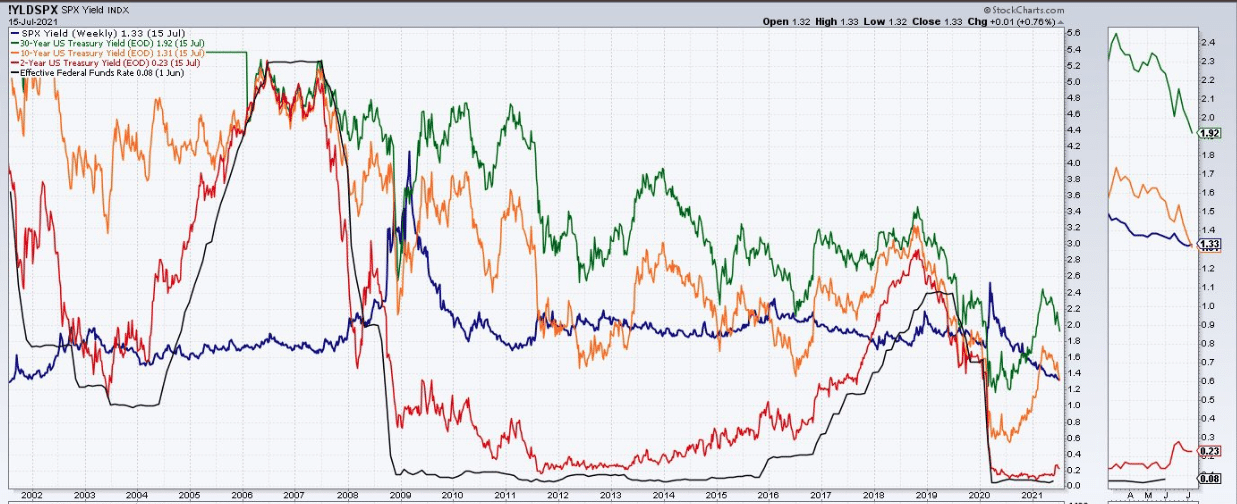
… the chart above identifies the different bond yields, including the 10-yr. bond yield, juxtaposed with the S&P 500 yield itself. Over the last 5 months, the S&P 500 yield was less than that of the 10-yr. bond yield. At the end of this past trading week, the S&P 500’s yield is now greater than that of the 10-yr. bond yield once again and something that could lend a tailwind for risk assets near-term if indeed they become that much cheaper.


