Welcome to another trading week!! In appreciation to all of our Basic membership level participants and daily readers of finomgroup.com content, we offer the following excerpts from our Weekly Research Report. Our weekly report is extremely detailed and has proven to help guide investors and traders during all types of market conditions with thoughtful insights and analysis, graphs, studies, and historical data/analogues. We encourage our readers to upgrade to our Contributor membership level to receive our Weekly Research Report and State of the Market Videos and take advantage of this ongoing promotional event today! Have a great trading week, be in touch and take a look at some of the materials in this weekend’s published Research Report!

Research Report Excerpts #1
With that being said, let’s take a look at some charts, levels, market internals/breadth and the like!
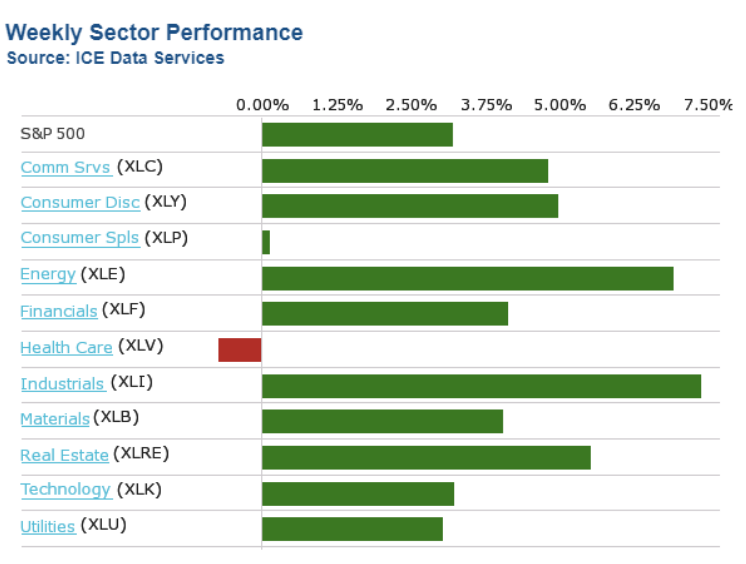
We keep hearing a good deal about the defensive positioning in the market of late, but that has largely proven the case during week’s when the market is down. According to the sector performance chart above for this past week, cyclicals proved the sought after stocks/sectors. In fact, for all the concerns over Industrial Production data, the Industrials (XLI) lead the market this past week. The worst performers were the defensive sectors of the market like Health Care (XLV), Consumer Staples (XLP), Utilities (XLU), and even Technology (XLK) underperformed.
Research Report Excerpt #2
What we want to see is broader market breadth during up moves in the market. Is that what we got with the S&P 500 advancing 3.2% this past week?
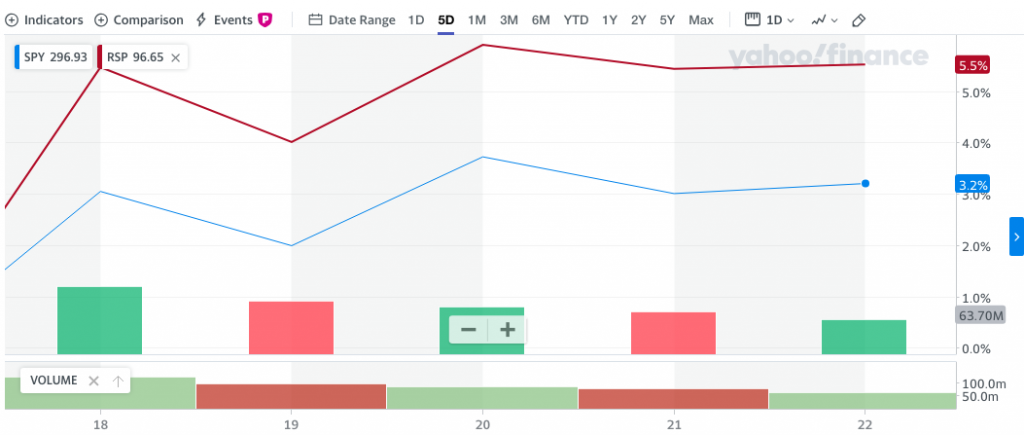
As we can see from the chart above, indeed, that is exactly what we saw during the upward trend this past week. The cap-weighted SPY rallied 3.2% while the equal-weighted RSP rallied 5.5% on the week.
Not only did equal-weight lead the cap-weight S&P 500, but small-caps lead large-caps this past week. This is something we also want to see as a signal post suggesting this is not just another bear market rally. While the Nasdaq (NDX) led the major large-cap indices higher during the week, the Russell 2000 (RUT), otherwise known as the small-cap index, led all major averages with a 7.84% advance on the week. At the index and/or sector ETF level, small-cap ETFs carried that breadth as well.
Research Report Excerpt #3
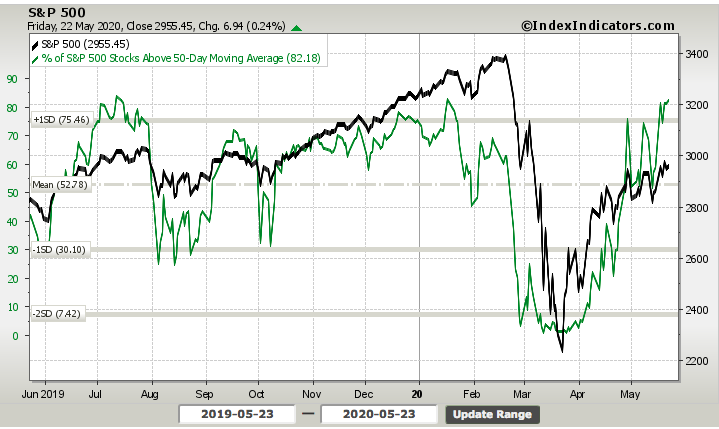
In order to meet the standard of a new bull market, the percent of stocks trading above their 50-DMA needs to be 85% or better. To end the week, the index achieved just over 82% of stocks. Moreover, the breadth indicator (green line) has made a higher high and successive higher lows, indicating broad breadth improvement throughout the relief rally period. If we were to combine the breadth of the S&P 500 with the offensive sector participation amongst investors of late, we could suggest that the S&P 500 was poised to achieve the 200-DMA as early as the coming week and with 85% of stocks trading above their 50-DMA. There are no guarantees, but a goodly amount of the technical and breadth analysis appears to favor this outcome, barring any exogenous headlines.
Research Report Excerpt #4
Another, nonconventional yet growing in popularity means for assessing the reopening of the economy’s activity is through OpenTable’s state of the restaurant industry report. The firm is updating this report daily, which lends itself, in conjunction with the Gallup survey, to identifying improving or weakening consumer activity.
This data shows year-over-year seated diners at restaurants on the OpenTable network across all channels: online reservations, phone reservations, and walk-ins. For year-over-year comparisons by day, we compare to the same day of the week from the same week in the previous year. For example, we’d compare Tuesday of week 11 in 2020 to Tuesday of week 11 in 2019. Only states or cities with 50+ restaurants in the sample are included. All such restaurants on the OpenTable network in either period are included.
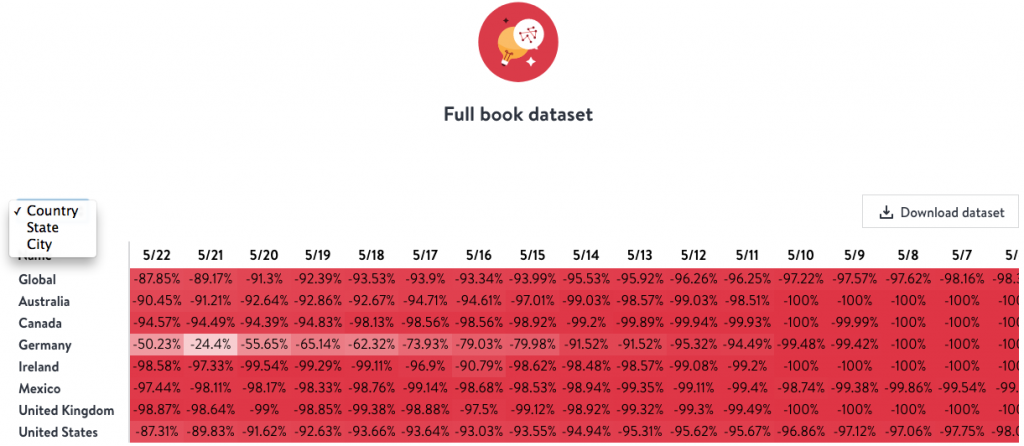
As we can see from the table’s daily data above, which can be viewed by country, city and/or state, the U.S. is showing improvement each day and since the first week of May. We would expect the data to show increasing levels of improvement over the next couple of months and as more economic opportunities resume, absent shelter-in-place guidelines.
When the economy returns to normal, which we would presume will take at least 12-18 months, it will demand consumer spending and investment. Thus far, believe it or not, the data collected by Cowen Research suggest the consumer is already spending above levels seen in China and Europe post the lockdown periods in the respective regions.
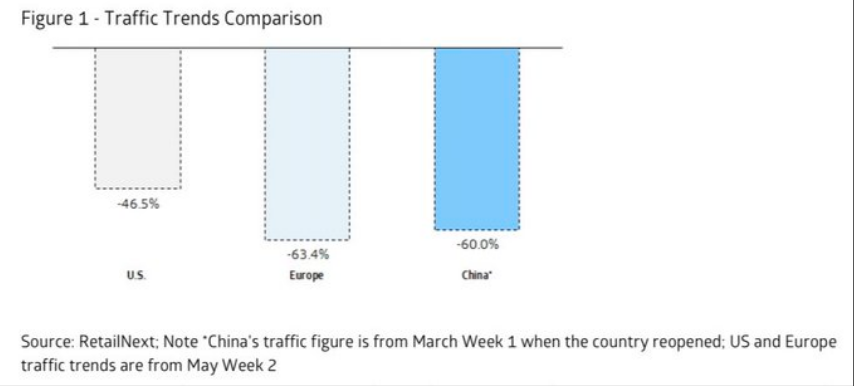
“US retail traffic is “better than feared, and encouragingly, the U.S. is tracking better than Europe and China when it first reopened. .. Jewelry and apparel are among the worst-performing categories, while footwear is performing better.”
Research Report Excerpt #5
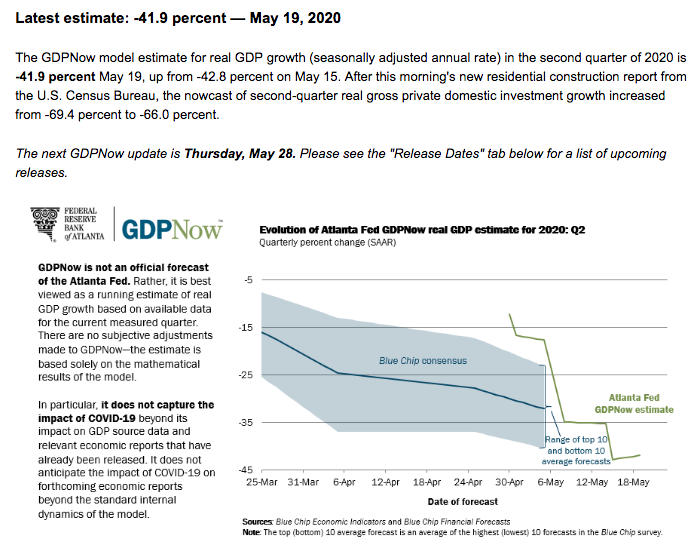
Come Thursday, investors will have more information for which to add to the stockpile of record setting economic data. Estimates for initial jobless claims will be made by Tuesday and Q1 2020 GDP is expected to be revised lower, but by how much remains to be seen. As we are now halfway through the Q2 2020 period, investors are largely looking forward as well and toward the Q2 GDP estimates. GDP is reported at a seasonally adjusted annual rate (SAAR). So a 40% Q2 decline is around 9% decline from Q1 (SA).
- From Merrill Lynch: We are tracking 2Q GDP at -40% qoq saar, down from -30% earlier. [SAAR May 22 estimate] emphasis added
- From Goldman Sachs: We left our Q2 GDP forecast unchanged at -39% (qoq ar) but raised our estimate of the initial vintage by 0.3pp to -31.5% (released on July 30th). [May 22 estimate]
- From the NY Fed Nowcasting Report: The New York Fed Staff Nowcast stands at -30.5% for 2020:Q2. [May 22 estimate]
The latest Atlanta Fed GDPNow tracker for Q2 GDP came in at -41.9% to end the week. Keep in mind that these estimates will update weekly and are prone to sharp moves.
Research Report Excerpt #6
Last, but certainly not least, this is the lowest number of people in the ICU due to COVID-19 since early April.
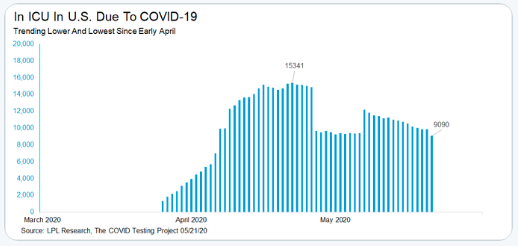
To be clear, Finom Group does not anticipate another shutdown or shelter-in-place order on a national scale even if a secondary spread of the coronavirus appears in the fall-winter months. The cost to the economy has outpaced the mortality rate from COVID-19 and for which the Federal government is likely to find the cost/benefits analysis an unproven measure. Secondly, we would likely recognize the timelines in consideration by the Federal government regarding a vaccine and drug treatment that usurp a demonstrated need to re-shutter the economy.
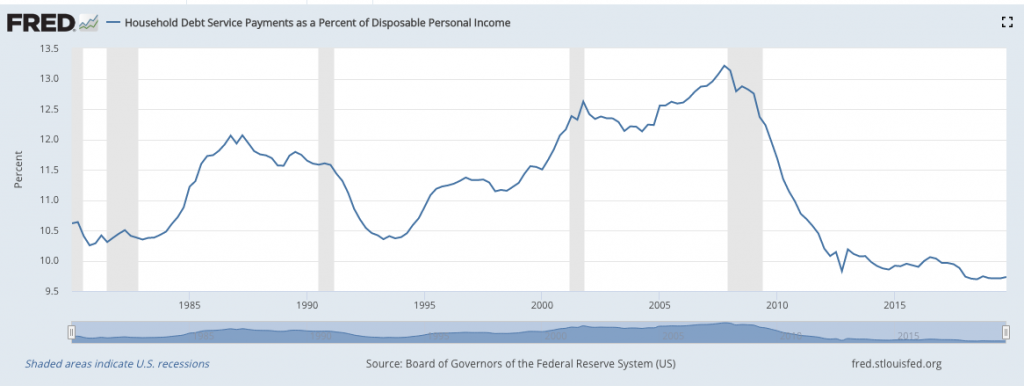
While we believe the recovery process to be a slow one, possibly slower than the post-GFC period, the consumer came into the recession with a better balance sheet and higher wages that are likely to provide the economy with a stronger base than the post-GFC period. (Chart of Household debt service payments as a percent of disposable income)
Research Report Excerpt #7
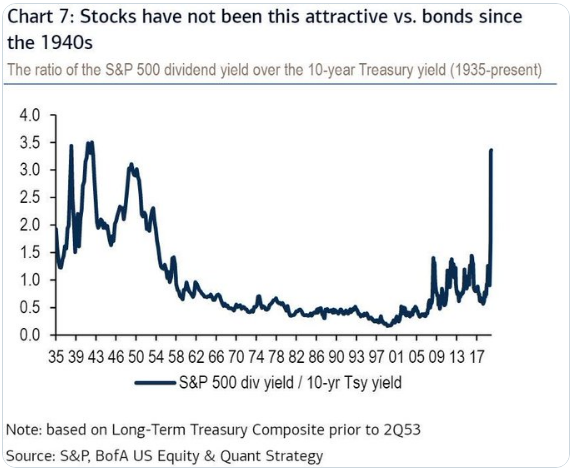
1. One of the most glaring reasons why investors should buy the dip is with respect to the equity risk premium (ERP) and or the relative value of stocks:bonds.
Research Report Excerpt #8
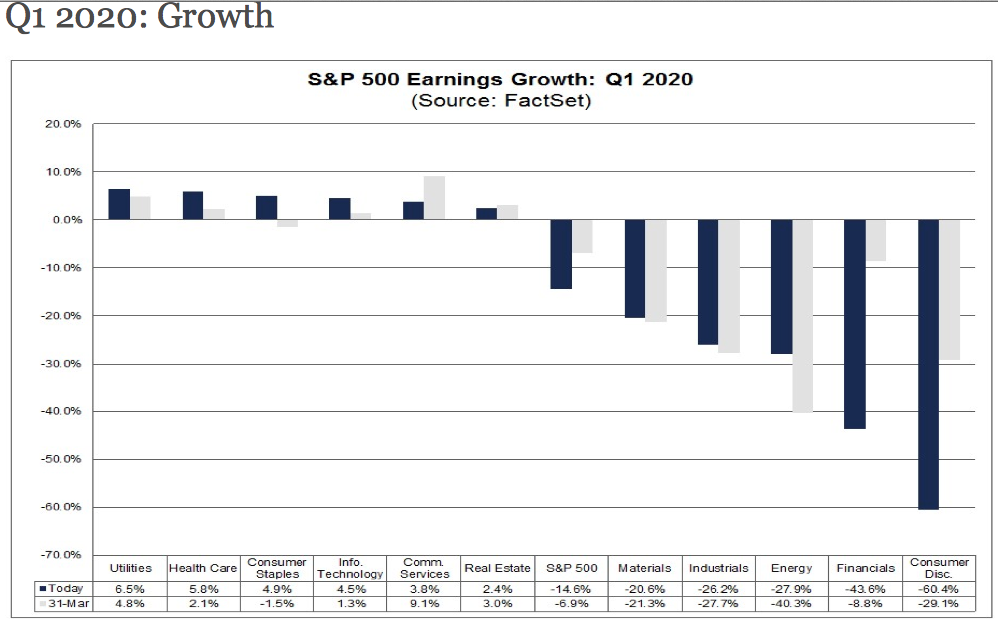
Through the first quarter to-date, S&P 500 EPS is tracking down 14.6% according to FactSet data. The forward 12-month P/E ratio or the S&P 500 is 21.0. This P/E ratio is above the 5-year average (16.8) and above the 10-year average (15.1). Ok, we’re not saying the market isn’t expensive, but to refer to our prior point concerning ERP…
- For Q2 2020, analysts are projecting an earnings decline of -42.9% and a revenue decline of -11.5%.
- For Q3 2020, analysts are projecting an earnings decline of -24.8% and a revenue decline of -5.7%.
- For Q4 2020, analysts are projecting an earnings decline of -12.4% and a revenue decline of -1.4%.
- For CY 2020, analysts are projecting an earnings decline of -20.8% and a revenue decline of -3.9%.
- For CY 2021, analysts are projecting earnings growth of 27.8% and revenue growth of 8.6%.
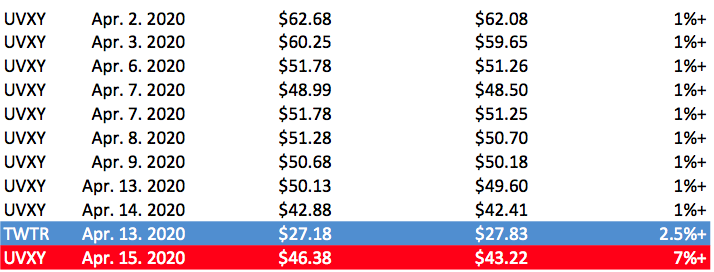
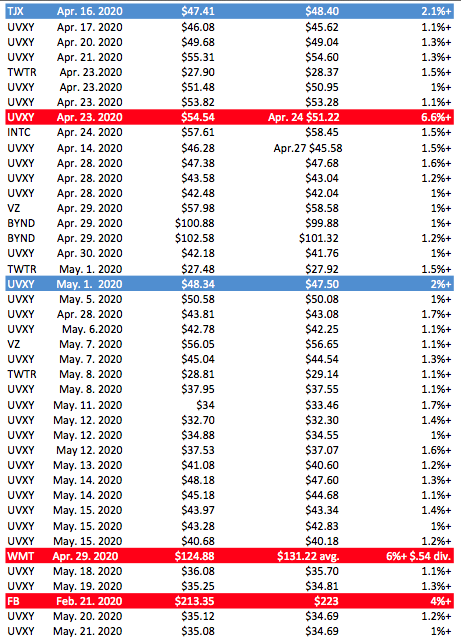
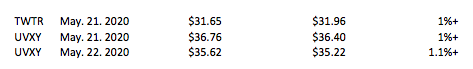
Thank you for taking the time to review some of our notes from within this past weekend’s Research Report. In the month of June, our monthly membership fees will be moderated higher to reflect increased operating costs. We encourage our members to upgrade ahead of the adjustments. The Contributor membership will moderate from $5.99 to $7.99 and the Premium membership will moderate from $39.99 to $49.99. By upgrading before June, the prior rates will be locked-in permanently. Below are the tracked, issued and completed trade alerts to our Premium and Master Mind Options members. (UVXY short trades).