Sometimes, a market in retreat is a good thing, warranted and even desired. I would suggest that all these descriptive terms characterize present market conditions based on several factors, but more prominently overbought breadth indicators also recognized as market internals. From the S&P 500’s daily Relative Strength Index (RSI) tipping above 80 to the number of stocks trading above their 20, 50 and 200 EMA, market breadth has reached levels for which the typical drawdown ensues.
In this weekend’s Research Report, I discussed market breadth/internals as follows:
“The bull market is intact and should remain intact unless an unforeseeable, exogenous event should undermine consumer sentiment and consumer spending. The aforementioned are the pillars of the U.S. economy. With investors believing the consumer is strong and trade issues are being resolved, the S&P 500 has rallied some 9% above its 50-DMA. It has accomplished this feat of strength with great breadth and strength as well. The S&P 500 is now extremely overbought according to the latest Relative Strength Index reading (RSI > 80).
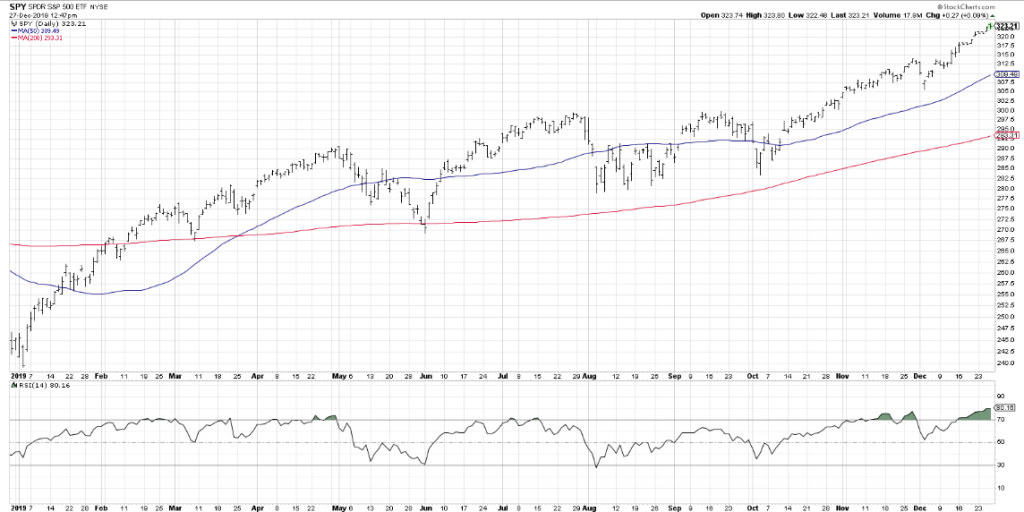
As shown in the bottom box of the chart, the RSI is now at levels that suggest a pullback, then at least one more push higher possibly. Once again, this is an annual chart of the S&P 500 and daily RSI which does denote the high probability of a pullback near-term. How much of a pullback is the only question that likely remains.”
This analysis from our weekend Research Report may seem very prescient given the nearly .6% loss on the S&P 500 Monday, but the reality is this is still not yet considered a typical pullback. This is merely distribution or minor relief of extreme sentiment and overbought conditions. Until, at least, a 3% pullback is achieved in the S&P 500, all we have is market distribution that doesn’t necessarily breed improved sentiment over market valuations.
Moreover, when we review certain market internals from Monday’s action, we discover the notion of distribution is the most appropriate context. The following chart from David Keller recognizes distribution in the way of the number of decliners and advancers.
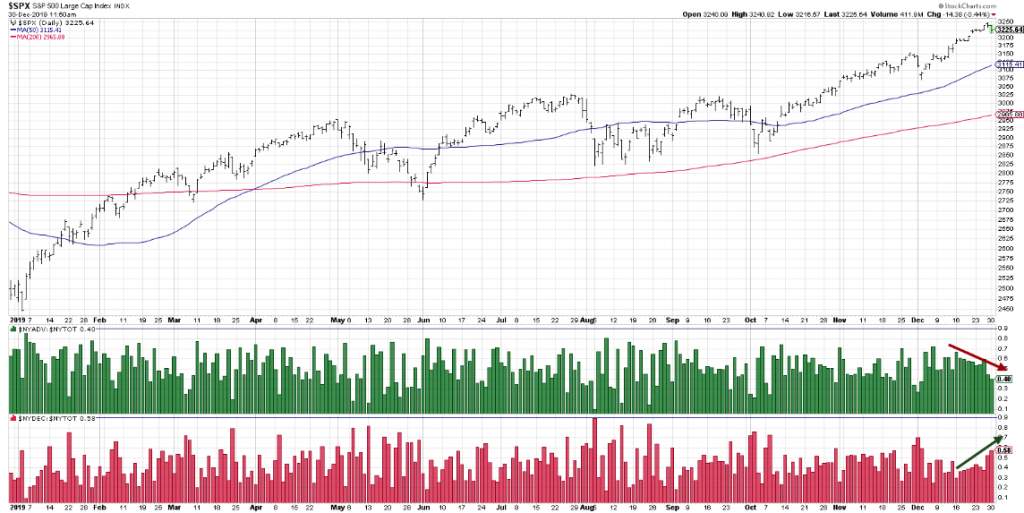
What you want to see the market express during times of distribution are a rapid increase in decliners and a rapid decrease in advancers, as indicated by the arrows in the lower boxes within the NYSE charts. (top box S&P 500) The impetus for the selling pressure from the opening bell on Monday is recognized as merely profit taking and last-minute tax loss selling. There were no exogenous headlines that loomed in the background, if anything, the geopolitical headlines proved favorable.
Vice-Premier Liu He of China is set to lead a delegation to Washington this Saturday, where he is expected to sign a phase one deal that would significantly de-escalate the U.S.-China trade war, a source briefed on the matter has told the South China Morning Post.
“Washington has sent an invitation and Beijing has accepted it,” said the source, who declined to be named due to the highly sensitive nature of the information. The Chinese delegation is expected to stay “a few days” in the US until the middle of next week, the source added.

It is easy to look at the S&P 500’s 29% gain in 2019 as robust and found with little more than multiple expansion given that EPS is basically expected to be flat on the year. I would argue that the market is a forward pricing mechanism, however, and investors are anticipating an EPS rebound to growth in 2020, whereby typically EPS exceeds analysts’ expectations. Additionally, the 29% S&P 500 gain in 2019 is seemingly only so robust when looked at from that more simplified basis, one year. The reality is that if broaden our lens a bit wider, we come to recognize a more subdued performance.
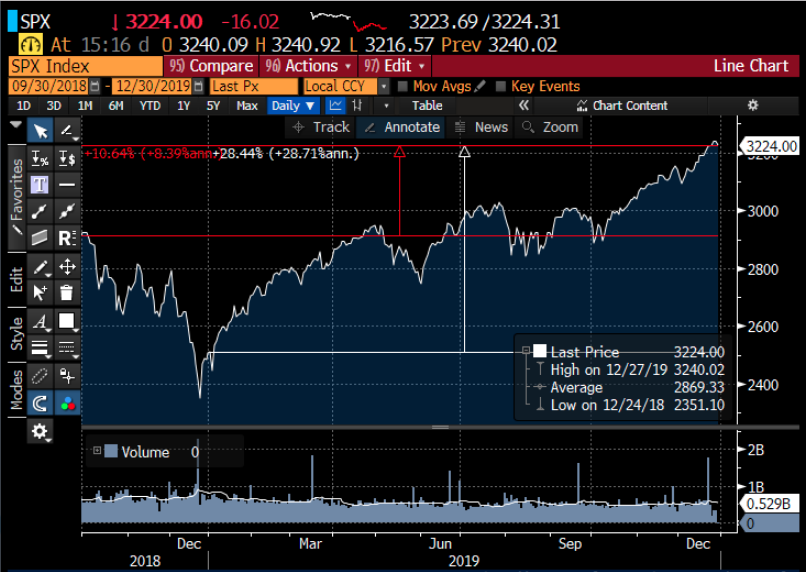
While some investors will say this year’s 29% gain in the S&P 500 is unhealthy & bodes ill for 2020, I’m of the opinion that is the least appropriate perspective. If we calculate gains from Sep. 30, 2018, the high of 2018, one gets an annualized return of just 8.4 percent. (See chart below) This is far less inspiring or robust, but obviously a great deal more sustainable!
It’s all about perspective and comprehension folks, all about perspective and comprehension, especially if you aim to outperform. Unfortunately outperformance doesn’t tend to proliferate amongst the hedge fund community. The hedge fund industry saw more closures than openings for the fifth year in a row in 2019 as dismal returns and lofty fees pushed investors away, Bloomberg reported Monday, citing data from Hedge Fund Research Inc.
More than 4,000 funds have liquidated assets over the past five years, according to Bloomberg, citing Hedge Fund Research data. Of the five consecutive years of net fund closures, 2016 marks the only year with more closures than 2019.
Investors fled the high-risk funds for cheaper vehicles amid the record-long bull market. Members have pulled $81.5 billion from hedge funds in the year through November, Bloomberg reported citing eVestment data, more than twice the amount pulled from funds in 2018.
Hedge funds were also unable to match the S&P 500‘s rapid growth through the year. The index is up roughly 29% year-to-date and on track to post its best yearly gain since 1997.
The hedge fund industry, which relies on risky investments to outperform the general stock market, struggled to keep up. The Bloomberg Equity Hedge Fund Index is up just 10% this year. Unlike the hedge fund industry, it’s been another strong year for the Golden Capital Portfolio which I manage for private clientele. The Golden Capital Portfolio will finish the year nearly doubling the S&P 500, after fees.
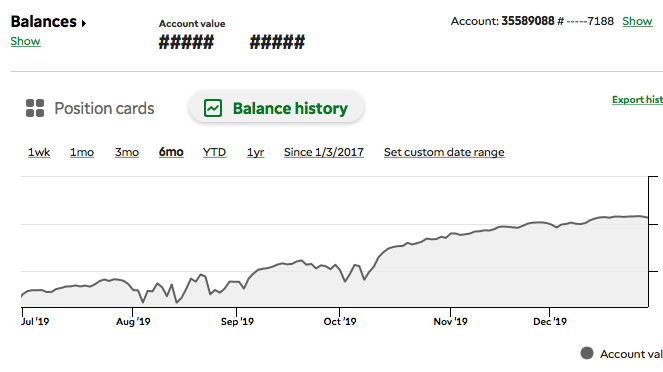
The portfolio benefitted from a year in which the market as a whole drifted higher throughout the year while VIX-ETPs (UVXY/VXX) remained under strong pressure throughout much of the year. Unlike 2018, the short-Volatility strategy proved one of the most profitable strategies employed in 2019. (GCP returns in 2018 +4.5% after fees).
With the final trading day of the quarter, year and decade afoot Tuesday, investors may feel a bit wounded after Monday’s performance and uncertain of what Tuesday has in store. I would suggest considering the coming year above the immediacy of the day, as the economy remains on solid footing and the consumer is somewhat strapped with cash by way of a healthy household balance sheet and wages that rose roughly 3% in 2019. Now let’s also consider the following, from the Trader’s Almanac…
Normally, the S&P 500 posts an average gain of 1.3% for the so-called “Santa Claus Rally (1 trading day before Christmas and the 6 days after Christmas).
“The failure of stocks to rally during this time tends to precede bear markets or times when stocks could be purchased at lower prices later in the year”, according to the Trader’s Almanac.
“Our January Indicator Trifecta combines the readings from the SCR, our First Five Days “Early Warning” System and our full-month January Barometer. When all three of these indicators are in agreement it has been prudent to heed their call.“
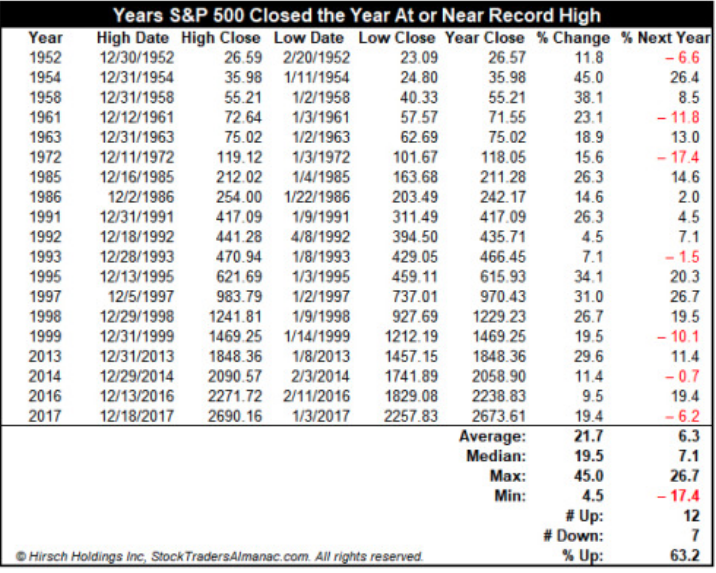
Here is a table of all the years the S&P 500 made a record high in December. There are 19 of them. The following years were not great, but not horrible, up 63.2% of the time (up 12, down 7) with an average gain of 6.3% and a median gain of 7.1 percent.
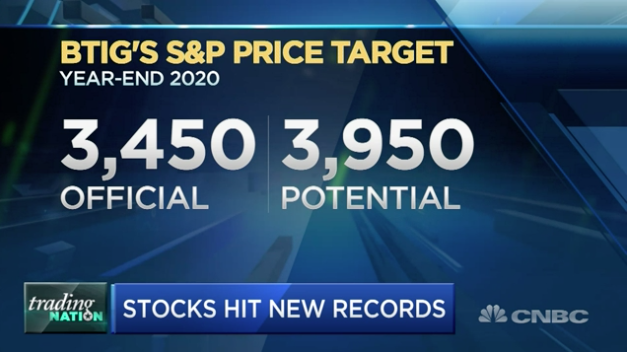
The probabilities for S&P 500 gains in 2019, even with a less robust Santa Claus rally, still point in a nicely positive direction. Having said that, sometimes it’s more about “how we get there” than it is “that we get there”. In other words, many Wall Street Analysts have been found already ratcheting up there S&P 500 price target for 2020. While most see the S&P 500 rising roughly 3-6% in the New Year, sentimental market price targets suggest the S&P 500 can climb double digits, even another 20% or greater.
BTIG’s Julian Emanuel believes 2020 will be a milestone year. With the major indexes kicking off Christmas week at fresh all-time highs, he’s not ruling out a 22% surge in the S&P 500. The reason: Most investors don’t trust the record rally.
“We think confidence will ultimately translate into the public getting this enthusiasm for stocks which could cause prices to move as high as 3,950.”
But I hope to reiterate, where the market ends the year in 2020 is likely dependent on where it heads in the first quarter of the year, and after such a strong finish to 2019. If the market continues to trend higher, achieving much of the forecasted 2020 gains too soon, a more severe check-back/pullback may be produced that finds investors in a panic once again. One can say the the end of 2019 somewhat resembles the market’s performance at the end of 2017 and through January 2018. We all remember what happened, as February 2018 came to be.
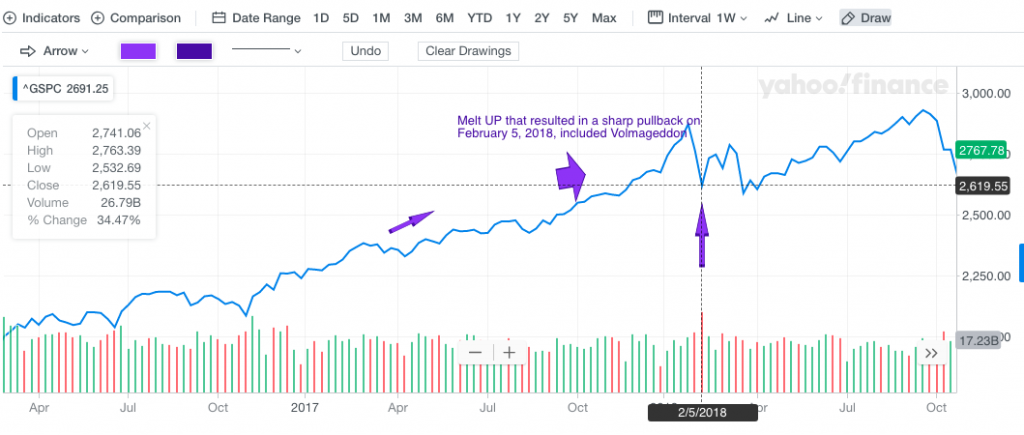
It’s with the melt-up from 2017 into early 2018, and without a single 3% pullback throughout 2017, found a sharp one-day, peak-to-trough decline in the S&P 500 of roughly 5 percent… in one day, 5 percent. The VIX rose 105% intraday as well, obliterating many short-VOL positions and resulting in the accelerated termination of the VIX-ETP formerly traded under the ticker symbol XIV. It is unlikely that any of the market bulls desire a repeat of this scenario and outcomes. And this was recently front of mind with famed analysts and strategist Ed Yardeni.

The headline from the recent interview with Ed Yardeni on CNBC is seemingly ominous for a long time market bull. It’s supposed to be, as the objective is to attract readers. But upon reading the totality of the article and even Yardeni’s penned LinkedIn blog, he outlines the correction noted above is predicated on whether or not the market continues its melt-up as it did from 2017-early 2018.
“The main near-term risk is a melt-up that could set the stage for a correction. My S&P 500 forecast for year-end 2020 is still 3500. I just hope we don’t get there well ahead of schedule.”
This is where it proves most applicable to read the whole article, as opposed to just a mere attention-grabbing headline. It’s the details folks, the details!
As I mentioned earlier in this Daily Market Dispatch article of the day, “Sometimes, a market in retreat is a good thing, warranted and even desired.” Yardeni is likely of the same mindset given how overbought the market has become through Q4 2019. Yardeni isn’t the only one discussing this matter. CNBC’s Bob Pisani shares a similar concern with Yardeni.
Could it really be that things got so good with the market… it’s actually bad? I’d be hesitant to go that far, but there’s nothing wrong with profit taking and prudence in the interim, based on this investor’s opinion. Here’s what Bob Pisani had to say about the markets in his recent narrative…
“Even without weaker economic data, the market is notably overbought and due for a pause. The 14-day relative strength index for the S&P 500, a momentum indicator widely watched by Wall Street technicians, is at 78, the highest level since January 2018. Any reading over 70 is overbought, readings near 80 are very overbought.”
The pause would be welcome, Alec Young, managing director of global markets research at FTSE Russell noted. “The market does better with two steps up, one step back. It would be nice to get a little digestion before another leg up happens.”
Speaking of weaker economic data, well, let’s hope that’s not what we have to speak about. Nonetheless, last week’s and Monday’s economic data was fairly decent. It was decent enough for Goldman Sachs and Merrill Lynch to have raised their Q4 2019 GDP estimates, at least.
Goldman: “Following this morning’s data, we increased our Q4 GDP tracking estimate by two tenths to +2.0% (qoq ar).”
Merrill Lynch: “Last week data boosted our 4Q GDP tracking estimate by 0.4pp to 2.0% qoq saar as positive trade offset negative inventories.”
If I’ve said it once I’ve said it a hundred times since the Spring of 2019, “Housing sector data remains strong.” The index of Pending home sales increased 1.2% in November from the previous month, the National Association of Realtors reported Monday.
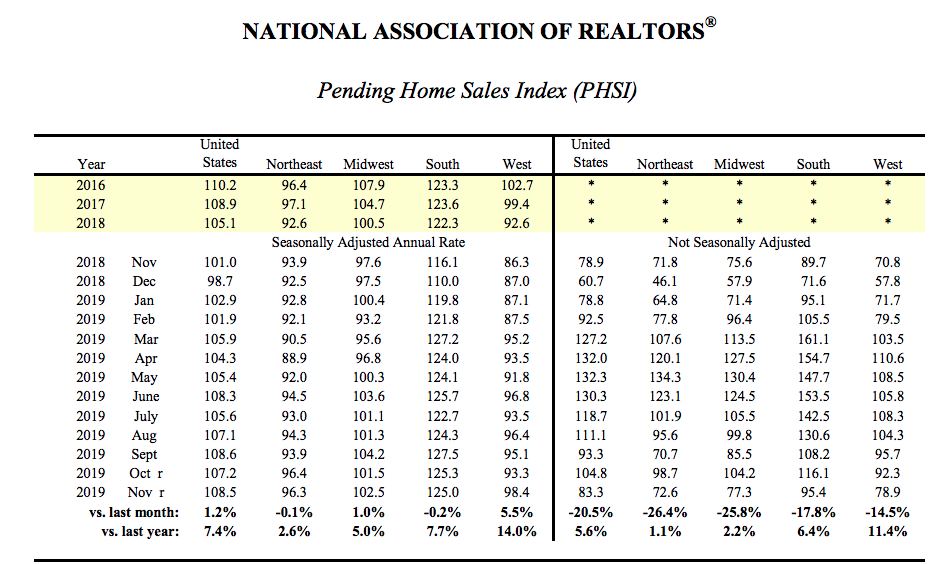
Compared with November 2018, contract signings were up 7.4%. The index is benchmarked to contract-signing activity in 2001.
With mortgage still nearly a full point below the same period a year ago, housing demand has remained robust and affordability is less challenged at year-end. Nonetheless, inventory may prove the headwind for the housing sector should demand remain healthy in 2020.
“Despite the insufficient level of inventory, pending home contracts still increased in November,” said Lawrence Yun, chief economist for the National Association of Realtors. “The favorable conditions are expected throughout 2020 as well, but supply is not yet meeting the healthy demand.”
Alongside the Pending home sales data improving, certain regional PMIs showed improvement on a MoM basis. The Chicago Purchasing Management Index rose to 48.9 this month from a revised 46.2 in November and 43.2 in October. The October reading was the weakest since the end of 2015.
Also on Monday, the Dallas Fed released its Texas Manufacturing Outlook Survey for December. The latest general business activity index came in at -3.2, down 1.9 from -1.3 in November. All figures are seasonally adjusted.
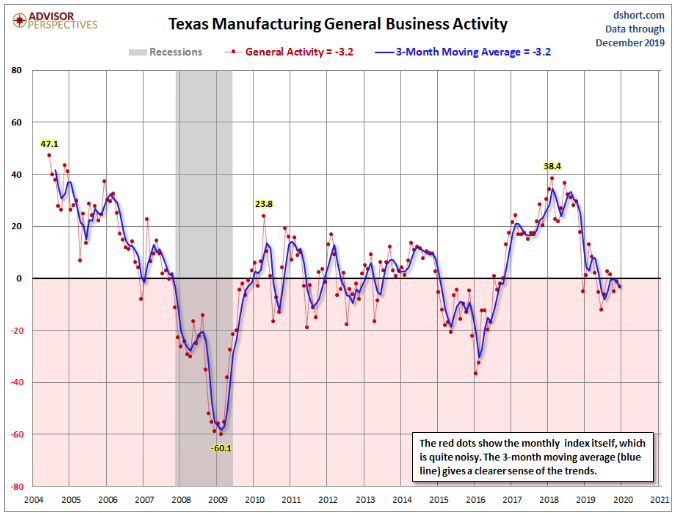
Growth in Texas factory activity resumed in December, according to business executives responding to the Texas Manufacturing Outlook Survey. The production index, a key measure of state manufacturing conditions, rebounded to 3.6 after dipping into negative territory last month.
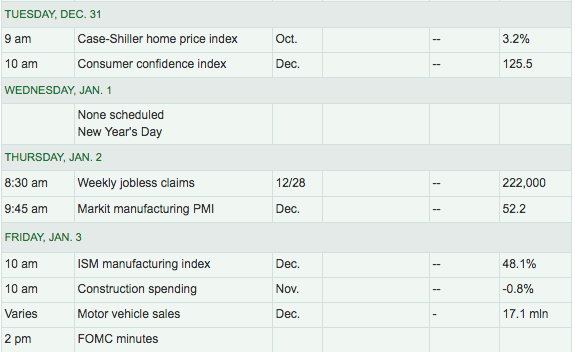
On Tuesday, the final trading day of 2019, investors will get another look at consumer confidence levels come 10:00 a.m. EST and with the Conference Board’s release of the Consumer confidence index. I’m expecting a bit of a rise in consumer confidence in December and post the trade war de-escalation that coincided with a nice market melt-up in December. Consumers feel better when markets are stable and/or rising.
“The typical American consumer knows stock price volatility can presage an economic slowdown,” wrote Nicholas Colas, Co-founder of DataTrek Research, in September.
“When they see U.S. equity markets take a drop, they google ‘dow jones’ to learn more. Stock market volatility generates far more Google search interest than ‘recession. The October 2008 equity market meltdown saw four times the number of “dow jones” searches relative to “recession.”
The search ratio was 7:1 during the month of August 2019, when the University of Michigan’s consumer confidence index dropped to its lowest level since October 2016, just ahead of the U.S. presidential election, according to DataTrek.
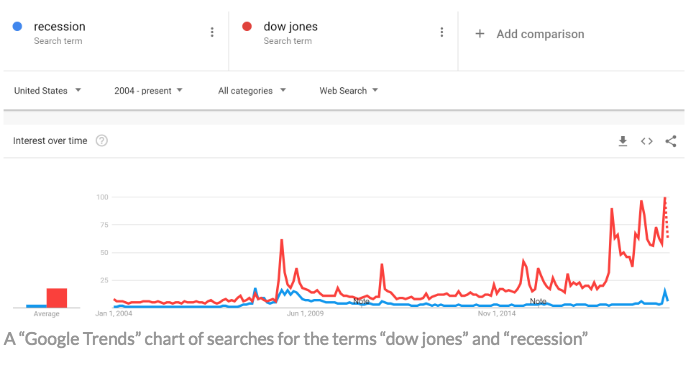
Colas also noted that a lot would hinge on equity markets keeping calm over the often volatile year-end period, which could dampen U.S. consumer confidence. “The Google Trend data shows ever-higher levels of concern whenever stock markets fall.”
As I complete our final Daily Market Dispatch for 2019 and look forward to 2020, the call of the day comes from Torsten Slok, chief economist at Deutsche Bank Securities. He said the decade-long economic expansion could continue for “many more years,” putting forward a bull case for markets in 2020.
“The expansion had been characterized by an “extreme degree of caution” among consumers and companies since 2008-09, with discretionary spending still below historical averages.
“The lack of willingness to spend on consumer durables and corporate capex is also the reason why this expansion has been so weak. And it is also the reason why this expansion could continue for many more years; we are simply less vulnerable to shocks in 2020 because there are few imbalances in the economy.”
I tend to agree with Slok’s characterization of the consumer based on the Personal Savings rate which further identifies the consumer as being much more responsible than in past expansion cycles.
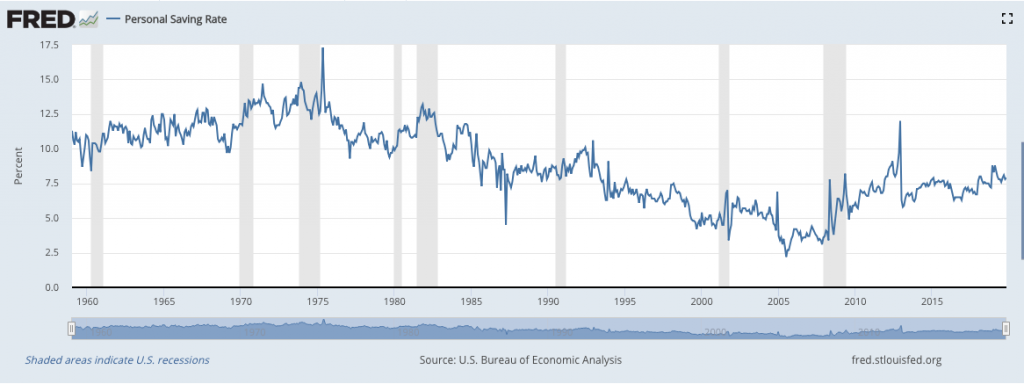
This is the first expansion cycle since the 1970s whereby the Personal Savings rate rose through the expansion cycle. It’s different, indeed it’s different this time!
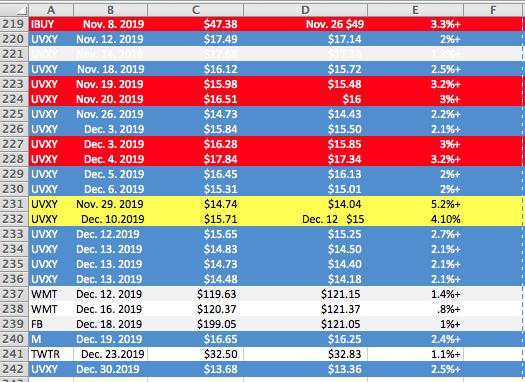
We invite all of our readers to join us in the Premium Trading Room for the New Year and trade with us. In 2019, we offered 242 trade alerts with a 99% hit rate!
Finom Group trade alerts are modeled from the Golden Capital Portfolio, which has generated returns above the S&P 500 since 2012. Subscribe to our Premium Membership level and receive our trade alerts, weekly Research Report and State of the Market videos. And in the New Year, we also plan to offer a special subscription service for options trading education and strategies. Inquire about our Mastermind Options service for 2020, by filling out our Contact Us form today to reserve your membership! Happy and Healthy New Year!