

Research Report Excerpt #1
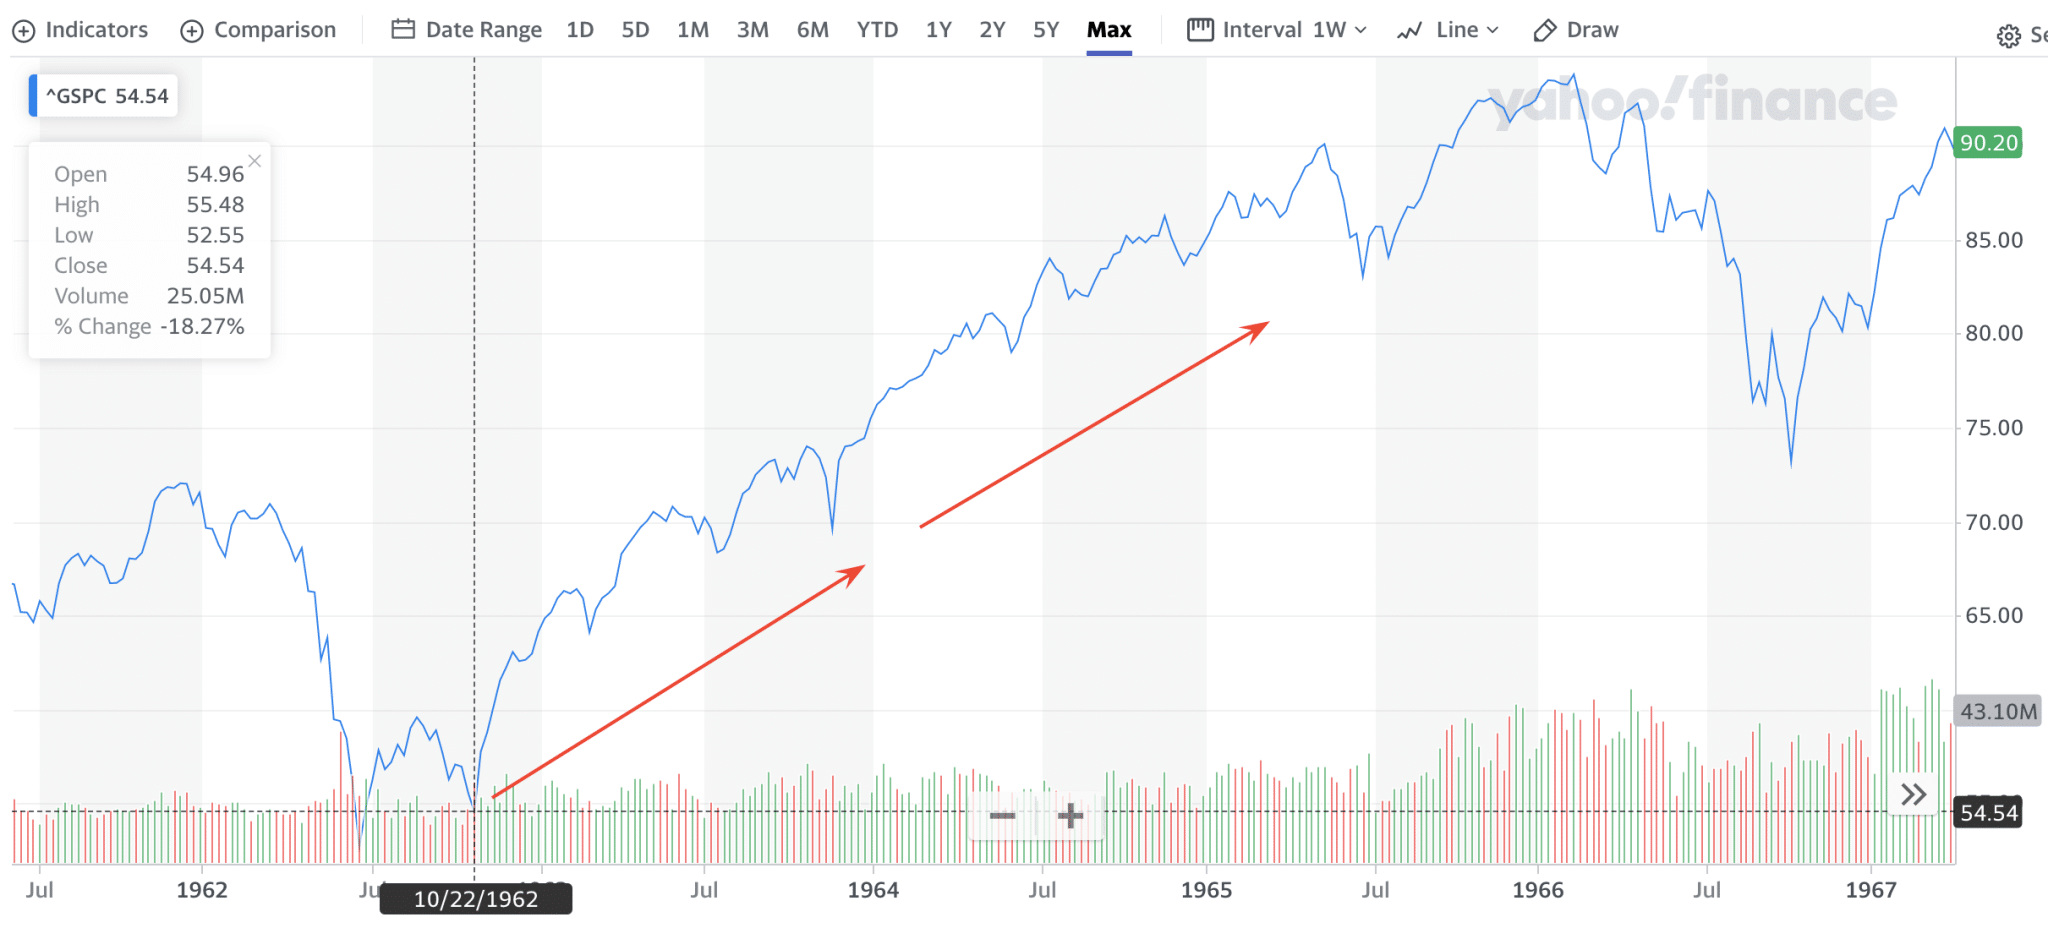
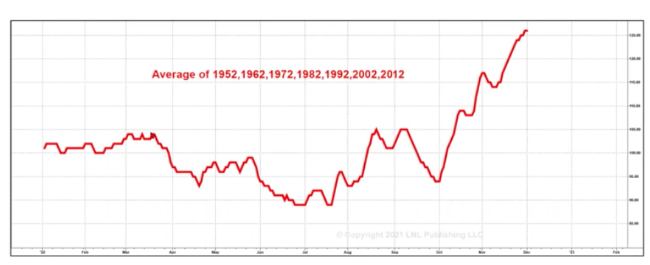
The chart of the S&P 500 above is the exact price action from a double-bottom, bottoming process in 1962, whereby the index took off through the end of October and into 1963. Indeed, just as it was in 1962, the markets found the June rally sputter and falter through September, into early October. In 2022, which also carries the Decennial and Midterm election year characteristics of 1962, the markets are still closely following the analogue. Below is a chart that reminds investors about the historical tendencies and average S&P 500 performance during Decennial years. Notice the climactic bottom from September into October, and lift-off thereafter?
Research Report Excerpt #2
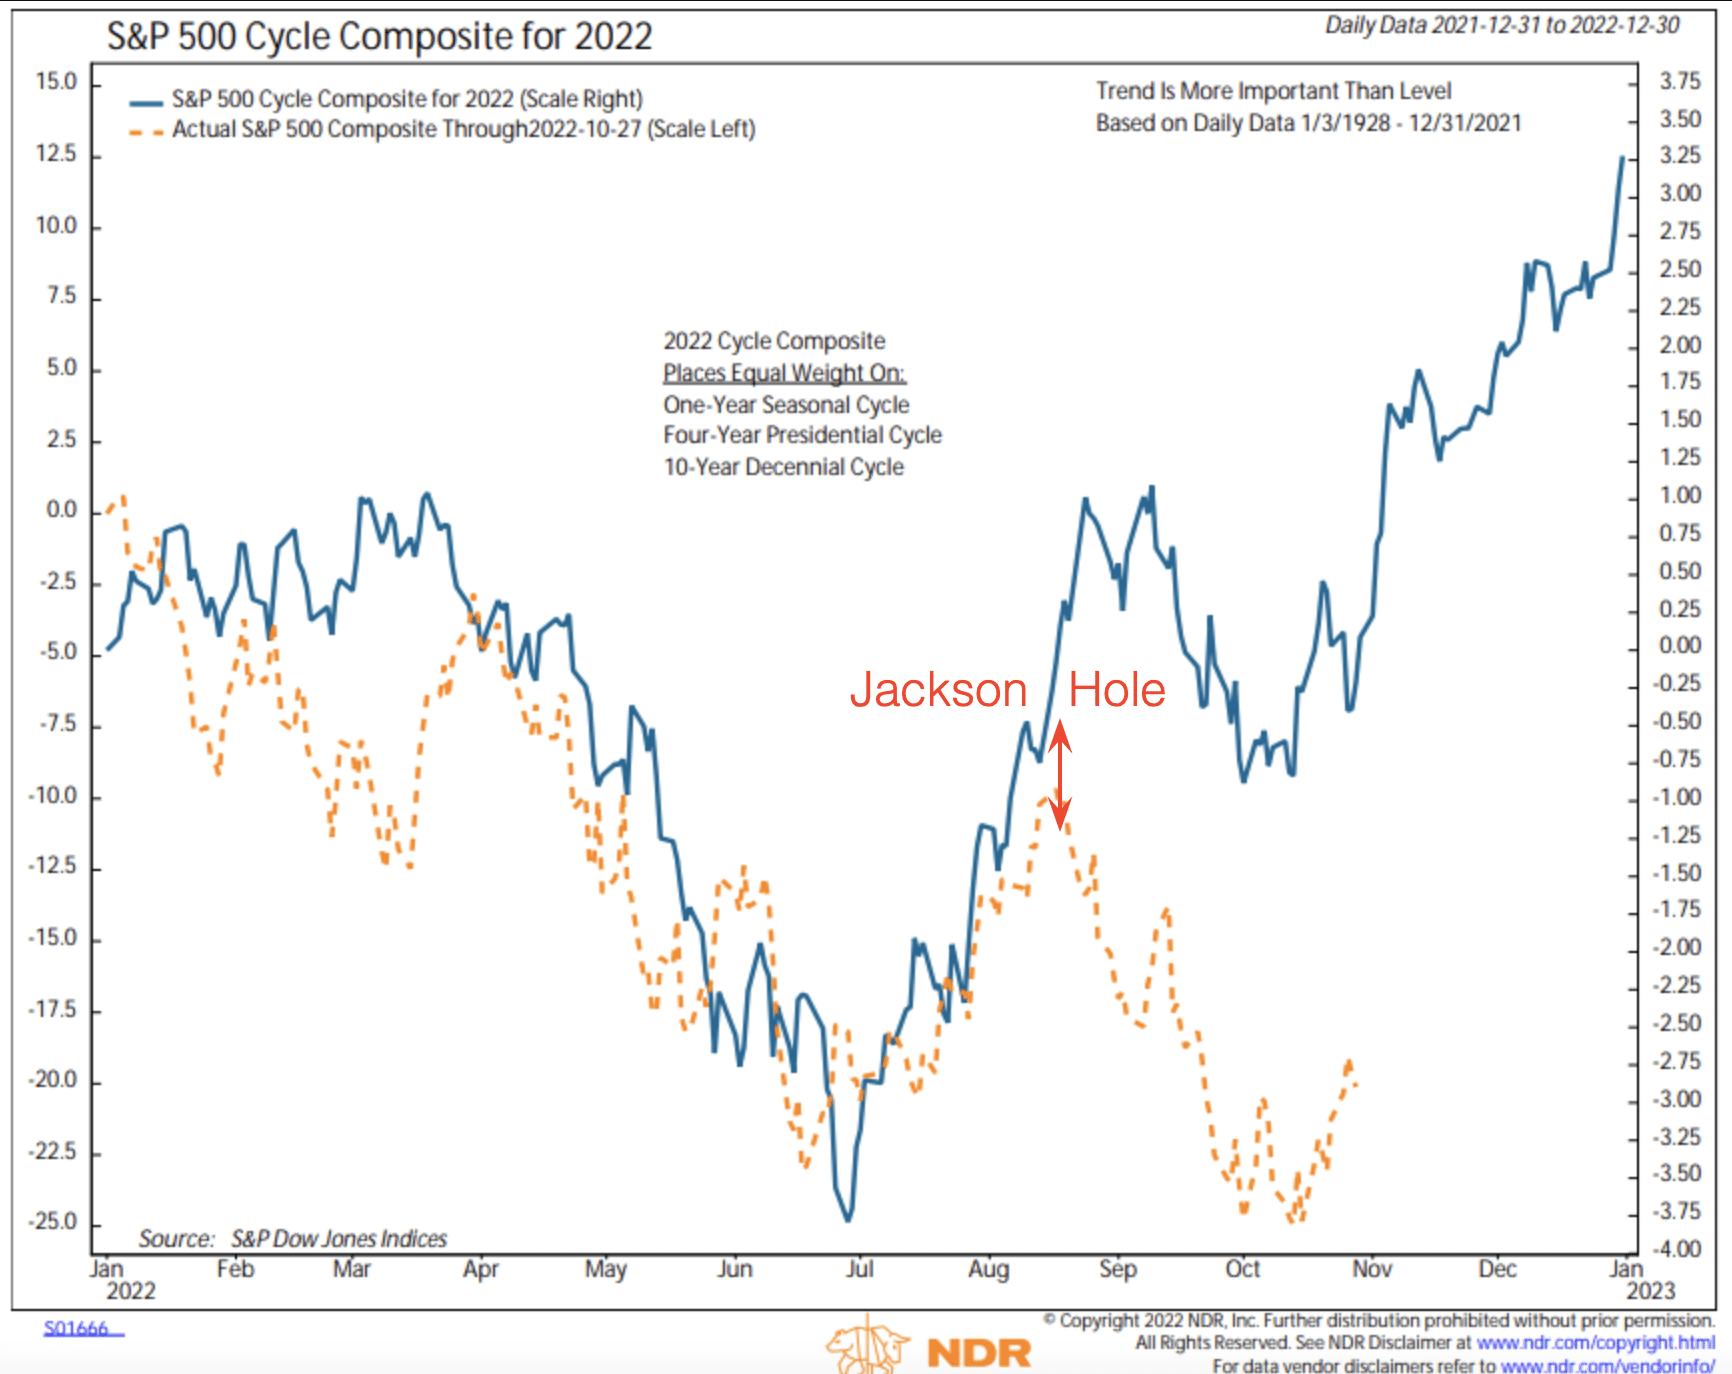
Since the beginning of the year, the S&P 500 had been tracking the Cycle Composite very well, with only a minor deviation in Q1 2022, which quickly got back on track in the second quarter. In Q3 2022, however, there proved a more severe deviation in price action post Jerome Powell’s speech at Jackson Hole. The chairman’s extremely “hawkish” rhetoric surrounding rate hikes proved to be an exogenous event for markets, and disrupted the analogue and algorithms. Essentially, markets were forced to re-price a higher terminal Fed Fund Rate (FFR) after the speech and before resuming the analogous price trend of the Cycle Composite index. As such, we can recognize that the pathway for price has, otherwise, been quite analogous to the Cycle Composite index in 2022.
Research Report Excerpt #3
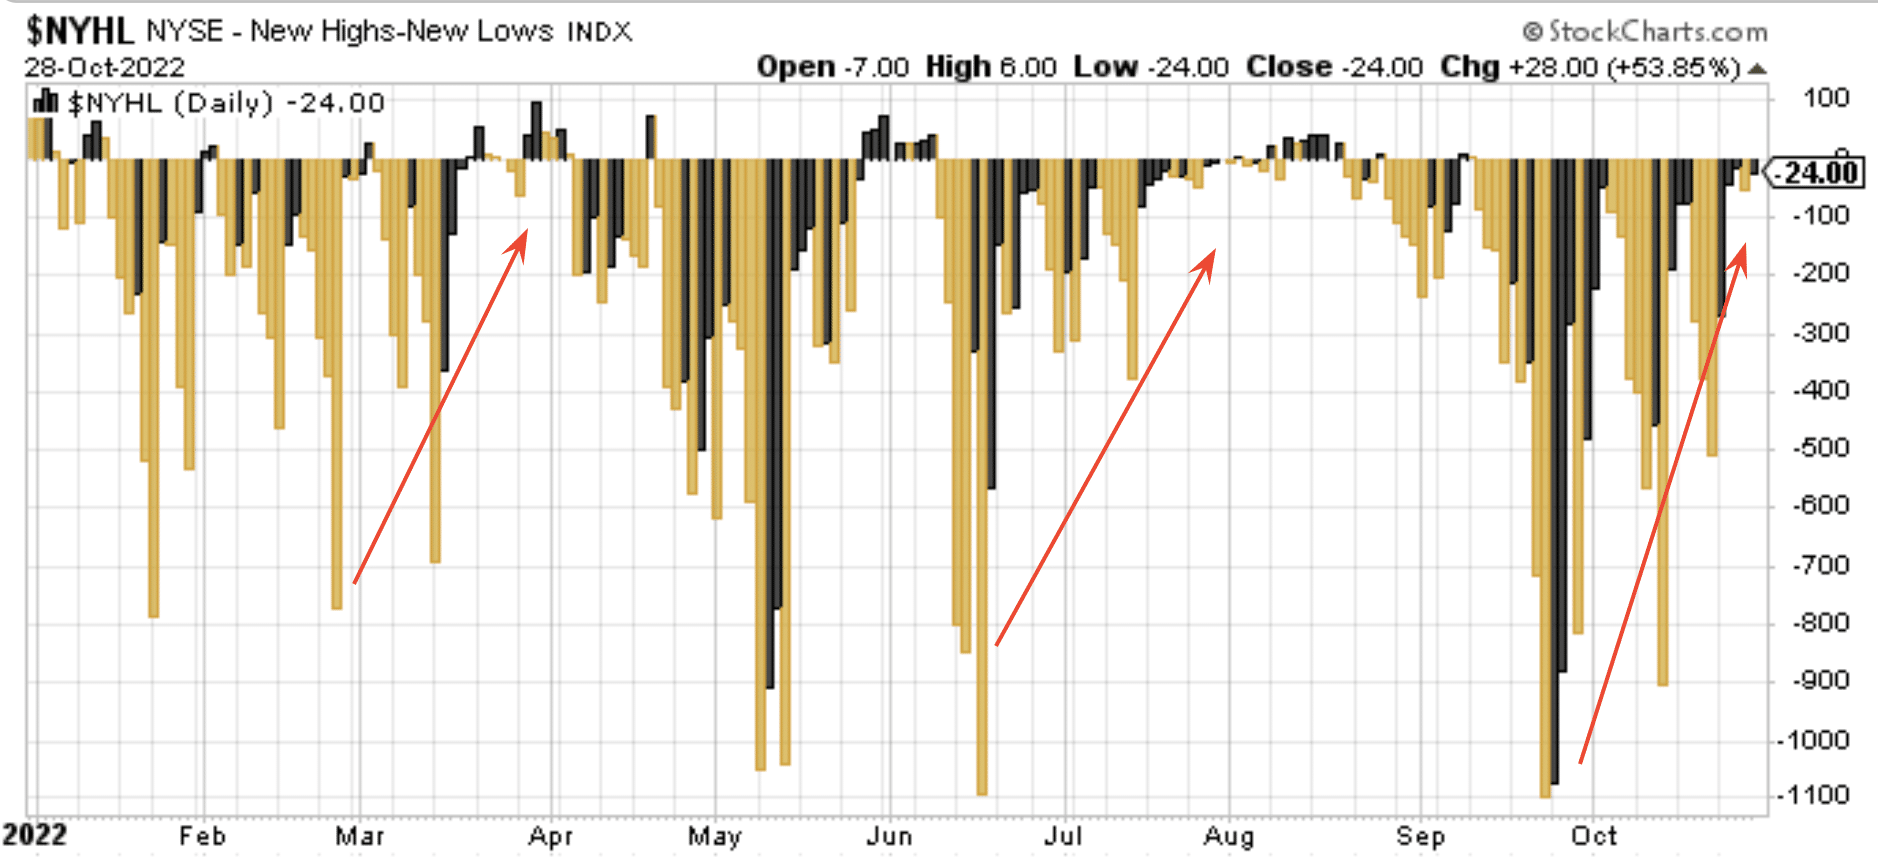
Don’t get me wrong, breadth has improved in some respects, alongside the bounce since the October 13 intraday lows, but the market needs more, and it demands continuation else it will prove a choppy environment into year-end. We need to see stocks making New 52-week highs in an increasing fashion, while the 52-week low achievements abate. That has been happening during the rally period under review, but we’ve yet to see Net New Highs outpace Net New Lows with any constancy. Day-after-day, the market is still producing more stocks making New Lows than New Highs. (Chart above) New Highs minus New Lows has greatly improved for all indices (NYSE above), but we’ve seen such improvements on distinct occasions this year falter, with indices producing lower-lows. Getting better does not equal good, and does not equate to a new bull market… yet!
Research Report Excerpt #4
When considering the potential feed through from PMIs (ISM or S&P Global) into S&P 500 earnings and the market’s performance, we understand the relationship to be nuanced. On theone hand, Finom Group is of the opinion that the market has largely already priced the PMI’s impact on the economy and, therefore, it has been reflected in the S&P 500’s peak to trough decline of 28%, in 2022.
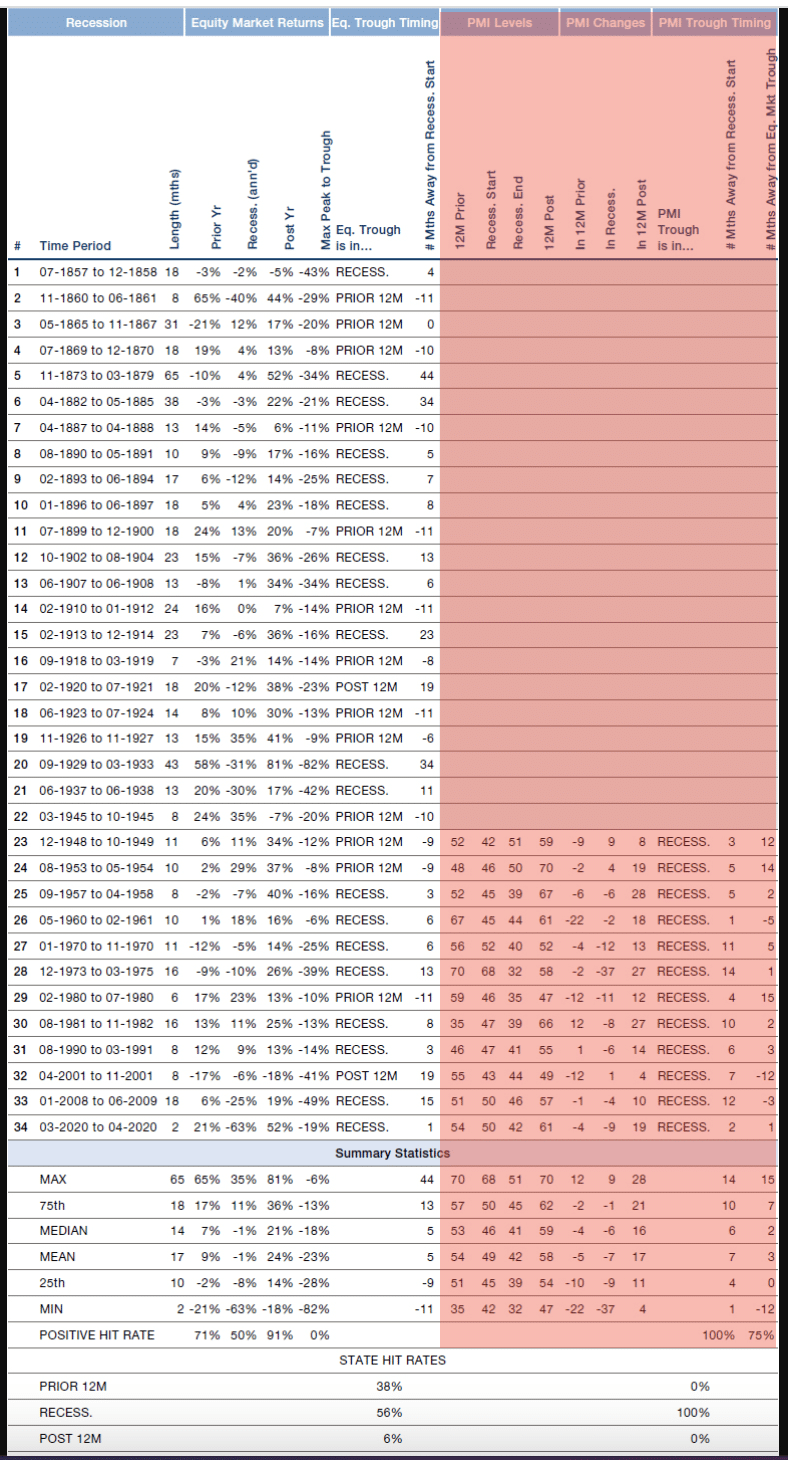
As the table from Man Group identifies, historically the market tends to bottom a few months ahead of the trough in the PMI. On the other hand, we simply can’t know that the PMI has trough or will trough in the coming months without the benefit of hindsight. In either case, what we can discern from the data is that PMIs are not a leading indicator for the market, but rather the market is a leading indicator for PMIs. The market is/has been pricing weakness in the future.
Research Report Excerpt #5
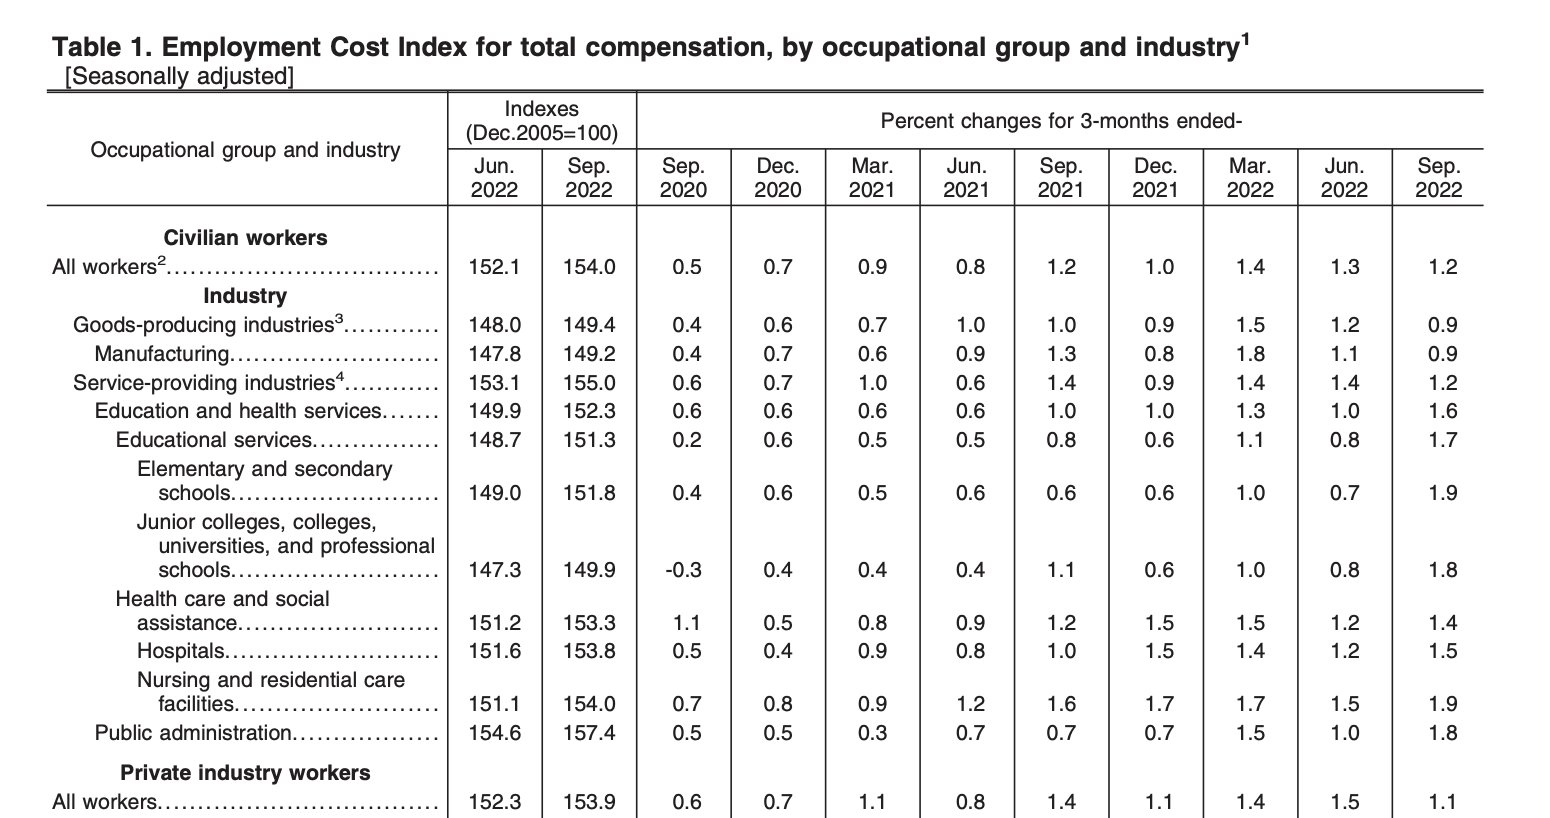
Within the PCE report is the Employment Cost Index. There is further evidence U.S. wage growth is slowing, based on the latest reporting. According to the Employment Cost Index, which tracks wages and benefits paid out by employers, total compensation for private industry workers rose 1.1% in the third quarter, down from 1.5% in Q2. Jerome Powell and the FOMC have been worried about the possibility of a wage-price spiral and were focusing on Friday’s Employment Cost Index release. The numbers should comfort them a bit, in line with expectations, and with quarterly private sector wage growth declining to 4.75% annualized.
Research Report Excerpt #6
You’ve often heard the financial media report that despite the elevated, accrued savings amongst households, many are living “paycheck-to-paycheck”. This simply isn’t true. Bank of America measured inflows and outflows from client accounts across all income brackets below and above $100k annually. What they found is that while the decline in 2022 (outflows) has surmised more outflows, the trend remains above 100%, which was the pre-pandemic level.

Is the economic situation perfect? Absolutely not. But when is it and what do you think the market has been pricing with a 28% peak-to-trough decline in 2022?
Research Report Excerpt #7
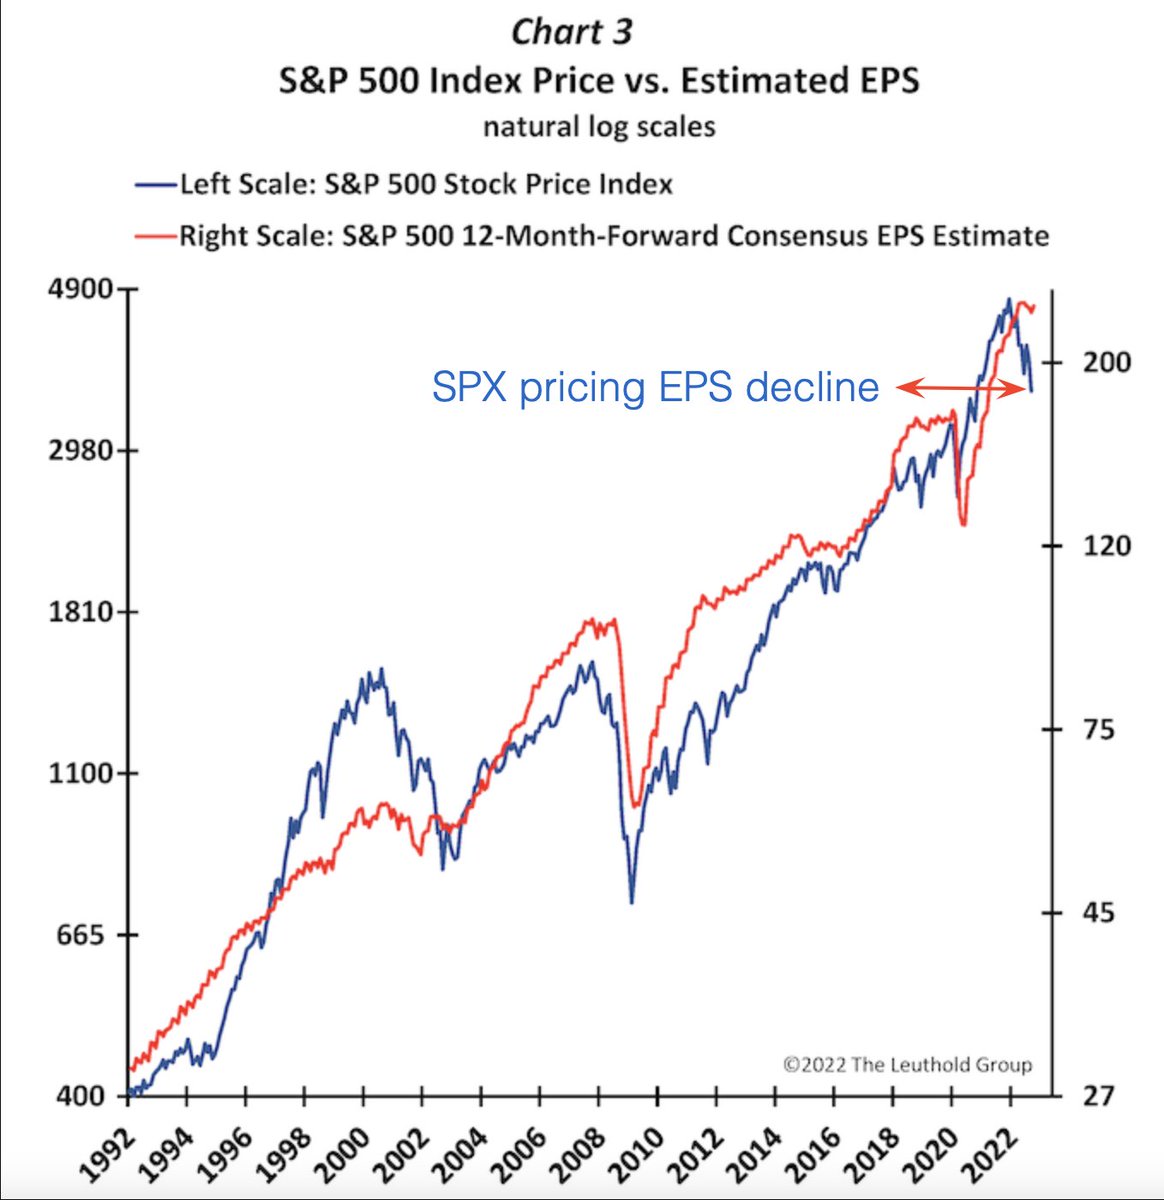
Next year’s EPS estimate is declining in-kind with the full-year 2022 EPS estimate. This year’s estimate has declined from $228 in the Q2 period to now $222.14, as indicated in the chart from Yardeni Research. Again, while this seems to foreshadow tougher times ahead for corporate earnings, the markets have largely priced in an earnings recession of sorts for 2023, even though moderate EPS growth is still the estimate.
Earnings growth is intrinsic to investing i.e. investors will wait for earnings growth, thus earnings declines haven’t been reasons to become a seller, historically. We’ve researched and found that the S&P 500 is up more often than not when earnings are down.
Research Report Excerpt #8
…“The ‘73-‘75 and ‘81-‘82 recessions were 2 of the three longest posts-war contractions and were reasonably deep in terms of real GDP, but but but, nominal GDP kept expanding and the earnings contractions were 13%. We’ve already priced that scenario.” ~Barry Knapp
And I know that we’ve talked about the recession from 1973-1975 in the past, and as it pertains to an earnings contraction/recession, have I not? As we review the table of S&P 500 Earnings History below, we recognize that the earnings recession occurred in 1975, but the S&P 500 had already priced in that earnings recession in 1974, with the S&P 500 falling some 29 percent in 1974. In 1975, when earnings were down, the S&P 500 rose sharply.

Furthermore, the S&P 500 delivered a -9% annual return in 1981 when EPS was growing, and a +15% return in 1982 when EPS was contracting.
Research Report Excerpt #9
Typically, this seasonal period even with the technical bear market proving technical damage to the indices, has given birth to strong returns over the next 12-24 month periods. Recall from this past week’s State of the Market what history suggests about an S&P 500 with a declining 40-week moving average, but a rising 200-week moving average, as follows:

- Bank of America Global Research: What about the current technical condition of the S&P 500 heading through midterm elections?
- Best part of Presidential Cycle begins in 4Q of midterm year.
- The S&P 500 enters the best part of the Presidential Cycle with a declining “cyclical” 40-week moving average and a rising “secular” 200-week moving average.
- With these parameters, the market has never delivered a negative return (7 of 7).
- Average return is 20%.
- Median return is 18.4%.


