
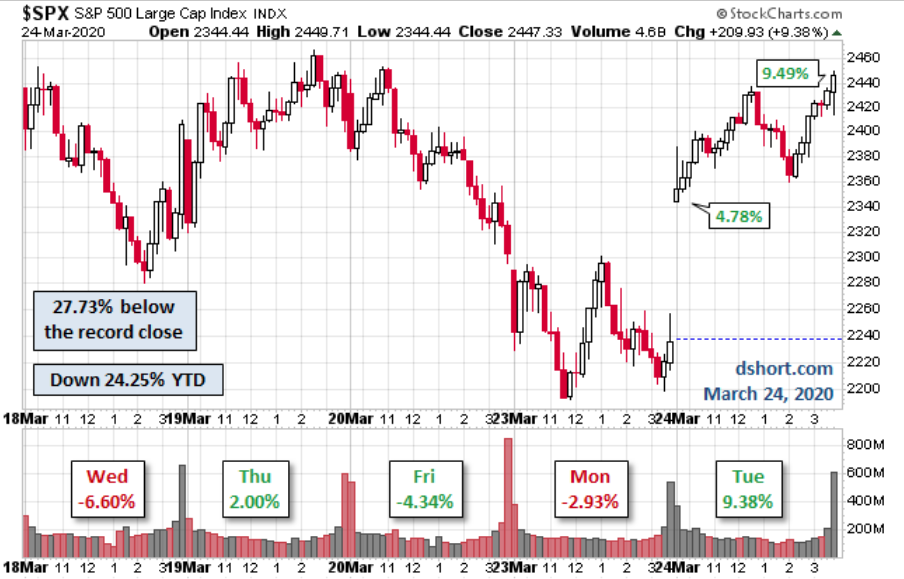
A “buy everything rally” ensued on Tuesday, which is known as “turn around Tuesday and which has held true of late. The past 3 Tuesdays the S&P 500 (SPX) has closed up 4.9%, 6.0%, and 9.4 percent. If you only invested on Tuesday, the S&P 500 is up 16.6% so far in 2020. Unfortunately, the other days of the week have been the biggest problem. Nonetheless, turn around Tuesday found the major averages up sharply, with the Dow Jones Industrial Average (DJIA) up 11.37% to lead the way and only followed slightly behind it by the S&P 500, up 9.38 percent.
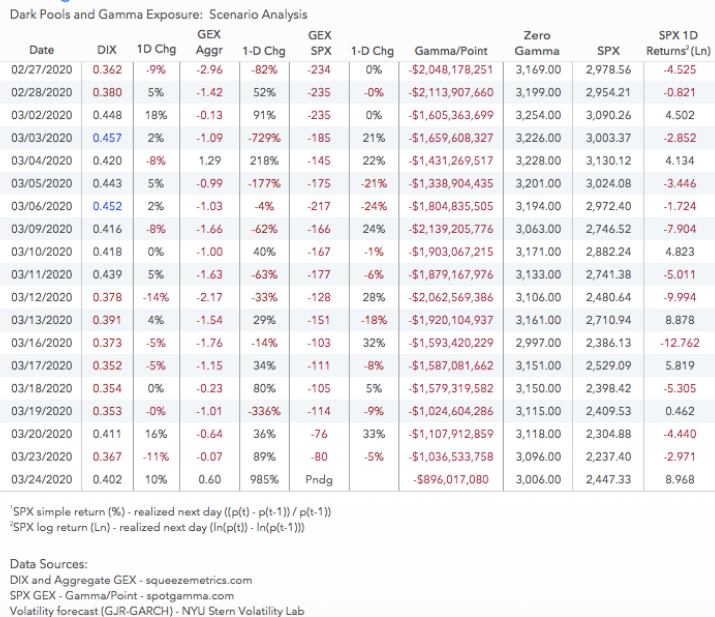
When you witness an 11% gain in a bear market rally, it should always make one skeptical and remaining cautious as such large 1-day moves are more mechanical in nature than a representation of a trend reversal. For what it is worth, only 6 prior bear market rallies expressed a greater than 8% 1-day move and none of those rallies marked a bottom in the bear market. Do remember that going forward. Of course, history is no guarantee of future market activity/returns, but it’s a good idea to know the probabilities based on the past. What likely happened on Tuesday and after the market lost 15% last week and another few percentage points on Monday was that dealers were caught overweight short options and they were forced to buy back futures as volatilities dropped. Quarter and month-end rebalancing next week likely to add to equity flows. The table below identifies the Gamma (GEX) fault lines/exposure for the month with still yet dealers largely short Gamma
Yesterday was largely a short covering rally that was combined with a large rebalancing effort from pension and hedge funds, commodity trading advisors (CTAs) and other institutional players.

What was also recognizable on Tuesday is that volume for the SPY was extremely light and some 90% of NYSE issues advanced on the day.
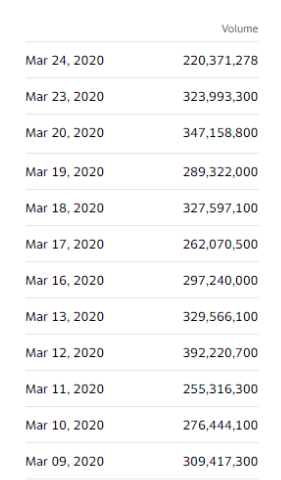
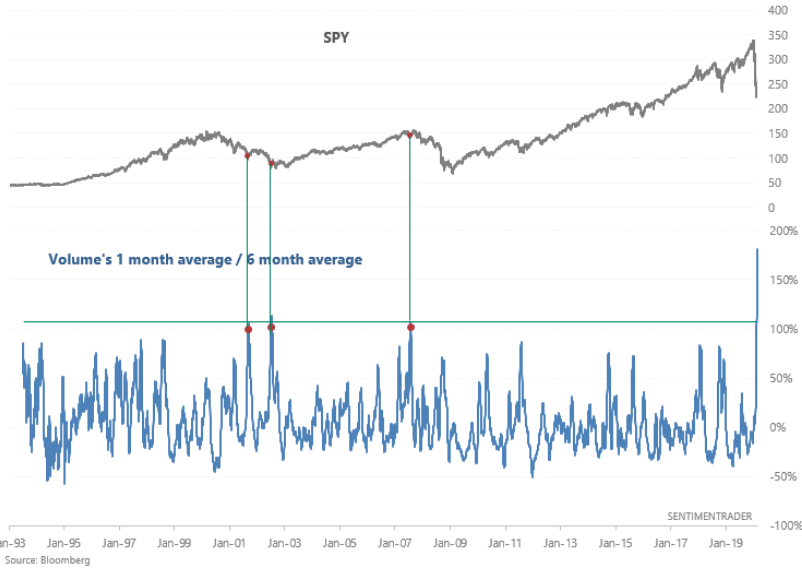
With respect to the light volume in the SPY on Tuesday, however, this should be expected as there is usually less volume on up days than down days. This is especially true of bear market conditions where the VIX is extremely elevated. Nonetheless, here is an interesting stat and chart from Sentiment Trader. SPY volume’s 1-month average is 180% greater than its 6-month average, shattering all prior records. Once again, we have another unprecedented market statistic and/or rolling occurrence. The only 3 remotely comparable cases were medium term bottoms in bear markets. Every bottom starts with a bounce, not every bounce is a bottom. The S&P 500 rallied +11%, +11%, and +8% over the next 2 months. the enormous volume speaks to the rapid and record setting decline in the major averages and index ETFs in 2020.
Alongside the low volume turn around Tuesday rally, another statistic surfaces. SPY has now remained under its 10-DMA for 23 consecutive trading days. The only other time over the past 20 years this has happened was July 2008, at 28 days.
With regards to the NYSE advancers: A 90% NYSE up day which is a positive sign should also be put into better context. As Walter Deemer notes, the 2011 case had several powerful 1-day rallies before the final low was made. 2011 was a textbook low and retest case; the retest low was a lower low akin to the 2008-2009 Great Financial Crisis where the initial low occurred in October 2008 but the final low didn’t occur until March 2009. Additionally and as identified in the chart below…
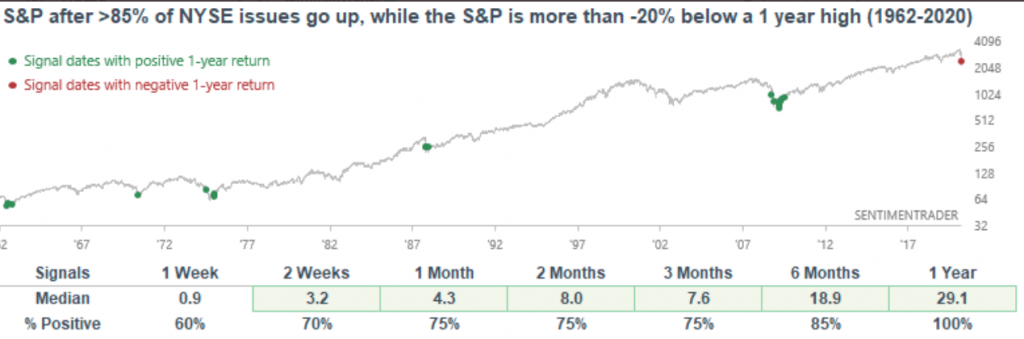
… when so many issues rallied while the S&P 500 was in a bear market in the past, the S&P 500 had a VERY STRONG tendency to rally over the next few weeks and months. Moreover, the benchmark index was UP 100% of the time over the next year by a median of +29 percent.
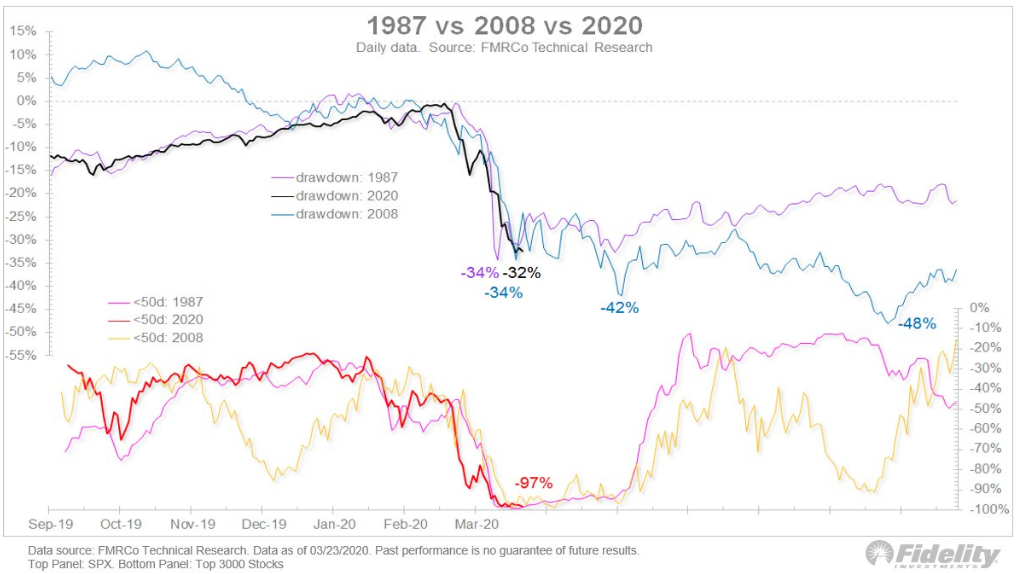
Tuesday’s positive market breadth still hasn’t found itself able to fully repair the technical and breadth damage that has taken place in the market over the last 6 weeks. Market breadth data are as bad as they have ever been, consistent with some of the worst bear markets on record. In the chart below, Fidelity compares today’s bear market breadth to the 1987 crash and the selling crescendo in October of 2008. At the bottom, the percentage of stocks below their 50-day moving average was atrocious.
While the relief rally from Tuesday appears to be extending, as anticipated, into Wednesday on positive fiscal stimulus headlines overnight, we remain cautiously optimist and patient investors. While Tuesday’s rally was a welcome sight, again, it didn’t express buyer discretion and a goodly portion was due to short covering and the overall mechanical operation of rebalancing. The other issue we identified with Tuesday’s rally was related to sentiment. No, not the typical Fear & Greed index sentiment reading or even the BofAML Bull & Bear sentiment gauge, but rather the VIX index and it’s kissing cousin, VVIX. Both VIX and VVIX rose on the day, even as the S&P 500 rallied greater than 9 percent. Here is what I offered in a tweet and as the markets rallied on Tuesday:
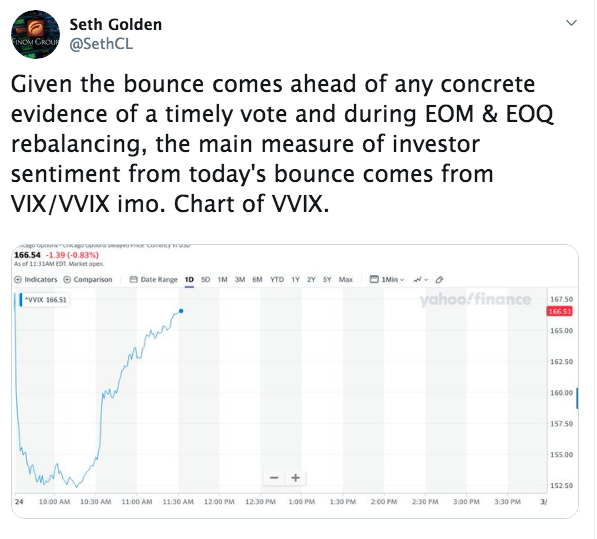
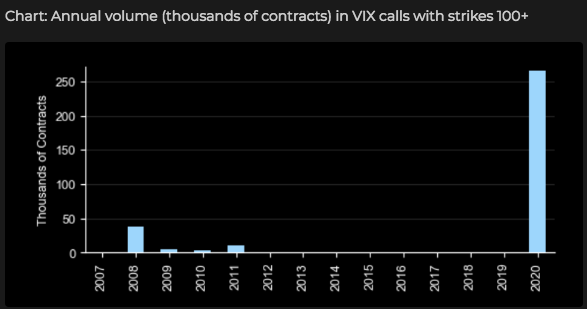
While we can somewhat dismiss the VIX and VVIX finishing positive on Tuesday, given the two volatility/hedging activity gauges outperformed the S&P 500 last Friday and Monday (to the downside), the VIX remaining at roughly 60% suggests daily moves at just under 4 percent. The market is still skeptical of the macro and earnings outlook, and it should be in our opinion. This is also finding another unprecedented elevation in VVIX over the last month.
More importantly to investors should be the constant due diligence and recognizing why the market is rallying and what the correlations are suggesting going forward. The back and forth in markets, sharp plunges followed by sharp rallies has left the market with elevated realized and implied volatility. This suggests that, at the very least, investors should remain cautious and not necessarily chase rallies, but rather use them for short-term trading potential and/or rebalancing portfolios. We’ve anticipated this week’s bounce, but will it hold and/or will it retest the bear market low established on Monday at some point in the near future? If it is anything like 2008, we should be open to the probability of a retest if not a new low altogether. And for you volatility traders (me too), if 2008 were to be used as a model and if it holds true for the present bear market, investors and traders should expect another spike in the VIX near-term.
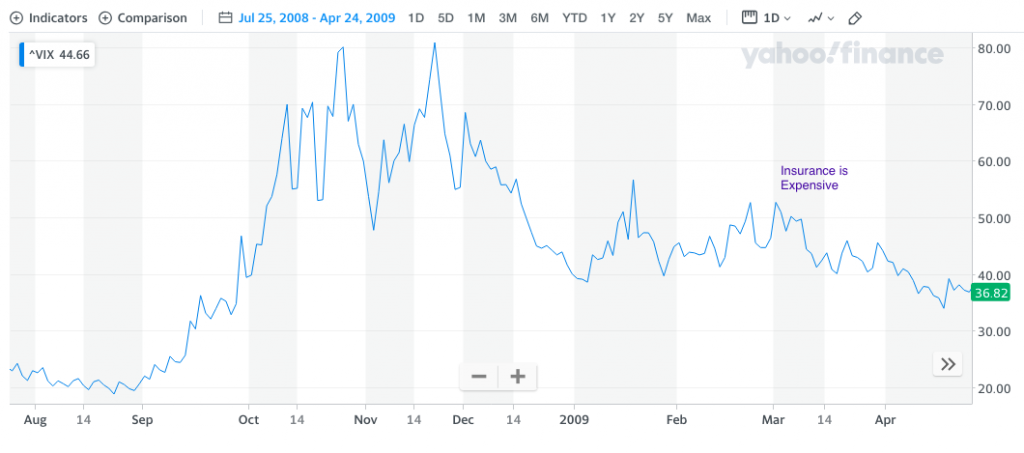
The chart of the VIX from late 2008-early 2009 identifies twin VIX spikes, a good month apart and sustained, elevated fear/hedging over a 2.5 month period. This sounds very much like the present period and begs of active fund managers to remain aware of the probability for another spike in volatility/VIX. If trading VIX-ETPs (Exchange Traded Products), here is a useful model related to TVIX from 2008, had it been tradable back then (IPO 2011). From Vance Harwood:
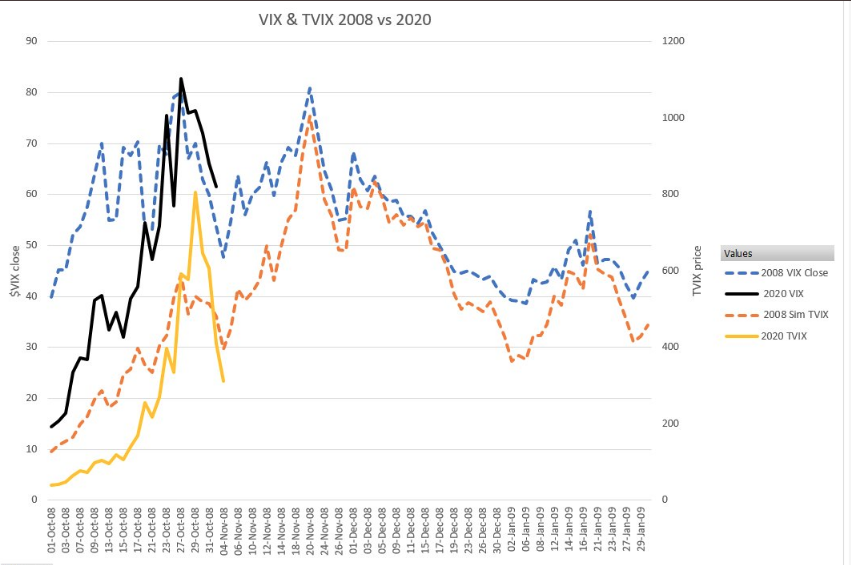
“VIX & TVIX 2008 vs 2020 continues to show similar pattern with fade after 1st spike. If it holds we will see another VIX peak ~April 10th. Dotted lines 2008, solid 2020. 2008 TVIX numbers were simulated from VIX futures & normalized to match TVIX 16-Mar-2020 actual.”
There’s a great deal to be aware of today and going forward as the unique set of bear market and potential recession conditions develop further. With that being said, what’s driving markets near-term is likely going to be a mix of speculation, policy action and how quickly COVID-19 infections slow and the curve flattens.

Jones Trading’s chief market strategist Michael O’Rourke, warns investors that “while it remains dangerous out there, from a liquidity perspective, it is getting dangerous to be negative on equities at these levels.”
He agrees and goes on to say that the 3 big catalysts driving the equity market in the near term are policy drivers,political, fiscal and monetary as he tells clients in a note.
On the political front, investors are getting mixed messages about whether saving human lives with a shutdown is worth the potential depression it might cause. But O’Rourke thinks that in a couple of weeks, everyone will have the grip of this “social distancing” thing. “At that point, the [virus] curve will at least be partially flattened, the nation will be two more weeks prepared, and a thoughtful path forward can be crafted.”
“The Democrats’ plan of putting more cash in the hand of consumers in an economy that is 70% consumer driven is preferred. That can be easily rationalized as a well deserved tax refund to match 2017’s Corporate tax cut that went to buy back shares.”
Then there is the Fed, which has now delivered unlimited quantitative easing and is buying everything but “high yield credit and equities. Nobody should be surprised if the next moment of panic leads to a special purpose vehicle to buy stocks and equity ETFs [exchange-traded funds],” O’Rourke said.
“While the long-term ramifications of these measures are dangerous, the short-term liquidity will be strong. If there was ever a time not to fight the Fed, this is it.”
As we continue to monitor “the trade” through the week, we recognize that we only have 5 trading days left in the month of March. It would appear as though the bulls are trying to close the month above the 2018 lows (roughly 2,346 on the SPX) and reclaim the bull market trendline (2,350) if possible and as shown in the chart below. If the bulls can succeed it could lead to a sizable tail on the monthly candle and raise the odds that we see a couple of weeks-to-months of sideways to up action in the U.S. indices and as many prove hopeful that the COVID-19 peak infection rate is only weeks away.

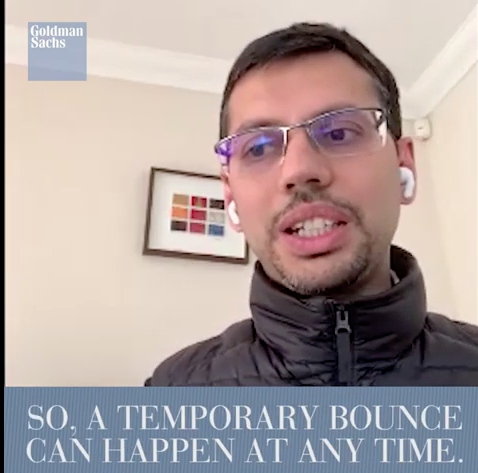
As noted earlier, a relief rally is a welcome sight to many investors, but we’re not out of the woods yet folks. There are still tail risks in the market that demand clarity and/or removal of uncertainty. Goldman Sachs identified some of the market tail risks that remain, but that are likely to be removed in the near future as follows:
GS: markets bottom when you can put limits on the tail risks
“To think about the conditions for a market trough, we need an explanation for what drives market recoveries in crises. The core insight is that while conditions are deteriorating rapidly, markets find it hard to be confident in the limits of the damage and so put heavy weight on deep negative tail risks. Inflection points are often, in the first instance, about the market being able to put limits on those tail risks even before true recovery is visible.”
- 1. A stabilization or flattening out of the infection rate curve in the US and Europe.
- 2. Visibility on the depth and duration of disruptions on the economy
- 3. Sufficiently large global stimulus.
- 4. A mitigation of funding and liquidity stresses
- 5. No intensification of other tail risk
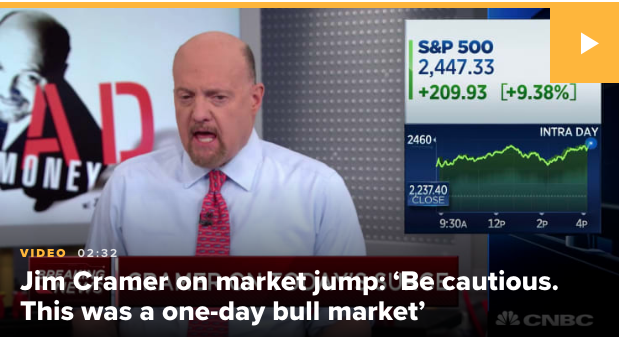
Sound thoughts from Goldman and do click the link to review their video articulations! And as it pertains to this bounce within a bear market, CNBC’s Jim Cramer weighed in Tuesday’s sharp rally with the following commentary that somewhat mirrors our sentiment at Finom Group.
“Just be cautious. This was a one-day bull market. You had stocks that moved so much they basically moved as if the second half of the year is going to be good. I struggle to find out why the second half of the year should be good.”
There were two times that were like this, 1933 and then the other time we were looking at 2008 when TARP was passed, and we know both times there was no demand. And that was the real problem. The market went up and there was demand for stocks, but there wasn’t demand for goods.
And I think that until we see demand for goods or see we actually have some secular growth stories … you realize that this was a gigantic short squeeze. That doesn’t mean we can’t continue, but there was a short squeeze today.
I hate this kind of rally. This was a machine driven rally, just like the sell-offs … I want to wait to see.”
It’s ok to recognize that Tuesday’s rally, which is showing some follow through in the equity futures Wednesday, may not be long for this world. That doesn’t necessarily make one bearish on the market; it makes them rational, informed investors. And that’s what we aim to be, rational and informed. We suggest following the headlines, but not to the extent that they shift your investor psychology from informed to worried. If you’re found overly concerned/worried, it’s probably time to turn of the television or divert your attention to something less destructive. Remember, the present day situation will pass and we shall overcome, that’s the premise of the United States of America, being an American, the U.S. economy and the markets. All will overcome in time and as such being overly concerned about the moment suggests moderating headline consumptions.
Moreover, the headlines of the day are found with improving sentiment. The White House and Senate leaders reached a deal early Wednesday on a massive $2 trillion coronavirus stimulus bill to combat the economic impact of the outbreak. The Senate has not yet released the final terms of the deal. An earlier draft of the bill seen Tuesday directed cash payments of up to $1,200 for individuals, $2,400 for married couples and $500 per child, reduced if an individual makes more than $75,000 or a couple makes more than $150,000.
The draft language also stipulated a $350 billion fund for small businesses to mitigate layoffs and support payroll.
McConnell said the bill would “stabilize key national industries” to prevent as many layoffs as possible. U.S. passenger and cargo airlines have sought a total of $58 billion in government relief, to help manage a financial blow they’ve said is worse than 9/11. The details of that aid was one of the last major outstanding issues Tuesday night.
Senate Majority Leader McConnell promised oversight on the loans the U.S. offers businesses, saying “every loan document will be made public very quickly” to make sure those loans are fair. He also said an inspector general and an oversight board would oversee those loans, after earlier criticism from Democrats that a proposed $500 billion fund for businesses left too much discretion to the Treasury.
The deal will allocate $150 billion to states and localities battling the pandemic, and starved of now-delayed tax revenue. McConnell said the Senate will vote and pass the legislation later Wednesday. From there, it will move to the House. And that’s where we could experience the next round of disappointment from markets. Stay tuned!
House Speaker Nancy Pelosi said Tuesday morning if the parties can compromise and have “unanimous consent” the bill can move quickly through the House.
“If we don’t have unanimous consent,” she cautioned, “my two options with my members is: we can call them back to vote to amend this bill, or to pass our own bill and then go to conference with that.”
Heading into Wednesday’s trading day, keep an eye on volatility gauges folks! Given the mechanics of end-of-month and end-of-quarter rebalancing, true equity sentiment is probably best defined in a bear market by volatility gauges in my opinion. Last but not least, let’s remind ourselves that indeed this is a bear market and it is to be no less respected than we respect a bull market and trends in place. With that said, here are some offered statistics and noteworthy points of interest regarding bear markets from Alex Barrow. Keep in mind, unprecedented! And as such, past performance may not prove a guarantee of future market performance, hence all the record setting moves over the years and in the present market conditions/moves.
- Odds strongly suggests that we’re in the early innings of a cyclical bear market which will be accompanied by a recession starting within the next quarter.
- Bear markets last an average of 18-months and a second major low (double bottom/complex double bottom) is usually put in 12-months after the first major low.
- The most explosive short-term bull rallies occur in bear markets, as crowded shorts are forced to cover as eager bulls buy thinking the bottom is in.
- Newton’s First Law reigns supreme as momentum begets momentum and sideways chop begets sideways chop. This is fractal and true across all timeframes.
- Bear markets tend to spend more time trading sideways to up than they do going down as the selloffs occur much faster than the up/ranging action.


