

Research Report Excerpt #1

“Assuming, assuming one could be that best market timer in the world, the difference between that amount of work and simply buying the index ETF and holding it through ups and downs is a meager 1 percent. That’s it, that’s all one achieves above the Buy and Hold strategy. In other words, while it proves emotionally taxing to accept that drawdowns are the price one pays for long-term profits, it’s still the better approach to investing.”
Research Report Excerpt #2
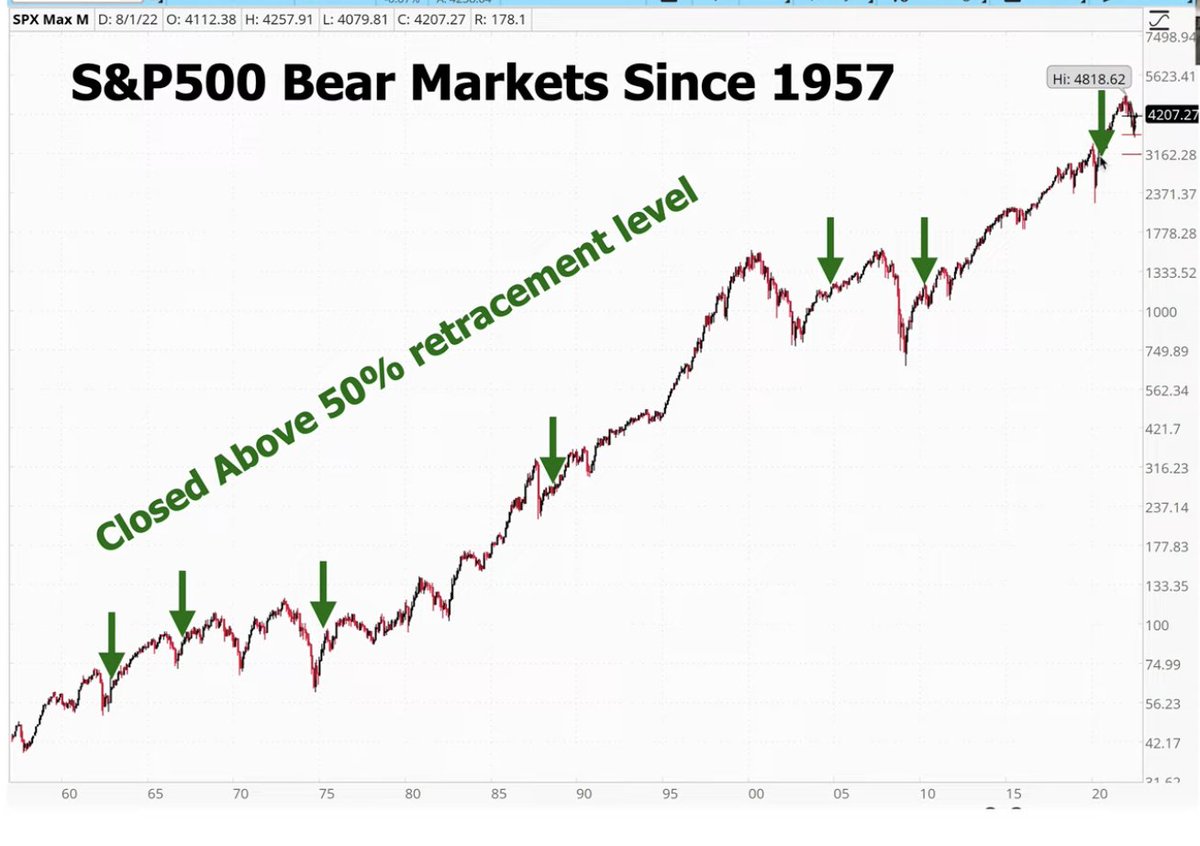
I can’t speak for all market particpants, but what I would offer is that if the same low price is revisited after a 50% or greater bounce fails, a retest has occurred. As such, we know that based on this unique occurrence, we now have 2 historical studies that have deviated from their historical performance trend. Again, we assess and profess that such occurrences validate a breakdown, which may prove a byproduct of the Fed’s monetary policy path.
Research Report Excerpt #3
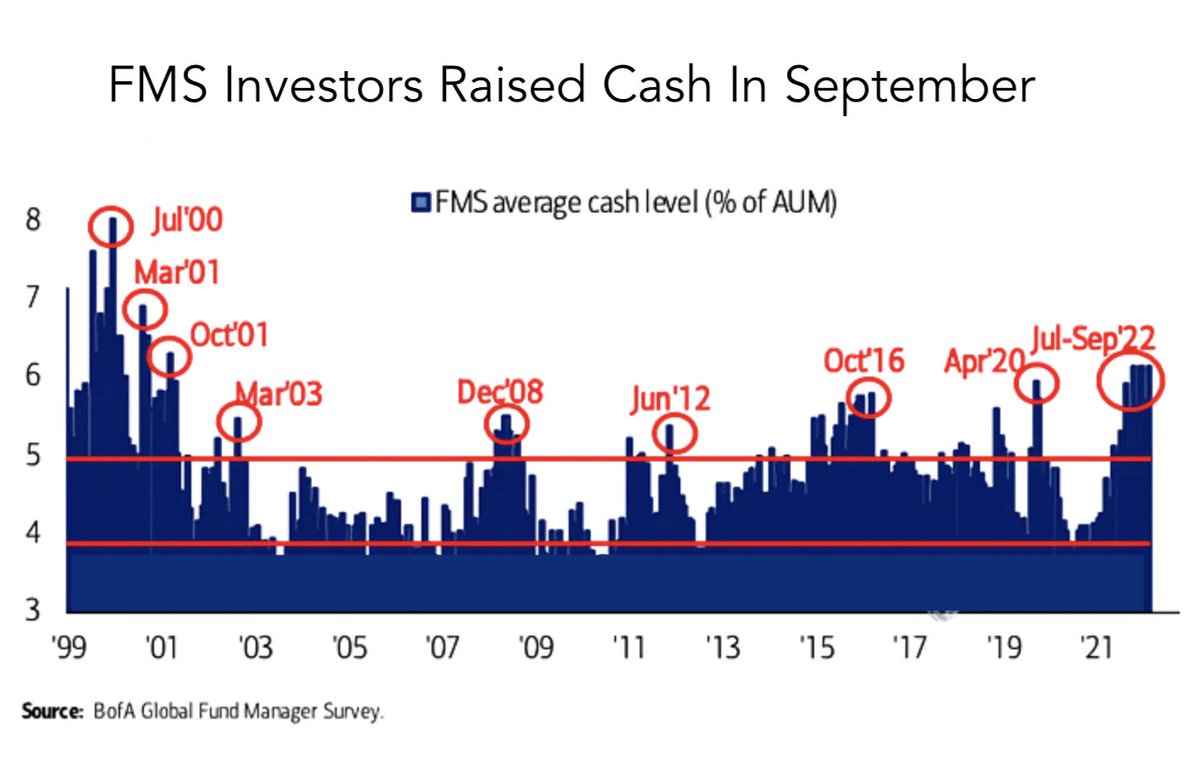
Bank of America’s (BofA) widely watched global fund manager survey showed broad bearishness in September. The latest reading indicated the majority of respondents are underweight equities for the first time on record. Now, records start in 2002, so it isn’t an especially long history, but it does include 2007 – 2009’s bear market (typically a prolonged and fundamentally driven decline exceeding -20%) and early-2020’s brief downturn for comparison. Similarly, 62% of managers are overweight cash—a reading that has never been above 60% in two decades.
Research Report Excerpt #4
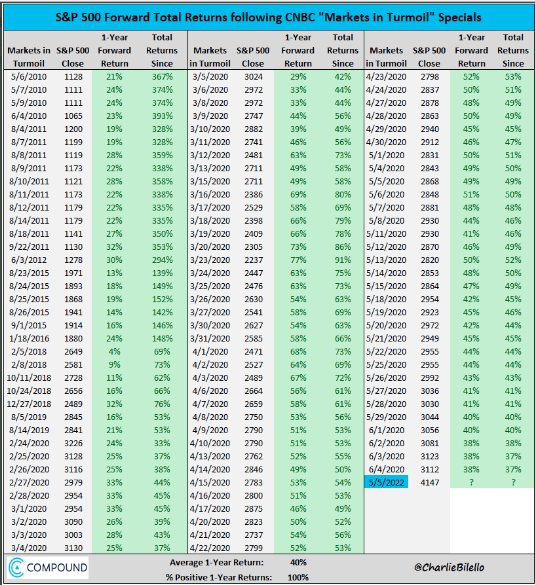
Sentiment data can prove rather in-actionable and impractical for investors. In other words, it generally has less utility in the interim, but greater price predictive qualities long-term Consider the CNBC Markets In Turmoil special programs that tend to air when… well, when markets are in turmoil. Historically, a year after such a CNBC special, the S&P 500 has always been positive. The average return is a remarkable 40% also. The S&P 500 closed at 4,147 on May 5, 2022, the first such Markets In Turmoil program of 2022. Mark your calendar folks!
Research Report Excerpt #5
Unlike the S&P 500, the Nasdaq Composite and the NYSE did close just below their 200-weekly moving average this past week. The NYSE has actually done this a few more times than its peer indices. Nonetheless, this is why investors should still be planning for additional downside, but utilize oversold bounces to take profits on buy-the-dip trades.

Research Report Excerpt #6
The table below from Oppenhiemer’s Ari Wald serves as a market bottom checklist. Again, these are bottoming conditions, but it doesn’t suggest the market bottoms and only goes higher from here.

Research Report Excerpt #7
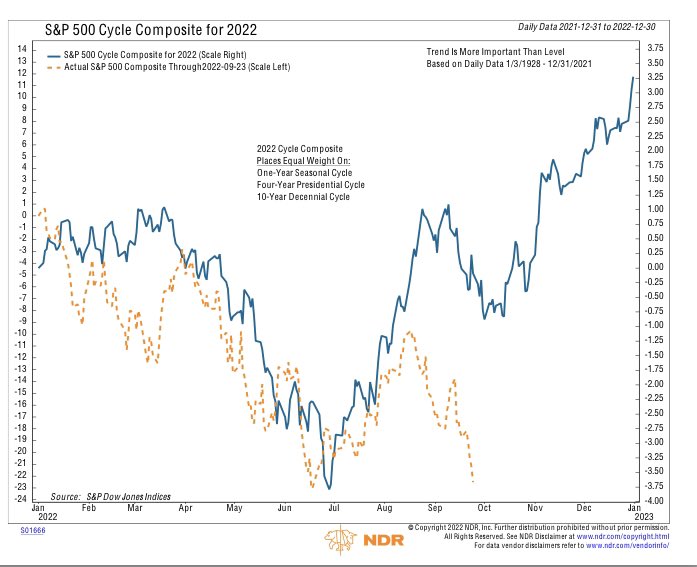
And while many other historical studies have broken down over the last month or so, the NDR Cycle Composite is still very much intact for 2022. Again, the updated tracking for 2022 is almost perfectly aligned with the Cycle Composite. The 2022 (yellow trend line) is tracking perfectly to the Cycle Composite (blue trend line). If the pattern holds, it suggests a potential short squeeze into year-end is a reasonable outlook, but with the next couple of weeks (including the first week of October) proving trecherious.
Research Report Excerpt #8
“With all of that being said, let me offer my perspective on the latest message from Jackson Hole and the FOMC in the following points”:
- The message from Jackson Hole was not new, but absent the typical question and answer format that allows the Chairman to placate to the dovish desires of market participants.
- The Fed had previously removed the element of “forward guidance” in favor of elevating “data-dependency”. In doing so, policy is not set in stone and open to react in more real-time than during non-inflationary regimes.
- The Fed desires a flexible approach to handling inflation and a looser labor market. By removing guidance and remaining data-dependent, markets may prove more volatile to incoming data, but the Fed is able to expidite policy implementation as needed, and as they have already managed with “abnormally large” rate hikes.
- The majority of voting, regional Fed Presidents hold an average Fed Fund Rate target of 3.75%, with low-end target projections of 3.5% and high-end target projections of 4.5%. The target rate, like the overall Fed policy initiatives themselvs are not set in stone, but open to revisions and moderation.
- The Fed likely desires to get the Fed Fund Rate to the target objective sooner rather than later. If the Fed achieves the target rate by year-end, they will also likely have sufficent data informing of the impact of rate hikes and monetary policy. Whatever trend data they still require, and with the target rate achieved, a pause in rate hikes is a high probability as the Fed would also desire more time to achieve even more data to inform of the efficacy of its policy innitiatives and implementations, else more policy innitiatives may be require at some point in 2023.
- Owner’s Equivelent Rent is likely coming down already, but the lagged reporting effects due to how the data is gathered set’s up a scenario of assumed over-tightening, but with FOMC recognizing the lagged reporting through future policy messaging. The OER imput is likely to hit core inflation data in December 2022 – January 2023, where the inflation data rate-of-change likely accelerates, setting up the typical Year 3 of a 4- year Presidential cyclical outlook.
- While policy innitiatives have historically worked with a great lag, they have worked into and through the economy and markets more quickly in recent business cycles (2003-current). The Fed is keenly aware of this fact, and has already witnessed policy impact in the housing sector since Q2 of 2022.
- The Fed Fund Rate target is a calcuated range for which policy would hope to restrict economic activity enough to temper the inflation rate, but not so much that it would also form an economic recession. A recession would define policy error, and force the Fed to maintain an extremely large balance sheet. As such, when Fed officials message the Fed Fund Target rate is likely to remain elevated, that message and/or outlook is not set in stone, it is likely to moderate alonside the incoming economic data.
- All aspects of the Fed’s monetary policy are open to revisions.


Research Report Excerpt #9
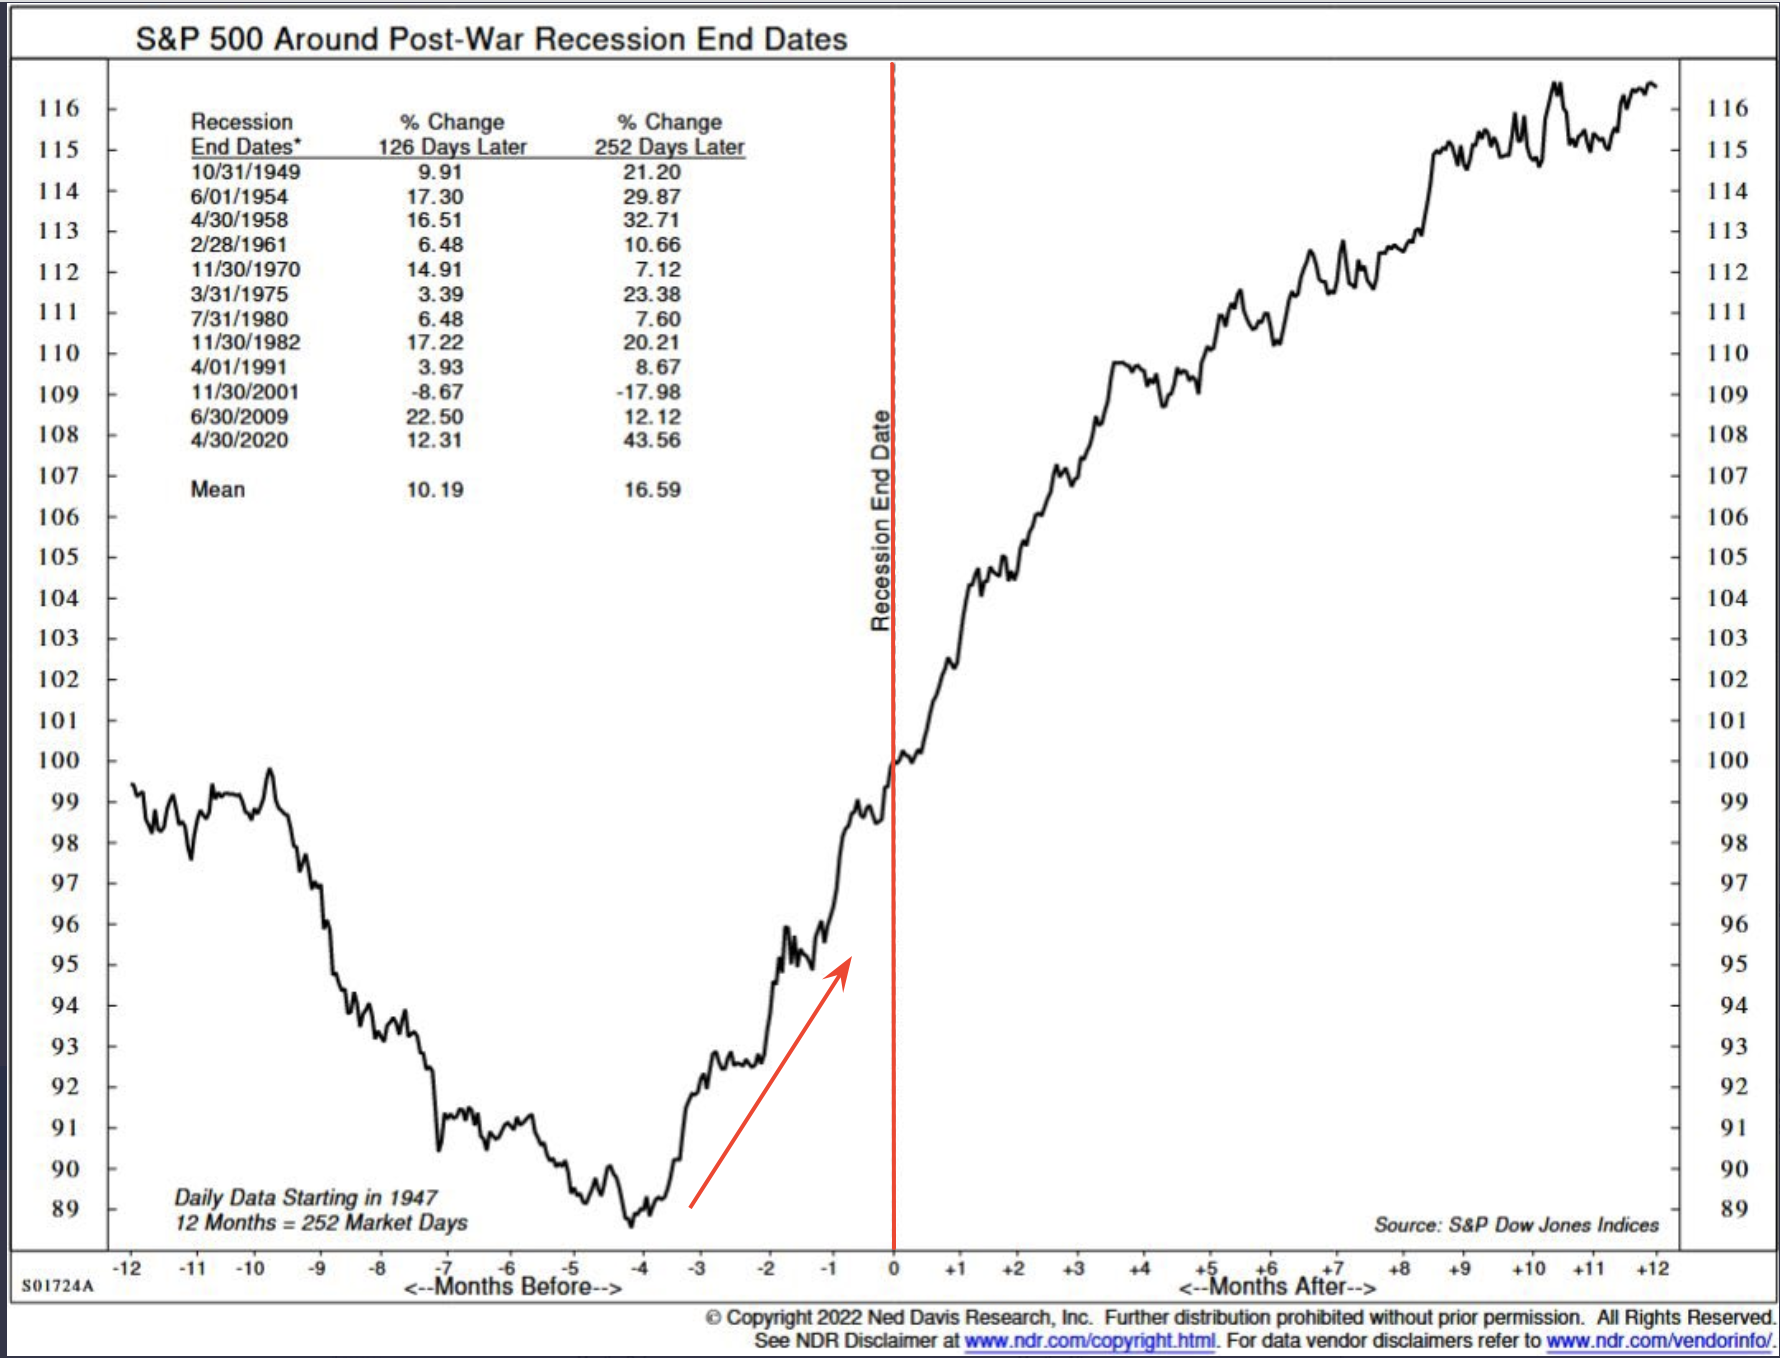
As we can see in the chart above, the S&P 500 typically bottoms 4 months (X-axis) ahead of the recession end date also (vertical line in red). By waiting until the recession has been declared over, the average investor is missing out on a roughly 25% rebound in price from the lows, which defines the OPPORTUNITY COST. The most common push back favoring “waiting for clarity” and/or stronger economy is fear of a steeper market decline, and therefore steeper portfolio drawdowns. Keep in mind that “waiting for anything” is code for “market timing”. So let’s think about waiting for and/or market timing more logically: “I’m gaining a lesser drawdown.” Talk about your condradictions in both terminology and rationale. I think that just about summarizes the logic  many force themselves to believe by trying to time the market while increasing their opportunity cost/s. “I’m gaining a lesser drawdown.” You can’t save everyone, row your own boat folks!


