
Welcome to another trading week!! In appreciation of all of our Basic Membership level participants and daily readers of finomgroup.com content, we offer the following excerpts from our Weekly Research Report. Our weekly Report is extremely detailed and has proven to help guide investors and traders during all types of market conditions with thoughtful insights and analysis, graphs, studies, and historical data/analogues. We encourage our readers to upgrade to our Contributor Membership level to receive our Weekly Research Report and State of the Market Videos and take advantage of this ongoing promotional event today! Have a great trading week, be in touch, and take a look at some of the materials in this weekend’s published Research Report!
Research Report Excerpts #1
One might expect the XLC to remain relatively strong when compared to other sectors and the overall S&P 500 given it’s heavily weighted to tech and media titans. Below are the holdings and weightings within the XLC:
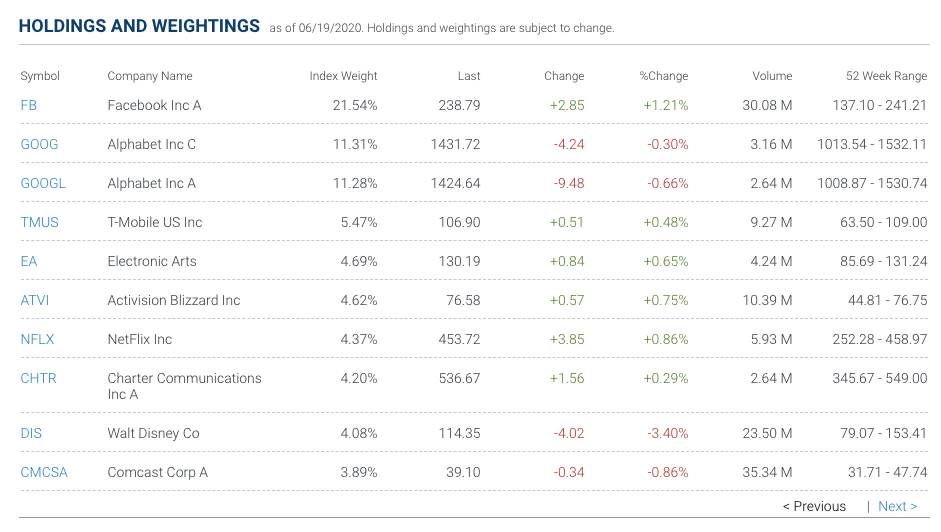
While the S&P 500 is down more than 4% year-to-date, the XLC is up 3.56% year-to-date. Some of the top holdings within the Communication Services sector ETF include Netflix (NFLX), Alphabet (GOOGL) and Facebook (FB). In the event of a further market consolidation, if these particular stocks prove too rich for your portfolio, the XLC is a strong candidate for which to capture the upside potential in those names.
Research Report Excerpts #2
The number of advancing stocks vs. declining stocks for each of the index and sub-index levels can tell us something more about market breadth as well. From the top panel on down, the charts outline the NYSE A/D and S&P 500 large-small cap A/D performance.
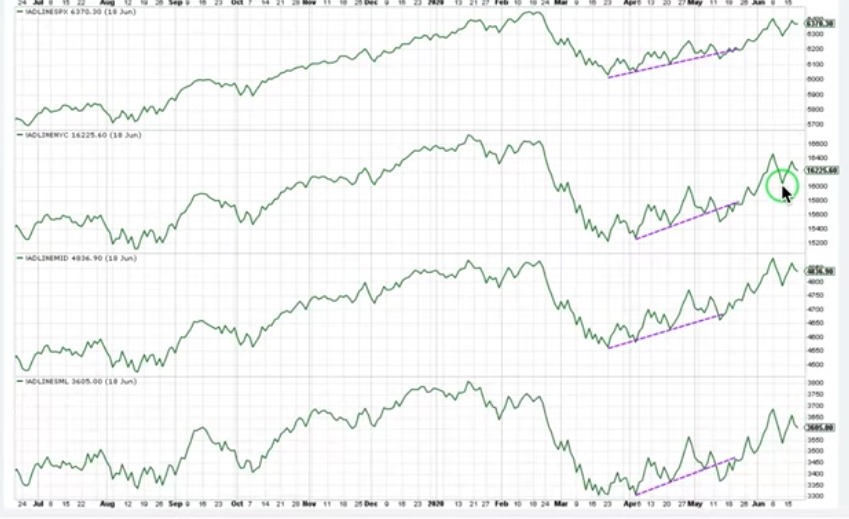
Unfortunately, this past trading week we also saw lower highs in each of the cumulative A/D measurements. That’s not necessarily a bearish indicator, however, as you can see the same thing happened in the more recent past. We could just as easily rip back to the upside this coming week and form a higher high as we did at the end of May. What might prove more near-term bearish is if we do indeed break beneath last Thursday’s low (circled in chart). Should that happen, we may see additional risk-off market sentiment and fill the open gap/s.
Research Report Excerpts #3
The market will likely take its lead from fundamentals and/or headlines. The headlines are somewhat disconcerting presently, but as noted previously, in keeping with my long standing expectations about the reopening of the economy and rising COVID-19 cases. The chart below validates the expectations when compared to the Spanish Flue of 2018-2020:
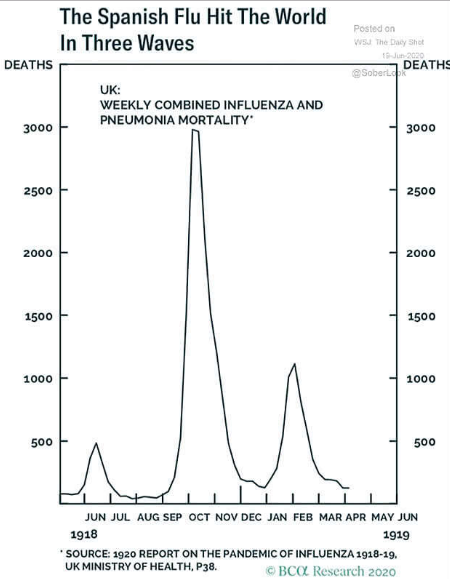
All pandemics have this head-and-shoulders pattern formation. They have a left shoulder which is known as the “hey I’m coming (minor spike)”, the head known as the, “I’m hear and I’m catching fire (head)”, and the right shoulder known as the, “Can’t quite get as big as the head but a bit bigger than the lefty over there (right shoulder)”.
Research Report Excerpts #4
Most Wall Street economists remain of the opinion that more will be done on the fiscal policy front heading into the election and likely with a Cares Act 2.0 to pass legislature in July, ahead of the expiring unemployment insurance benefits.
Morgan Stanley update on where we are on Fiscal Stimulus:
- CARES Act: In March, the first round of the CARES Act was passed allocating $300B for recovery rebates. This helped spending in April where our data suggests 25-35c on the dollar was spent while the rest was saved or used to pay down debt. This story is pretty much complete with $35m left to trickle out.
- Unemployment benefits: This is key to spending right now. The average unemployed person is making 130% of their normal wage ($600/week) with benefits set to expire in July and 32m people unemployed.
- What happens next? Ellen Zentner + Robert Rosener (US Economists) believe the government will phase this out with support from Democrats but Republicans want to take it away altogether. Republicans want to incentivize people to get back into the workforce by giving people a bonus once they land a job (~$450/week per marketwatch). This would help bring down the # of unemployed where we think getting to 10% from 19% (underlying) is the easy part; getting to 6% by the end of 2021 will be the tough part.
- CARES Act 2: If this passes, it’s a good consumer story. We think something could get done this month ahead of unemployment benefits expiring. This would be the last fiscal stimulus until the election in 2H. Our base is $700B to $1.1 trillion gets distributed to consumers in the form of PPP extensions, unemployment insurance, and additional aid to hospitals / health systems. Both Democrats and Republicans have acknowledged the importance of this funding, in particular Republican Sens. Mitt Romney (Utah), Susan Collins (Maine), Bill Cassidy (La.), John Kennedy (La.), Lisa Murkowski (Alaska), Dan Sullivan (Alaska) and Shelley Moore Capito (W.Va.). See chart below on the different buckets stimulus would impact.
- A Trump aide told CNBC this week “The odds of there being a phase four deal are really close to 100%,” Hassett said even after jobs data for May far exceeded expectations.
Research Report Excerpts #5
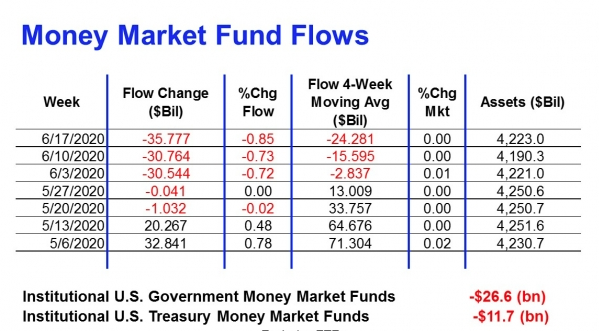
There is now nearly $5 trillion in money market funds, almost twice the levels we saw this time only five years ago. Also, the past three months saw the largest three-month change ever, as investors ran to the safety of cash. If you were looking for a reason stocks could continue to go higher over the longer term, there really is a lot of cash on the sidelines right now.

Research Report Excerpts #6
Furthermore, Bank of America’s CIO Michael Hartnett says shorting the market now is the equivalent of fighting the Fed.
“Fed is “all-in” and will remain in that stance until US unemployment rate falls to acceptable level i.e. <5% (or claims <400k).”
Hartnett also warns that Fed rhetoric has been bigger than its wallet thus far, which means Powell can easily crush shorts just by threatening more easing/liquidity measures from within its tool bag of easing measures. Here’s why: The Fed’s facilities are operating at just a fraction of potential, and as Table 1 below shows, the Fed has spent just $173bn out of its potential $495bn in firepower (and it can always add more).

Research Report Excerpts #7
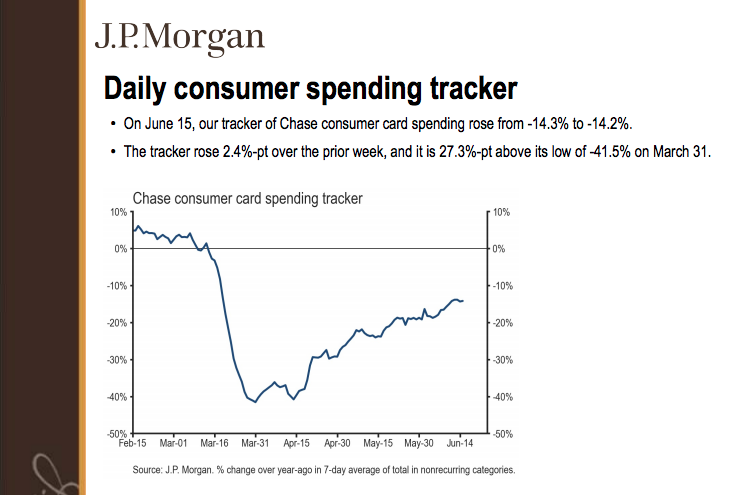
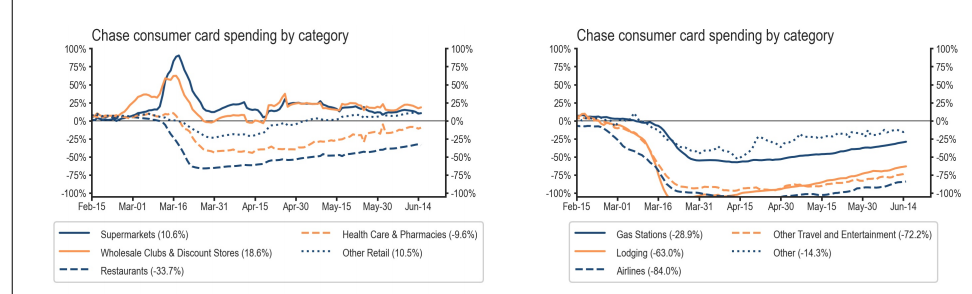
J.P. Morgan’s consumer spending tracking data has been steadily climbing over the last couple of months:
Thank you for joining us for another trading week and reviewing our weekly “Must Knows”! To receive and review our weekly full-scale Research Report each Sunday and our State of the Markets weekly video analysis every Thursday, subscribe to our Contributor Membership level at just $7.99 monthly! With these two weekly deliveries, you’ll have all the unbiased and fact-driven market and economic data analysis at your fingertips. Don’t make capital allocation decisions based on headlines that brush the surface of what is and isn’t affecting markets. Let our deep-dive analytics supply you with bottom-up and top-down analytics. You won’t be disappointed. Upgrade today!!


