
It was a mixed bag of index performances on Wall Street Wednesday. And for a change, the political or above board macro nonsense didn’t seem to impact the major averages as much as presumed. While headlines from the DOJ investigation into Big Tech companies swirled and Facebook settled with the SEC investigation for a $5bn fine, earnings maintained a high degree of investor focus and trading activity. For this reason, the Dow Jones Industrial Average (DJIA) proved the laggard of the day while the Nasdaq (NDX) proved to outperform once again.
Caterpillar Inc. (CAT) on Wednesday reported lower quarterly earnings, hurt by cooling demand for construction machines in Asia-Pacific as well as weak sales at its energy and transportation division.
In the second quarter, Caterpillar reported an adjusted profit of $2.83 per share compared with $2.97 per share a year ago. Analysts surveyed by Refinitiv, on average, expected earnings of $3.12 per share. The company also lowered full-year earnings guidance to be at the lower end of previous range of $12.06 to $13.06, short of the estimate of $12.24 per share.
“The worse-than-expected results are partially due to the increase in manufacturing costs, which came from “higher material costs, including tariffs, variable labor and burden and warranty expense,” the company said.”
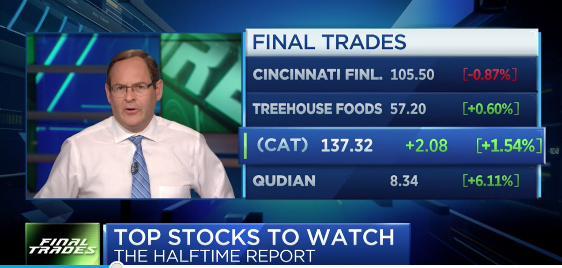
On Tuesday’s CNBC Fast Money show, one of the co-hosts and traders suggested that expectations were low for Caterpillar and if the company were to RAISE guidance by a nickel, the market would rally. So much for that suggestion.
What else happened on Wednesday? Well, interestingly enough, something that I pointed out in a tweet was picked up by MarketWatch; here’s the tweet I offered on Monday:
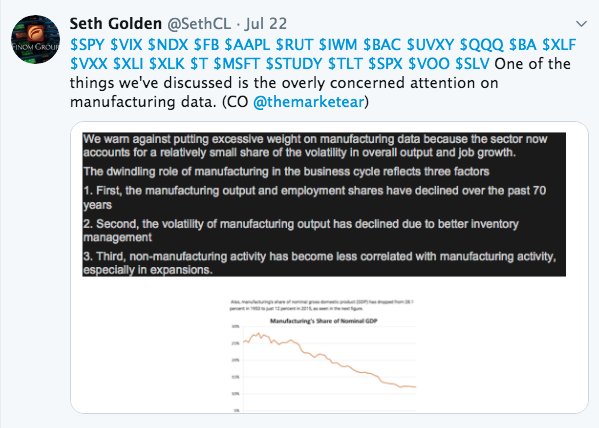
As we’ve been discussing over the last couple of months, while manufacturing isn’t dead and remains a driver of growth in the U.S. economy, it has increasingly become less and less of a driver for U.S. GDP since the 1970s. The following article from MarketWatch on Wednesday highlights what we have discussed from an educational and informative standpoint.
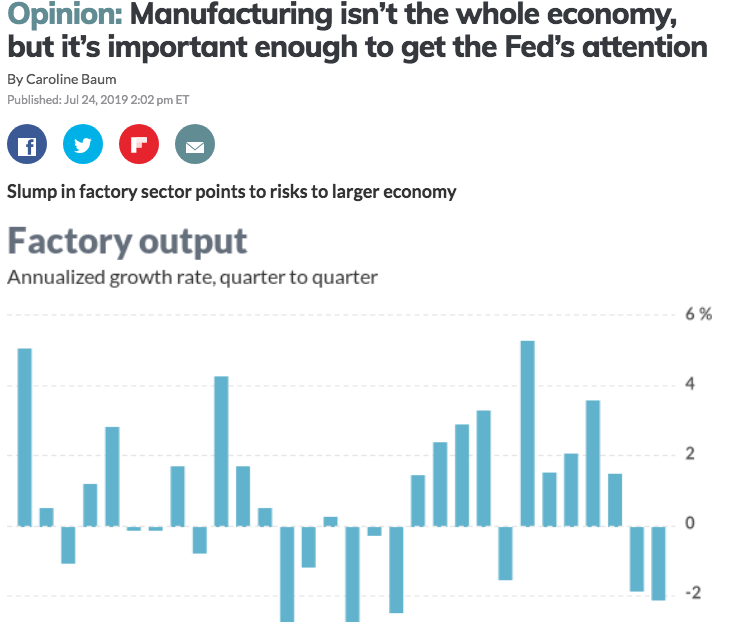
Manufacturing isn’t the economy, as Goldman Sachs economists pointed out in a report last week. Its share of gross domestic product has fallen to 10%, according to Goldman’s calculations.
That’s true, but manufacturing’s shrinking contribution to output has does nothing to diminish its role as a leading indicator of the economy. Here’s why.
Unlike the services sector, manufacturing tends to be cyclical. Manufacturers can choose to postpone capital investment projects when the future doesn’t look bright, but the public still needs teachers, nurses and firefighters, even in recession.
While manufacturing’s share of nominal gross domestic product has been declining since the 1950s, the story is a lot different if one looks at real GDP.
“In real terms, growth in manufacturing has kept up with growth in the rest of the economy over the last 70 years,” according to a 2017 study by economists at the St. Louis Fed. Its “share of real GDP has been fairly constant since the 1940s, ranging from 11.3% to 13.6%.”
It’s this last sentiment offered by Goldman Sachs that doesn’t jive with the trend in Real GDP. Check out the chart:
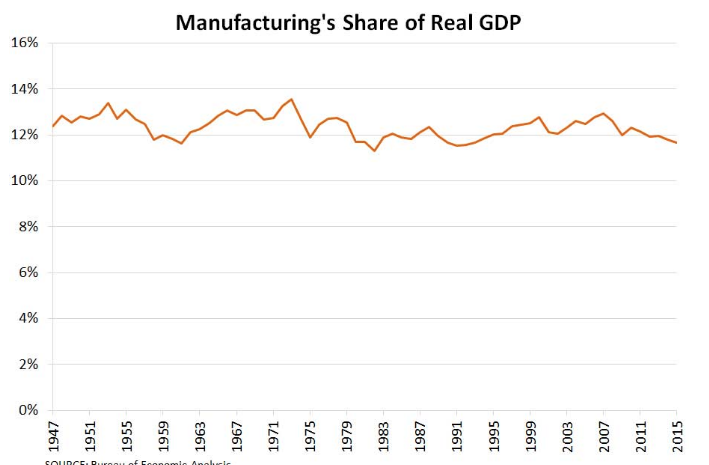
There is a clear and present decline from the peak in 1971 to present. While the decline in Real GDP vs. Nominal GDP may not be that great, the decline is persistent nonetheless. When the data is updated to reflect the period since 2015, which includes the increased financial technology services (fin-tech) since then, we can presume that the 11.7% reading in 2015 will drop further.
Speaking of manufacturing, IHS Markit said its manufacturing PMI slid to 50 this month from 50.6 in June, marking the lowest level since September 2009 just as the current expansion was getting underway.
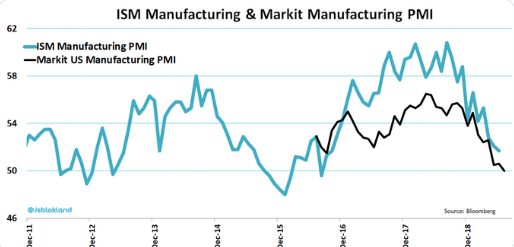
The slowdown in the manufacturing dovetails with weakness in Europe and Asia that’s weighing on the global economy, though the U.S. is doing better by comparison.
A similar survey of the much larger service side of the U.S. economy, retail, health care, software, tourism and the like, rose to a three-month high of 52.2 from 51.5 in June. Some 80% of Americans work in the service sector.
Manufacturers have slowed production and trimmed employment for the first time in six years, IHS Markit said. The automotive sector has shown particular weakness. The good news, however, is that demand in the United States remains robust, with most of the problems tied to exports and a slumping global economy.
The service side of the economy, on the other hand, showed some improvement. Executives said consumer spending remained fairly strong, though some companies had to resort to discounting to boost sales.
Also reported on Wednesday was YoY growth in mortgage applications, although on a WoW metric, applications fell despite lower interest rates on the 30-year fixed rate mortgage. Overall mortgage application volume fell 1.9% for the week, according to the Mortgage Bankers Association’s seasonally adjusted index. Volume was still 34% higher than a year earlier.
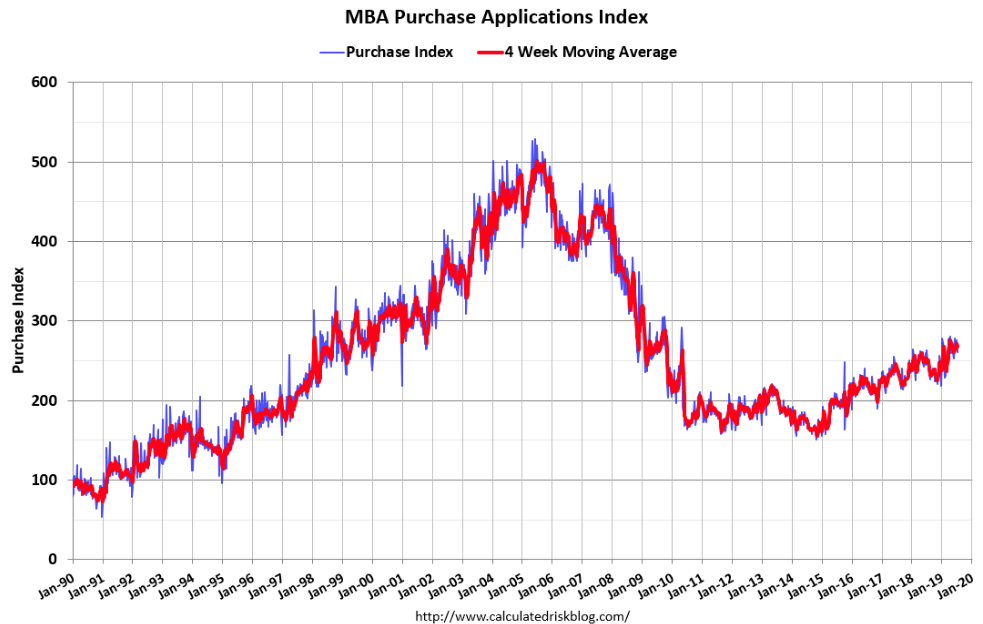
Refinance application volume did fall 2% last week, despite the rate drop, but was 81% higher than the same week one year ago. Mortgage demand for buying a home decreased 2% for the week but was 6% higher than a year earlier.
“Mortgage rates right now are comparable to the average rate of 4.10% for June, but refinances last week were 7% lower than last month,” said Joel Kan, MBA’s associate vice president of economic and industry forecasting. “This is an indication that as we see rates lower for longer, borrowers need more of a drop in rates to consider refinancing.”
In other Housing sector related data, New home sales missed economists’ estimates for the month of June, but sales did rebound for the first time in 3 months. The annual sales pace for new single-family homes in the U.S. rose 7% last month to 646,000, led by a big gain in sales in the West, the Commerce Department said.
Economists polled by MarketWatch had expected a June sales rate of 657,000, compared with an original May estimate of 626,000. On Wednesday, the government revised May’s rate to 604,000.
Sales in June were up 4.5% year-over-year compared to June 2018. Year-to-date (through June), sales are up 2.2% compared to the same period in 2018. This comparison was the most difficult in the first half of 2018, so this is a solid first half for 2019.
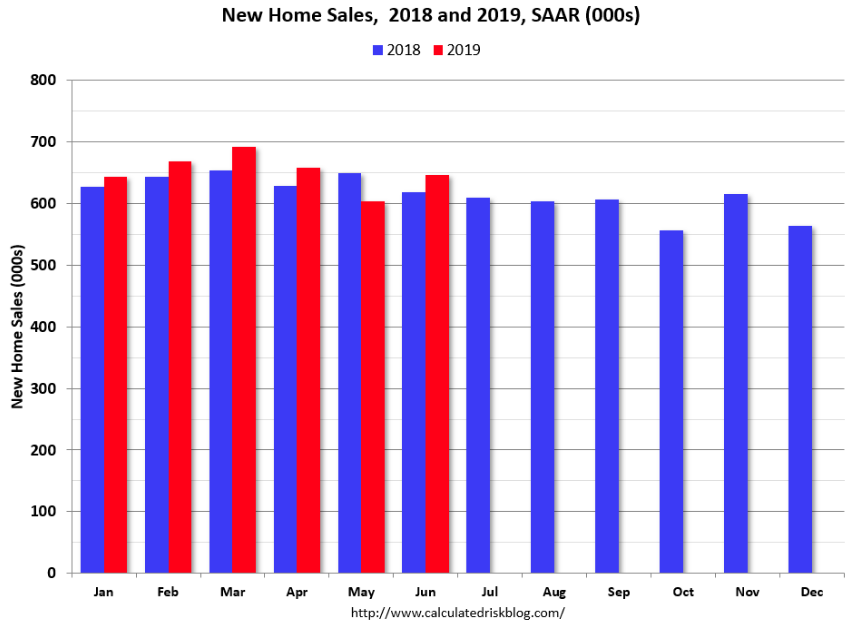
At the current pace of sales, it would take 6.3 months to exhaust available supply, slightly above the 6 months’ supply that’s traditionally been considered the market of an evenly balanced market.
All of this economic data in the U.S. comes ahead of today’s ECB meeting, whereby some expect the central bank to signal a rate cut. President Mario Draghi didn’t leave any doubt about his institution’s willingness and ability to do “whatever it takes” to counter a fall in inflation expectations. All instruments are on the table and can be deployed. That was the message.
Traditional ECB watchers though expect a change in the central bank’s forward guidance at this month’s meeting on Thursday and then potential action on interest rates at its meeting in September.
“In response to the weak growth and still subdued inflation, the ECB will likely adjust its guidance in July and vow to keep rates at ‘present or lower’ rather than just at ‘present’ levels,” said Florian Hense, an economist with Berenberg, in a research note earlier this month.
“In September the ECB could cut its deposit rate from -0.4% to -0.5% and to relaunch net asset purchases of around 40 billion euros for 12 months starting in (the fourth quarter of 2019).
On the same subject matter, but in contrast to the belief that a cut would come LATER rather than SOONER, a note from Cornerstone Macro’s Robert Perli says sooner. Perli sees potential for a more dovish ECB outcome tomorrow than expected. He thinks 40-45% odds they cut (instead of just telegraphing a Sept move) and could be larger than the expected 10bp.
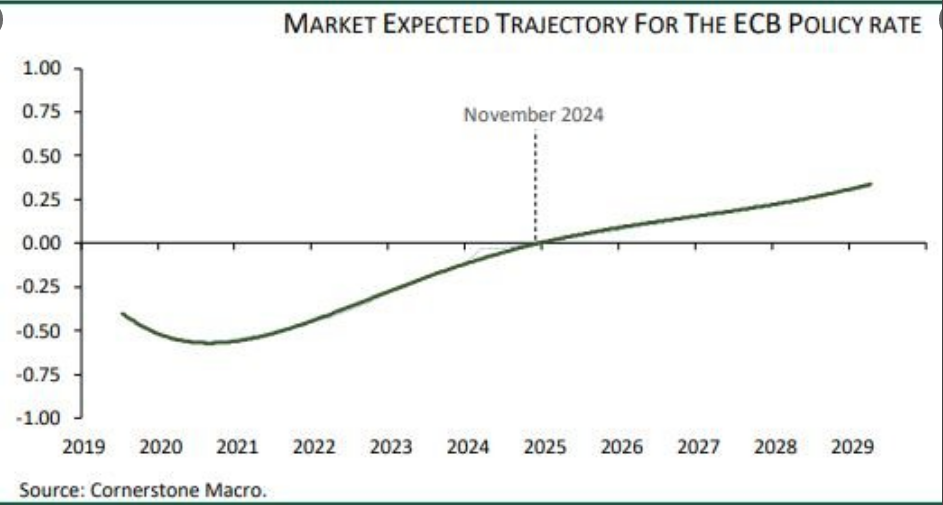
The point of forecasting central bank rates seems futile given history, but for some reason, firms see a need to do so. We’ll know soon enough what the intentions or actions are to be taken from the ECB!
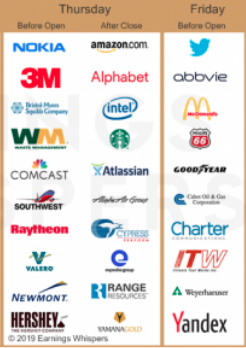
The earnings scorecard continues to roll out better than expected for the Q2 period. Investors will remain tech-focused for the remainder of the week and post earnings results from Facebook (FB). The following graphic identifies the key earnings reports to be delivered Thursday and Friday.
The weekly expected move for the S&P 500 this week is roughly $40, up from the previous week as the VIX rose more than 16% last week, in contrast to the VIX’s performance for the current week. Having said all of that, the S&P 500 has already achieved the weekly expected move as of Wednesday’s close. This leaves a lot of options exercised with still 2 trading days to go in the week.
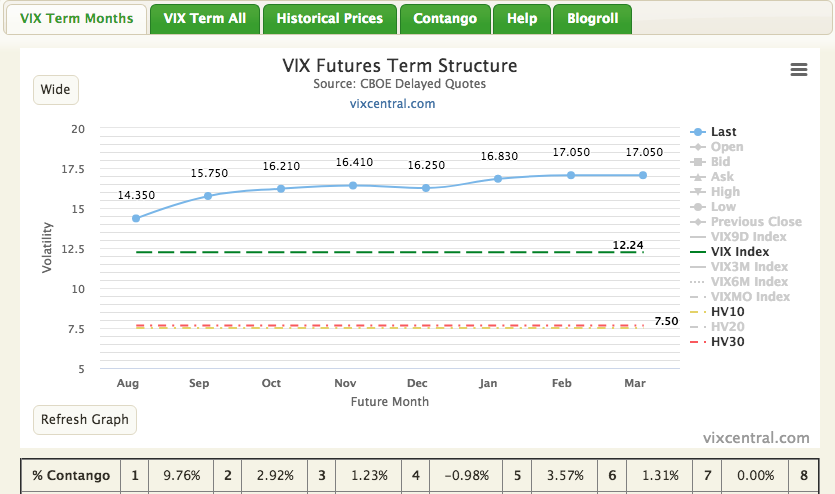
Volatility has left the building, or so you may think and with the VIX hovering just above 12 Wednesday. When we look even deeper into market volatility we see that the S&P 500 10- and 30-day historical volatility/realized volatility measures are 7.5% and 7.66%, respectively. The only other recent corollaries in terms of market calm are May 2, 2019 (SPX 30-day 7.4%) and October 9, 2018 (SPX 30-day 6.1%). When we post the chart from vixcentral.com, both 10-and 30-day realized volatility are so low and close to each other, you can’t see both on the chart 😉 !
A recent article from the CBOE highlights the current state of market volatility as follows:
“There are some potential catalysts for future and implied macro volatility. Earnings season is in full swing, but generally speaking, overall market volatility tends to decline during earnings as single-stock names move but cancel one another out from an overall standpoint.
However, in a recent report from Credit Suisse, Mandy Xu, their chief equity derivative strategist, argued that the options marketplace may be underestimating the potential volatility of this earnings cycle. J.P. Morgan Chase Strategist Bram Kaplan proffered a similar thought, stating, “We would be generally biased toward being long single-name volatility into earnings.”
One thing I try to invite or maybe insist upon traders is the notion that forecasting volatility is a foolhardy practice. Having said that, it’s a fundamentally sound practice to have fundamentals-based forecast for market volatility. Here’s what I offered last year to our readers:
For 2018, however, we do see the current median range of 15+ percent being exactly what we’ve expected to see and as Finom Group has written about in previous reports.
“Finom Group expects a median VIX reading of 15.70 for the VIX in 2018, +/- .50 percent. Review the table of Median daily VIX prices below.”
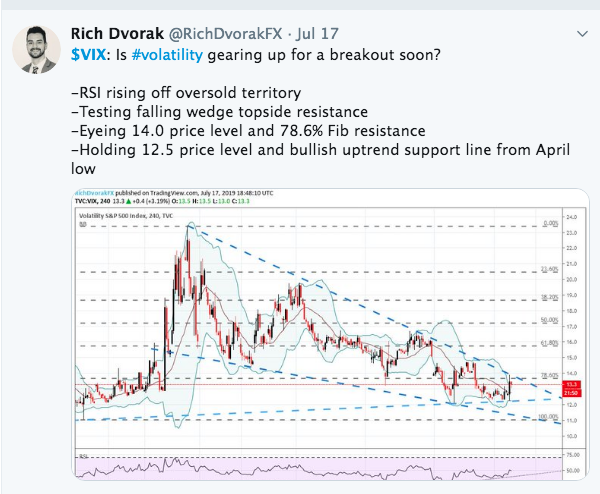
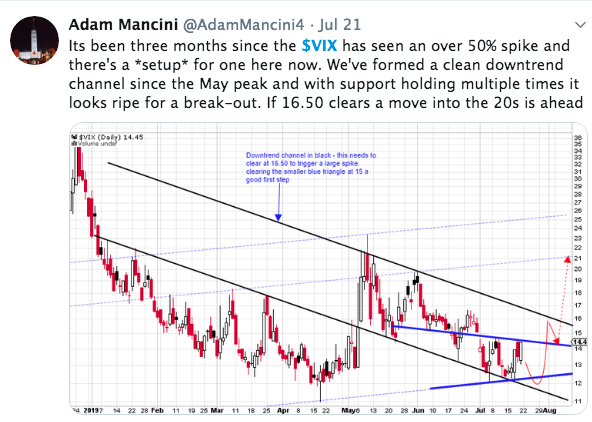
The common understanding is that the VIX is a stochastic, oscillating process that mean reverts, a derivative to boot. Given this fundamental understanding, the reasons to use technical analysis are muted if not all but unnecessary. Nonetheless, you’ll find thousands of traders doing nothing but charting the VIX on social media. Almost all charts look the same way too, a downward trending channel with breakouts periodically. For what? To time a breakout? And how does that lend itself to trading disciplines? Timing the market suggests, in and of itself, a lack of discipline.
Again, it’s not a matter of “if” volatility will return, but “when” and possibly even “how”. Exposure to the volatility complex demands of it greater discipline than that which can be extrapolated from a chart. As a whole, the volatility complex is… well complex. Take for example Wednesdays end-of-day jump in the Volatility of Volatility (VVIX). Seriously, there’s a Volatility of Volatility? I refer to my “volatility is complex” comment!
The VVIX Index is an indicator of the expected volatility of the 30-day forward price of the VIX. This volatility drives nearby VIX option prices. Cboe also calculates a term structure of VVIX for different VIX expirations. The VVIX or any point on its term structure is calculated from a portfolio of VIX options (VVIX portfolio) using the same algorithm used to calculate the VIX. Approximate fair values of VIX futures prices and their standard deviations are derived from the VVIX term structure. Selling a VVIX portfolio on a consistent basis can capture a volatility risk premium.
To simplify what or how to recognize VVIX as it relates to the VIX, we suggest that VVIX is a forward “leaning” indicator for the VIX. It tends to foreshadow where the VIX is heading near-term. So with Wednesday’s jump in VVIX at the very tail end of the trading day, massive as it was, does this mean the VIX is about to jump, fundamentally speaking?
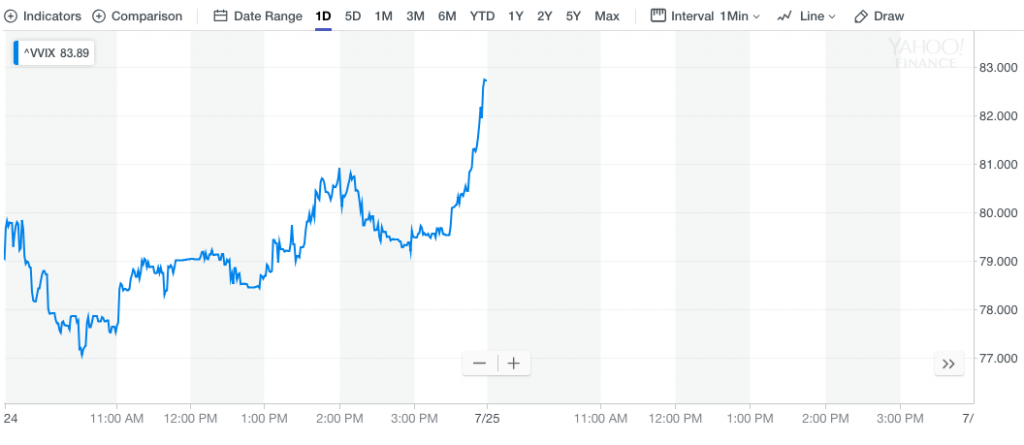
Right at the end of the trading day, pretty interesting and severe right. Clearly, some folks were buying VIX call options, which push VVIX higher. The VIX complex being largely comprised of hedging activity, we will find that cheap hedges are scooped up rather quickly. But in the modern technology era where algorithmic and/or programmed trading dominates, portfolio/fund managers have automatic programs set for when cheap hedges present themselves, the programs kick in. As such, it is unlikely that the chart posted of Wednesday’s late day spike in VVIX was anything but those trading programs executing on cheap VVIX options. VVIX below $80, as it was, is considered very cheap! And that’s where things get a little murky when it comes to whether or not VVIX is foreshadowing where the VIX is heading, relative value of VVIX/VIX options plays a role in such determination. If VVIX was $90 and we witnessed a large spike or drop in the index, we could suggest soon thereafter the VIX is likely to follow, but with VVIX below $80 and programmed trading being what it is, the forward predictive value of VVIX is limited.
Whatever the VIX complex delivers, we’ll look to trade it abundantly and prudently at Finom Group. At present, I view the VIX on the verge of mean reverting higher. How much higher remains the unknown, which is why I encourage patience for the short-VOL trade. Why not go long VOL ahead of this forecasted mean reversion you might be asking? I refer to the previous “market timing” and “to what degree” comments and compound those comments with the understanding that we are entering an central bank easing cycle with VIX Futures term structure expressing a high degree of contango. In short… it’s simply more productive to short volatility spikes than to attempt to execute the right product at the right price/VRP (Volatility Risk Premium) on the long-VOL side of the trade.
Don’t forget, durable goods orders and Q2 2019 GDP will be reported Thursday and Friday respectively and with much anticipation.


