
Finom Group’s chief market strategist Seth Golden rarely offers a free public article denoting macro-market conditions, trends, or personal insights. Our best-in-class macro-market Research Reports 🔬, which are published solely for Finom Group institutional and retail investing clientele are so detailed, in depth, and undeniably an effective means for making capital allocation decisions that we prioritize our members’ exclusivity. As such, we hope this rare article finds you able to appreciate the content freely offered. Lastly, we encourage readers to subscribe to our exclusive content ahead of the upcoming release of our 2026 Outlook Report, before it’s too late. This annual report has been evidenced as the best guide-to-markets in the industry. With your membership to either our Contributor or Premium level, this content is delivered directly each week, and archived on-site at the click of a button. Thank you for considering Finom Group for your financial markets education!
Technical Observations During Market Melt-Up 📊
The following technical analysis will be more educational than anything else. We hope that’s generally the case, but even so…The few charts we’ll discuss will ask investors to log the analysis for both today and future consideration.
With the seemingly endless melt-up in markets since April 8th’s bottom, and markets consistently expressing new Advance/Decline Line highs that lend toward validating the index all-time highs, investors may find themselves less concerned about a future market correction or meltdown. I would suggest worrying about a correction is somewhat futile and wasteful. You’ll never know a corrections precise timing, or even if that normal and to-be-expected correction will turn into a bear market. As such, futile and wasteful. What you can do, however, is recognize market strength and/or fragility in order to maintain appropriate exposure to the market, given the aforementioned market conditions.
Coming into 2025, the Golden Capital Portfolio was extremely cash heavy and overexposed to a highly liquid, high yielding, cash-like product known as SGOV. Some reasons for this unusually high cash-like product was largely due to quant data sets that had suggested a reasonably high probability of an intra-year correction and even a flash bear market. Please read the analysis below, which is a sample data set offered inside the former Finom Group 2025 Outlook report (issued November 2024 for Finom Group exclusive Contributor and Premium members): Our published 1H 2025 Outlook included a highly probable 10%+ correction and/or a flash crash-like bear market, likely to recover in 2H 2025.
“A more dangerous point is when the S&P 500 rallies +75% from a 2-year low. That is an ~ 8ppt+ gain from where the S&P 500 stands as of Friday November 22, 2024. This is how some of the sharpest, non-recession market crashes had been triggered and as shown in the 3 most recent examples:
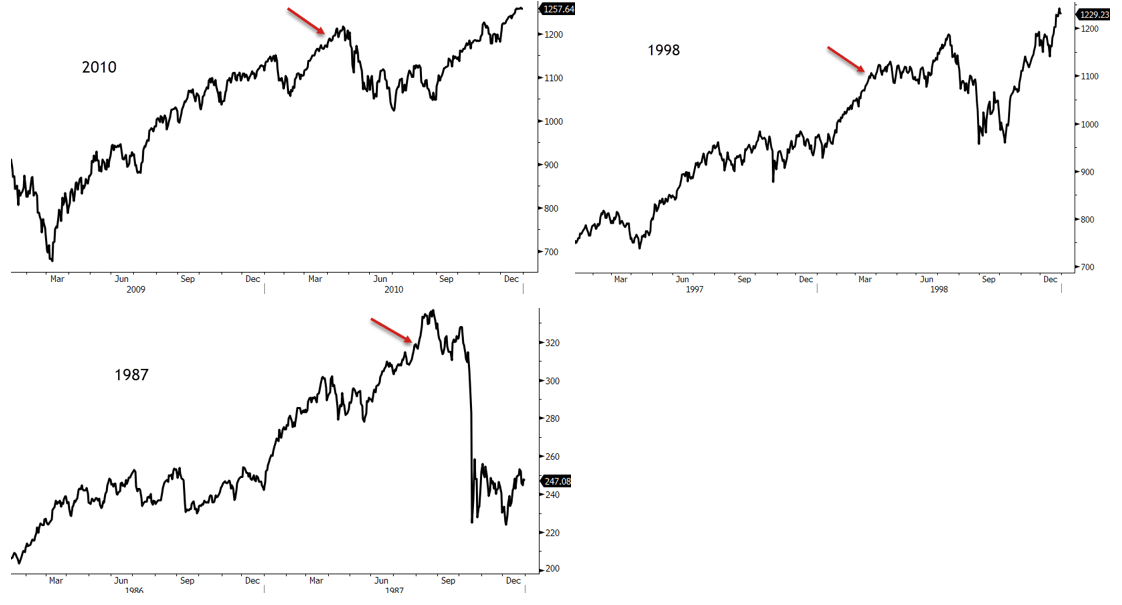
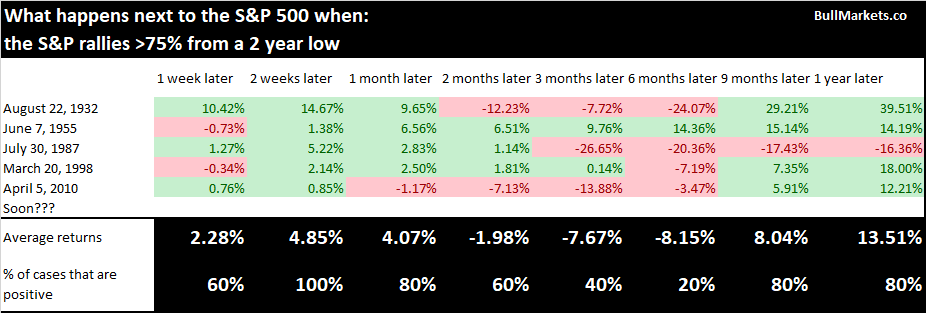
I’m just saying, root for the healthy market melt-up folks, you’ll thank me later. Either way, the current ROC from the 2-year low begs of investors to consider the probabilities for the New Year, and we will simply know more about those probabilities after the final 5 weeks of 2024 have been completed.”
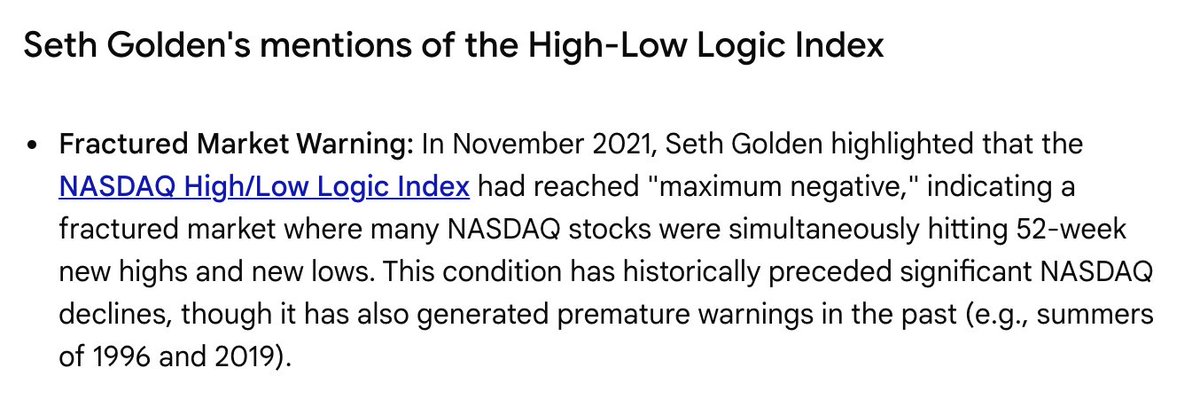
Other reasons for the heavy cash-like position were technical in nature. The High-Low Logic Index was sending a bearish signal through much of 2021 and 2024’s bull market, informing of the increasingly bifurcated nature of these bull market rally years. Both of those bull market years resulted in bear market conditions the following 2022 and 2025 calendar years.
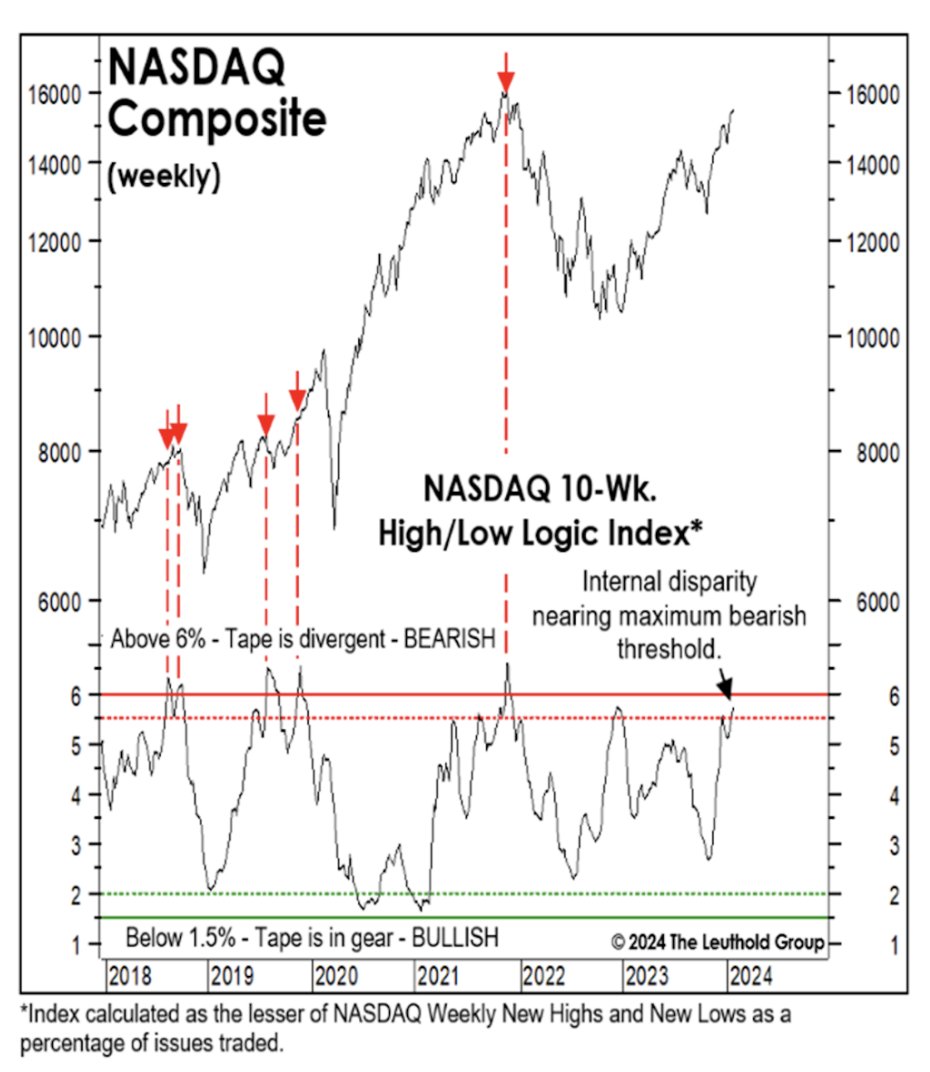
The stochastic/indicator had been flashing a warning for more than 7 months in each occurrence, informing that such indicators are not causal. The High-Low Logic Index warning signal did not cause the 2022 or 2025 bear markets, they simply signaled the fragility of the markets that would still demand a catalyst to produce such bearish market price action. Naturally, both bear market occurrences found such catalysts.
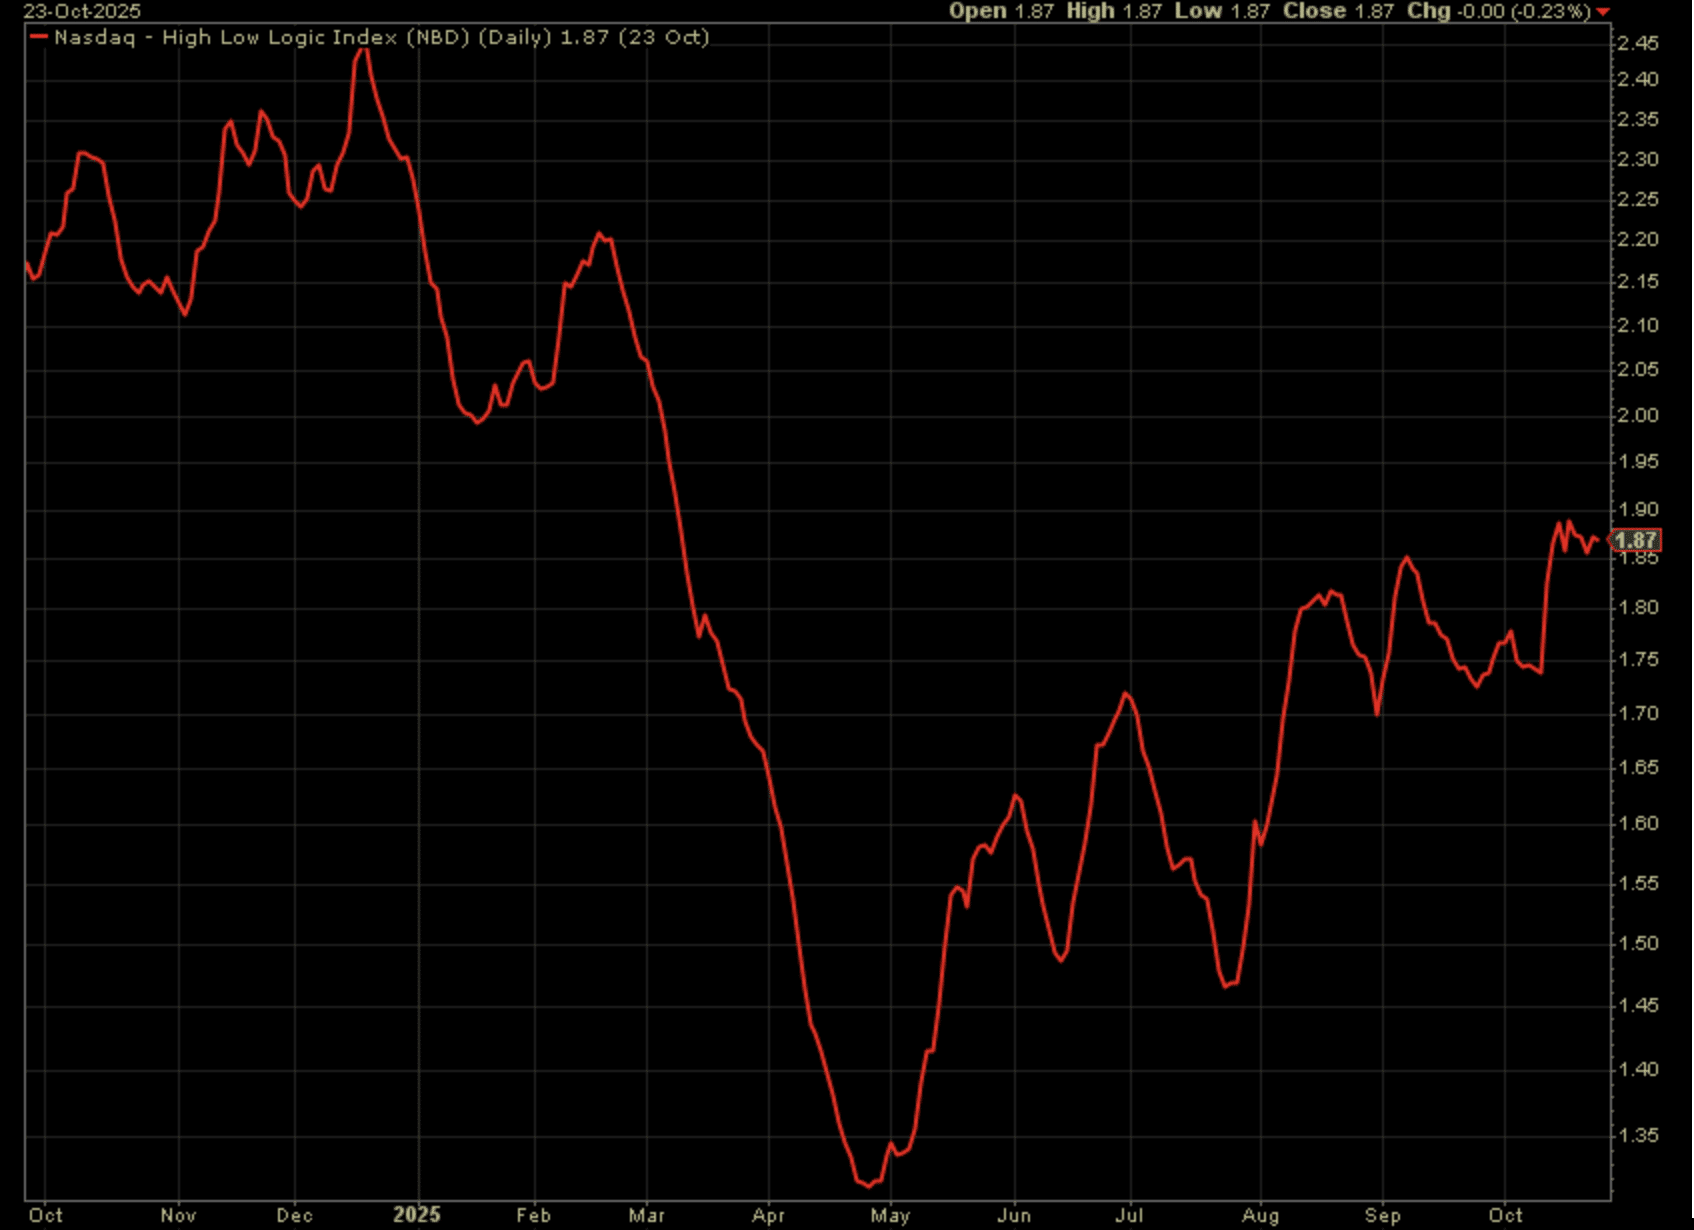
For the Nasdaq Composite, the High-Low Logic Index reached record levels in late 2024, but crashed lower with the 25% index decline in early 2025. Since the summer, however, the HLL Index has returned to the “danger zone” (above 1.70). A reading in the danger zone is not the end of the world and is not confirmed by the NYSE High-Low Logic Index, which it demands no confirmation from anyway, but as an aside the two indices with elevated readings would prove that much more concerning. In short, when asked as to wether or not one can utilize technicals and stochastics to inform of how to better allocate capital, this was one such example of many which answers that question positively.
While the High-Low Logic Index proves innocuous thus far and in my opinion, I’m sure there are many other technical renderings that prove more concerning here in the Q4 period. Additionally and as it pertains to our pre-2025 warnings offered in November 2024, the fact that the S&P 500 had not tested the 200-DMA all year was another quant data point of emphasis. Historically, such a technical feat of strength that survives a whole calendar year is met with a steep correction in the following year.
With that being said, one of the more consistently concerning aspects of the 2025 recovery rally we are going to explore for this technical exercise is the percentage of stocks trading above the 50-DMA within the S&P 500. The annotated chart below identifies a longstanding bearish breadth divergence.
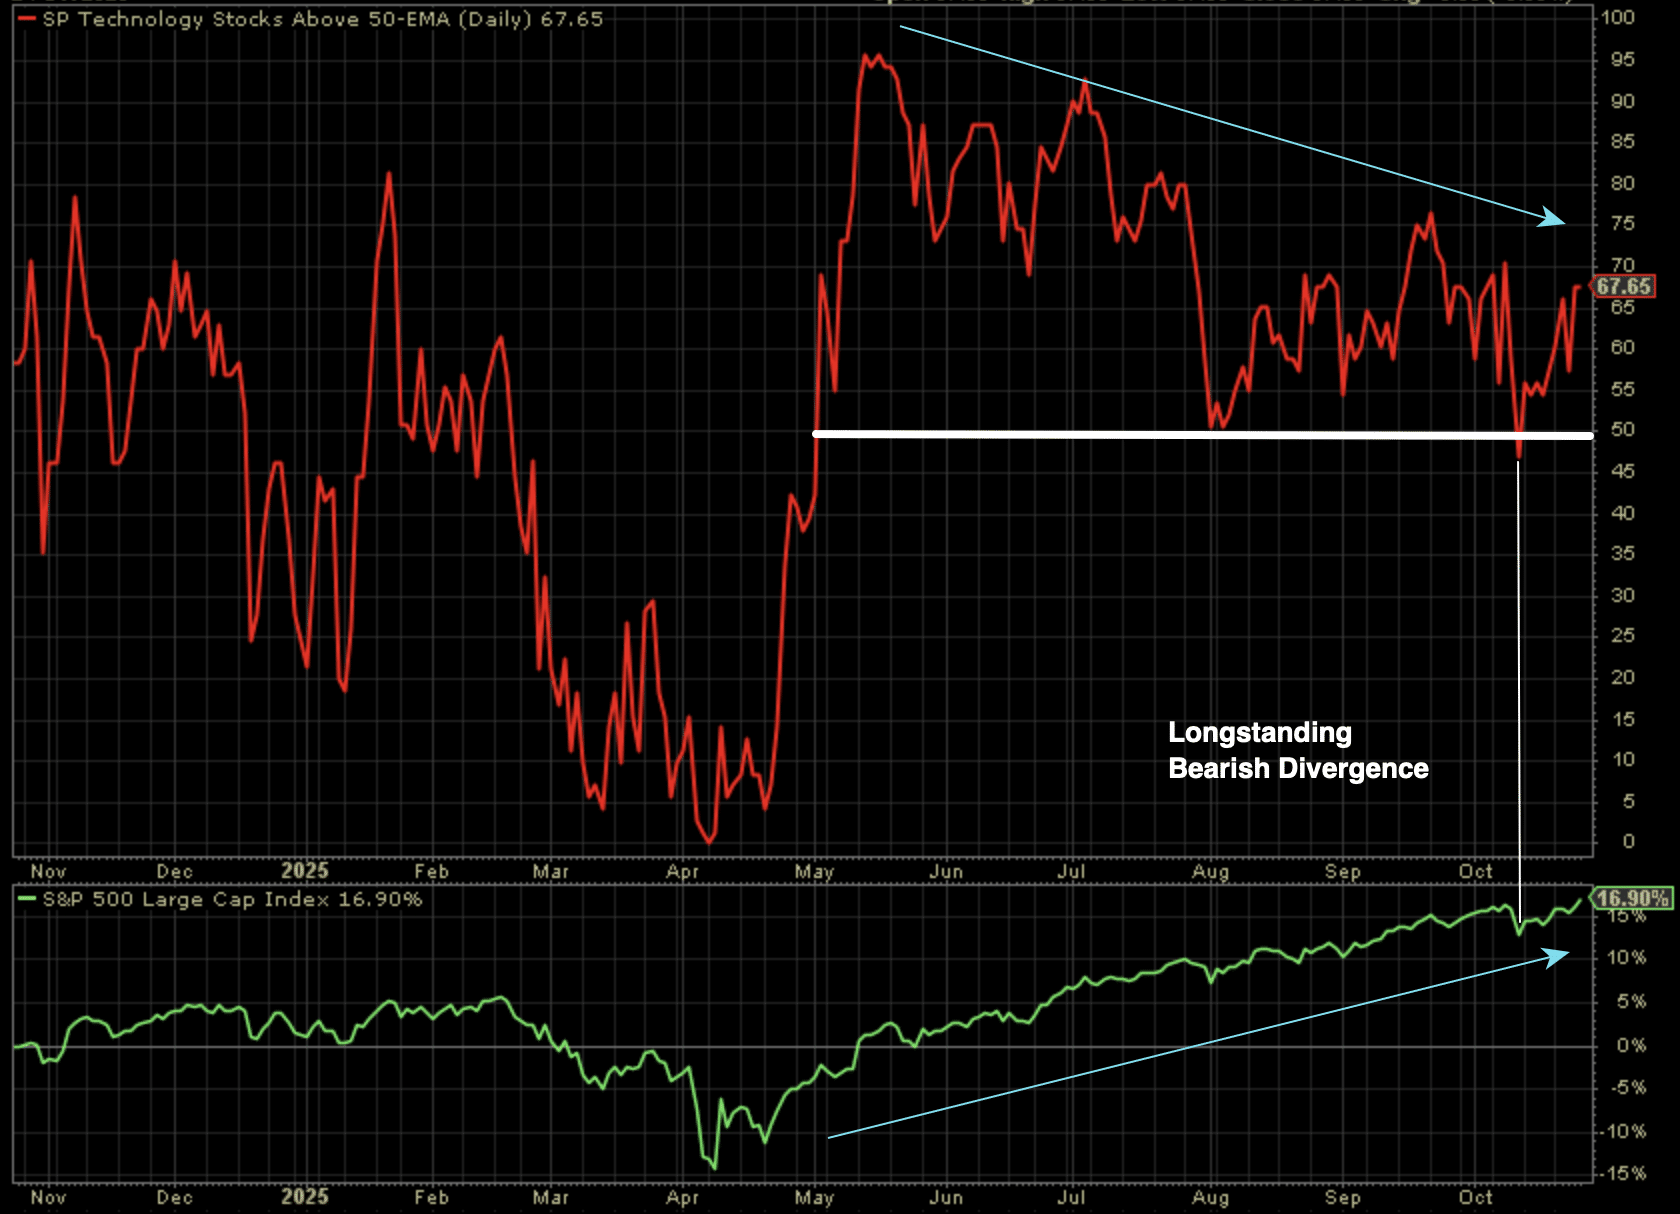
The beautiful aspect about this chart rendering is that it not only informs of the bearish breadth divergence, but that such divergences, like warning signals from the High-Low Logic Index, are not timing tools. Almost all manner of technical warnings demand a catalyst. For such a protracted bearish divergence, it obviously denotes that all the trade headlines have not proven a catalyst to deny the cap-weighted index of it’s uptrend since April. What it also informs is that technicals do not drive price the vast majority of the time, but rather fundamentals. Any investor/trader following the path of the 2025 earnings growth and positively revised estimates for 2026’s earnings growth can identify the 1:1 correlation for price and earnings.
With that being said, what the ongoing lower-highs and lower-lows for the percent of stocks trading above their 50-DMA suggests is that while the index is trending ever-higher, fewer and fewer stocks within the S&P 500 have trended as well as the index itself. This is identifiable “fragility” of the index as a whole. Should there prove a bearishly consequential fundamental or macro-catalyst in the future, this technical analysis will have likely proven a sound warning of the fragile nature of the late 2025 bull market. For now, we simply monitor the trend into year-end and will be able to discerning any worsening or improvement of the trend.
Moreover, I’m sure I could list a dozen or so index fragility warning charts presently, but they would prove redundant with no one chart proving a greater warning signal than the next. Secondly, such redundant technical exercises are often the practice of market technicians or trend followers who are seemingly always hunting for technical problems/pitfalls, resulting in perpetual portfolio underperformance. If you’re always looking for the downside of future price action, it’s invariably impossible for that posture to not plague one’s psyche and portfolio positioning. One more technical consideration, as it pertains to the ongoing bull market…
A Zweig Breadth Thrust (ZBT) had the potential to trigger on Friday of this past trading week. With one having already been expressed in April of this year and in 2 having triggered in 2023, investors were monitoring for the triggered signal on the final day for which it could have been achieved.
“The Zweig Breadth Thrust is a technical indicator created by Martin Zweig that signals a potential shift from an oversold to a strong, bullish market. A “thrust” occurs when the 10-day moving average of a market’s advancing stocks (as a percentage of total advancing and declining stocks) rises from below 40% to above 61.5% within a 10-day period. This rapid shift suggests broad market demand is overwhelming supply, potentially signaling the start of a major bull run.
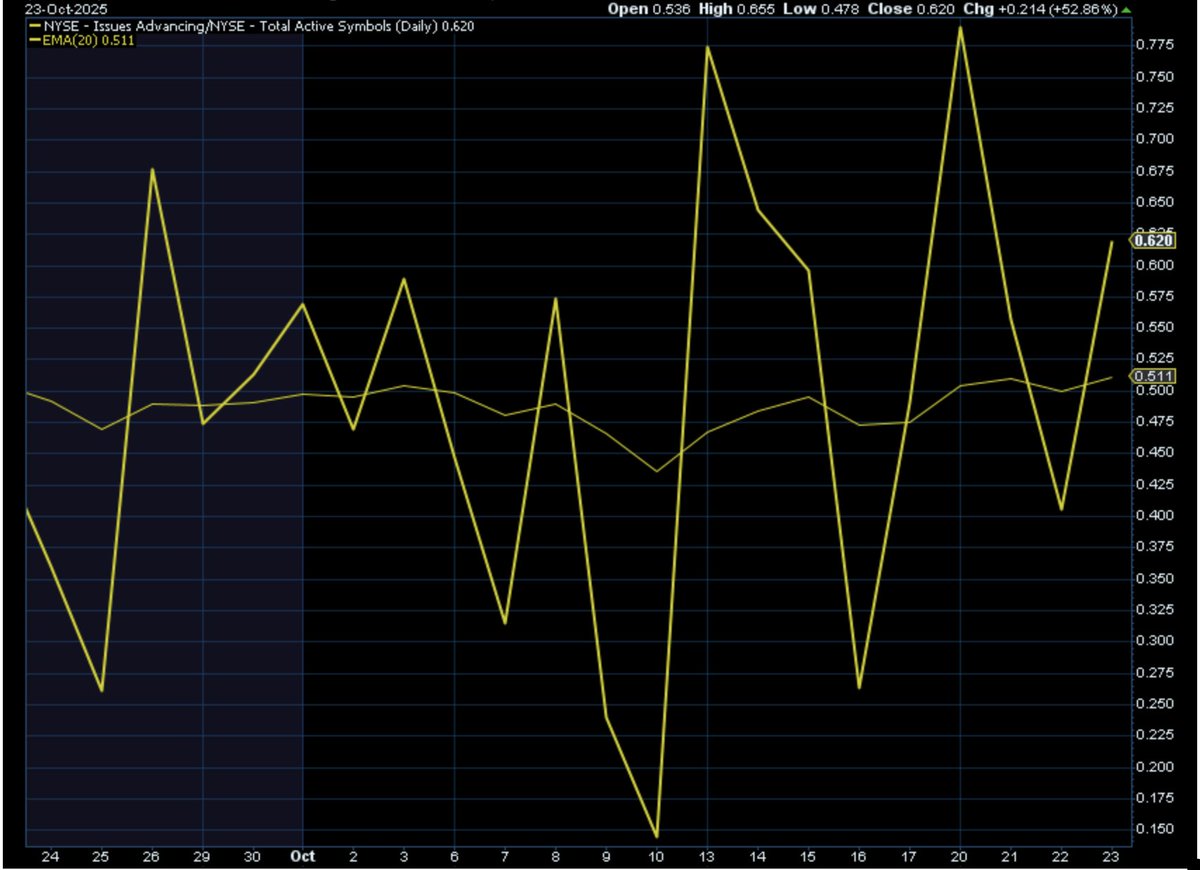
Because Friday was the final trading session to achieve this forward bullish breadth thrust and it didn’t trigger, I’m not of the opinion investors should simply shrug it off as a “nothing burger.” Price action, of all kinds, informs of algorithmic and human behavior. Every potential ZBT since 2020 has been realized, until this latest ZBT failure. Something has changed within the behavior of humans engaging in the market dips recently, and such tracking of ZBTs since 2020 helps to validate the behavioral change. The magnitude of the behavioral change may not be known for many months, but like the other technical renderings already discussed, I would be of the opinion investors/traders should log such detailed messages from Mr. Market and for future consideration.
There are plenty of favorable technicals taking place in the market presently, and equally favorable fundamentals (already discussed in former segments of this macro-market Research Report). With the S&P 500’s 34th all-time closing high this past Friday, the NYSE A/D Line managed, even if ever so slightly, a confirming all-time high as well.
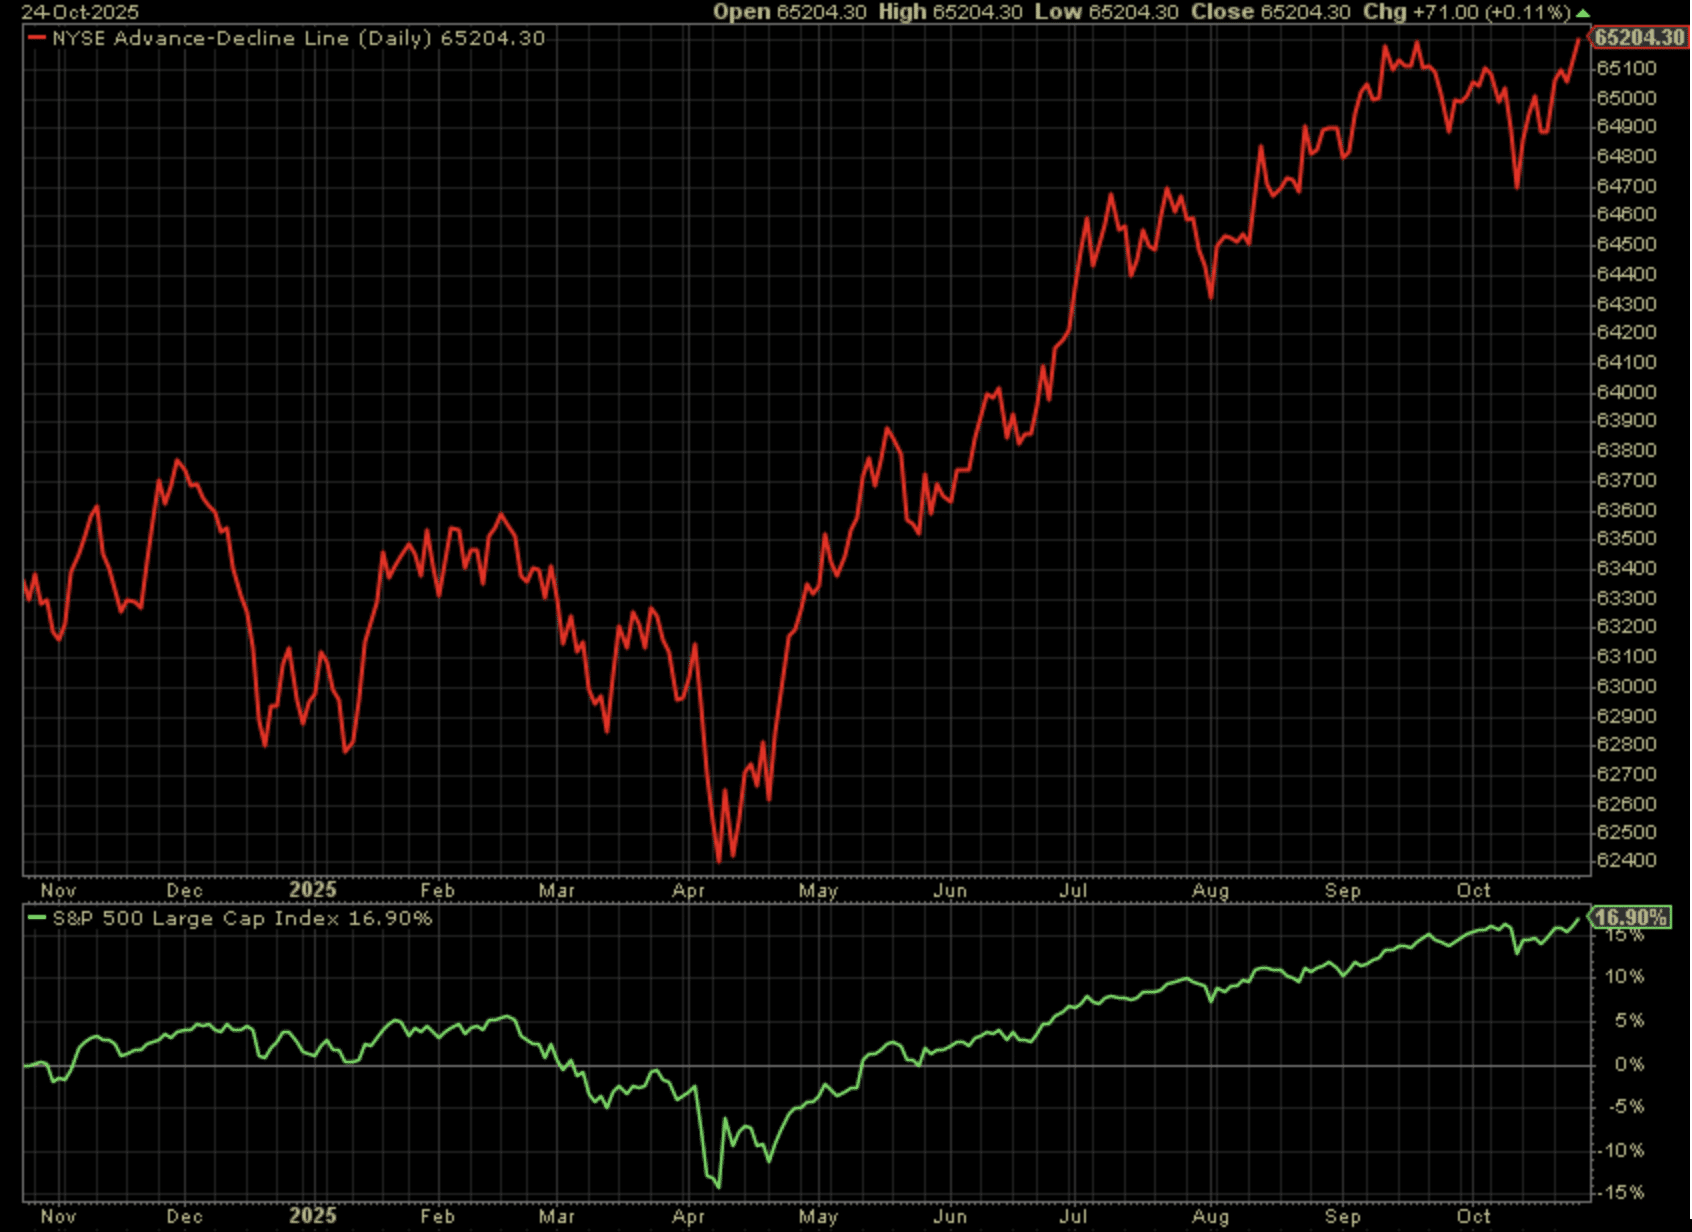
The Finom Group quant data informs that a confirmed all-time high by way of the NYSE A/D Line has historically led to additional gains in the S&P 500. The forward time for a peak price is an average of 7 months with an average gain of roughly 6% over that time period. For those hoping and megaphoning about a blow-off top, you’ll need an exogenous event, because that is not what typically happens after a confirmed new all-time high. Moreover, why would you use another index A/D Line to confirm the benchmark index’s all-time high. Don’t get me started folks. I’ve never agreed with such a belief system, but I don’t make the rules for what thousands upon thousands of technicians/investors/traders have chosen as a rule for decades. Right or wrong, if enough investors/traders believe in it, then there is a behavior that influences price action.
This was simply an exercise in recognizing some of the many warning signals for future price action, even if we don’t know the lead time of the warning/s. In my humble opinion, we’re likely reminded of this exercise in technical analysis come 2026’s Midterm election year. For now, the trend is your friend, just don’t fall in love  with the trend!
For the Finom Group full macro-market Research Reports and analysis, and Annual Outlook Reports archives, subscribe to our Contributor or Premium membership programs! Have a prosperous and healthy end of year folks!!
Right now, you’re just one decision away from unlocking a completely new level of investing and trading confidence. Why stay stuck on the sidelines with limited access when you could have the full toolkit, live guidance, and community at your fingertips—just like the professionals?
Here’s Why Upgrading Makes All the Difference
• Real Market Mastery: Every championship team has a great coach. With Contributor ($24.99/month, cancel anytime), you’ll learn from Seth Golden—a proven “market MVP”—and a supportive crew who actually want to see you win. It’s actionable, real-world learning, not just theory.
• Join the Conversation: Our daily Telegram chats and premium live Zoom discussions make complex markets feel clear and manageable, myth-busting Wall Street colloquialisms day in/day out. Imagine having active experts in your corner to break down every session, help you spot trades, and help you execute them live—like having a GPS for your financial future.
• Weekly Playbook: Get 5,000+ words of pro-level macro research, curated charts, and premium market strategy to help you navigate every twist in today’s ever-shifting landscape.
Click HERE for a 100% FREE sample of our Morning-Market, LIVE TRADING ROOM SETUP from October 23rd!
Click HERE to view our 2025 Macro-Market Outlook Research Report, “Keeping it 100% in 2025”
Ready to take the next step?
• Contributor Membership ($24.99/month): All macro research and daily community access.
• Premium Membership ($79.99/month): Live daily interactive Zoom sessions, 300+ yearly proprietary trade alerts, 1-on-1 Q&A with Seth Golden, and the deepest community and research access on/off Wall Street.
Either subscription tier is month-to-month. Cancel Anytime. Total support.
Welcome to the family—don’t leave your edge on the table.
Let’s build your long-term success together, one smart step at a time.
Upgrade your membership now and join the first (of many) LIVE pro-trading sessions with Chief Equity Market Strategist Seth Golden Monday thru Friday.
–The Finom Group Team


