
Welcome to our Finom Group October Monthly Macro-Market Recap
October 2025 MONTHLY MACRO-MARKET QUANT RECAP
THE MOST HATED V-SHAPED RALLY: MARKET STRUCTURE, CYCLES & THE QUANT TIGHTROPE
October closes not just with a flurry of headlines or policy speculation but with the market continuing to write its own, unique script atop sturdy earnings growth, resilient margins, and relentless upward price action recently powered by a Zweig Breadth Thrust (Signal date: April 24, 2025). The S&P 500 has scaled to its 37th all-time high this year, we have only stopped making ATHs at 37 once since 1929 and that was in 1965, quickly surpassing 1999’s record of 35 this week 😉, therefore setting us up for an 89.5% probability of one more high by year-end.
Octoberphobia has once again proved a self-fulfilling prophecy, and “The Bear Killer”, per Almanac Trader, is on track to deliver a 3% monthly gain 😱, if halloween day doesn’t turn out to be so spooky… 👻 and fulfilling a stretch that, historically, sets the market up for further highs before year-end. Finom Group’s research underscores that these 6 and 7 consecutive positive months for the SPX and NDX, respectively, have come not through happenstance, but by way of methodical, scheduled price action, disciplined dip buying, and persistent earnings upgrades—even as Trump Tariff anxieties swirl over monetary policy and fiscal politics.
In the midst of the ongoing uncertainty from the US GOV shutdown, the FOMC’s latest limited-data move was the following: Stephen Miran, dissented to lower the target range for the federal funds rate by 1/2 percentage point (of course 😂😅) and Jeffrey Schmid dissented no change to the target range for the federal funds rate. Fed lowered the rate by 1/4 percentage point to 3-3/4 to 4 percent, amid the softening rhetoric on inflation and worried-labor market. All this “noise” takes a back seat to what the tape and quant models already foreshadowed.
The 10-year yield—so popular as a media narrative—has offered little practical guidance for equity returns this cycle, US LT GOVT BOND YIELD CYCLE COMPOSITE for 2025 set to retreat into year end, per Leuthold group; instead, earnings, forward estimates, never-ending rotation and technical leadership keep dictating progress. Recent pullbacks and any headline-induced volatility have repeatedly proven to be tactical buying opportunities, not harbingers of a new regime. All quant data featured in the report—streaks, breadth thrusts, and every major forward signal—continue to support a constructive bias into the final two months of the year, with strong historical odds for further all-time highs and robust Q4 performance.
This macro backdrop is no accident. Q3’s earnings season so far has produced substantial positive revisions for 2025 and 2026, demonstrating that U.S. corporate profits remain not just intact, but strengthening. Even amid big-name earnings disappointments from the likes of Meta, Microsoft, and Netflix, bottom-up EPS forecasts for the S&P continue to rise—creating a sizable counterweight to tightening narratives or isolated sector struggles. It is a similar story across subsectors like healthcare, where Finom Group’s tactical overweight has recently delivered outsized returns and where insider buying ratios suggest further potential for re-rating going forward.
Inflation, while sticky in some corners, is showing the kind of “just right” moderation in areas that matter most: shelter costs are decelerating, goods inflation is modest, and crucial wage growth still outpaces the consumer price index. Utilities (this time is different!) and energy 💩 have spiked in some regions, but the broad inflationary surge of the past couple years appears contained, with tariff-driven bumps regarded as temporary rather than systemic threats. Employment data, even with sporadic noise from the government shutdown, point to continued labor market resilience—hardly a backdrop that signals imminent consumer collapse or end-of-cycle dynamics.
Crucially, October reminds us that market discipline and the right psychological frame matter more than any pundit’s forecast. Finom Group’s portfolio results and trading discipline this quarter echo a timeless lesson: perfection never exists, but consistent process, wise cash management, and tactical dip buying compound reliably over time. Technical warnings (from breadth divergences to Zweig and Hindenburg Omens and High-Low Logic readings) must be respected, yet history proves their effectiveness is always as a backdrop, not a trigger—every true correction still demands a real macro or earnings catalyst… and there is no such thing as a sell signal. Just buy-the-future-dip indicators! 🤑
For investors still obsessing over timing, or for those who dread each new discount as danger, the lesson could not be clearer: if you fear cheaper prices, you’re overleveraged. Small caps rarely outperform into the teeth of uncertainty—true leadership rotates after uncertainty resolves, not before. And permabulls, far from reckless, simply understand that time, not tactical brilliance, is the best friend of any investor working from real process and smart asset management.
To close October, the data delivers a clear message: the uptrend remains underpinned by real earnings momentum, rising forward guidance, and a policy environment that now seems more likely to chase than dictate the market’s lead. Ignore the noise, manage risk, keep cash nimble for opportunity, and lean into volatility with a rebalancer’s mindset.
The final stretch of 2025 is shaping up as a textbook study in the power of discipline, data, and letting time—not tension—be your portfolio’s best advantage.
Direct quote from Finom Group’s “Q4 Proposed Positive″ Report (October 5th, 2025)
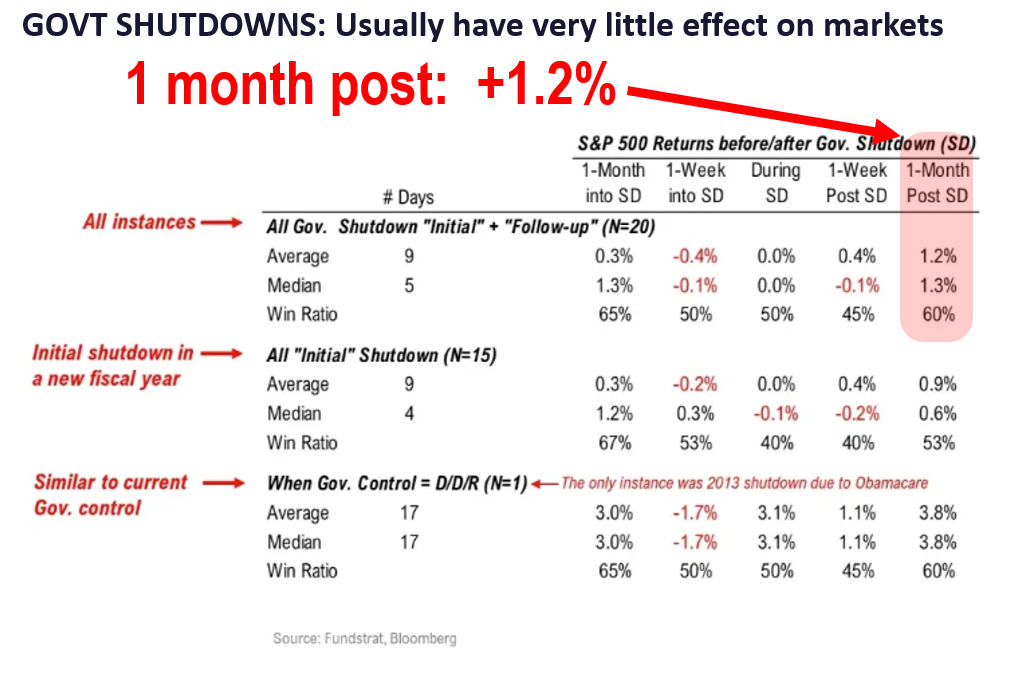
- I would not lean “bearish” because of shutdowns. As we highlighted earlier this week, shutdowns have rarely created lasting impacts on equities. So if stocks are down, we would be dip buyers. This is something to be mindful of, as we may hear of dire warnings of calamity because of the shutdown.
- But more importantly, we are entering the strong seasonal period (4Q) and this means stocks higher.
– since 1950, Oct to Dec median gain +4.9% (n=75)
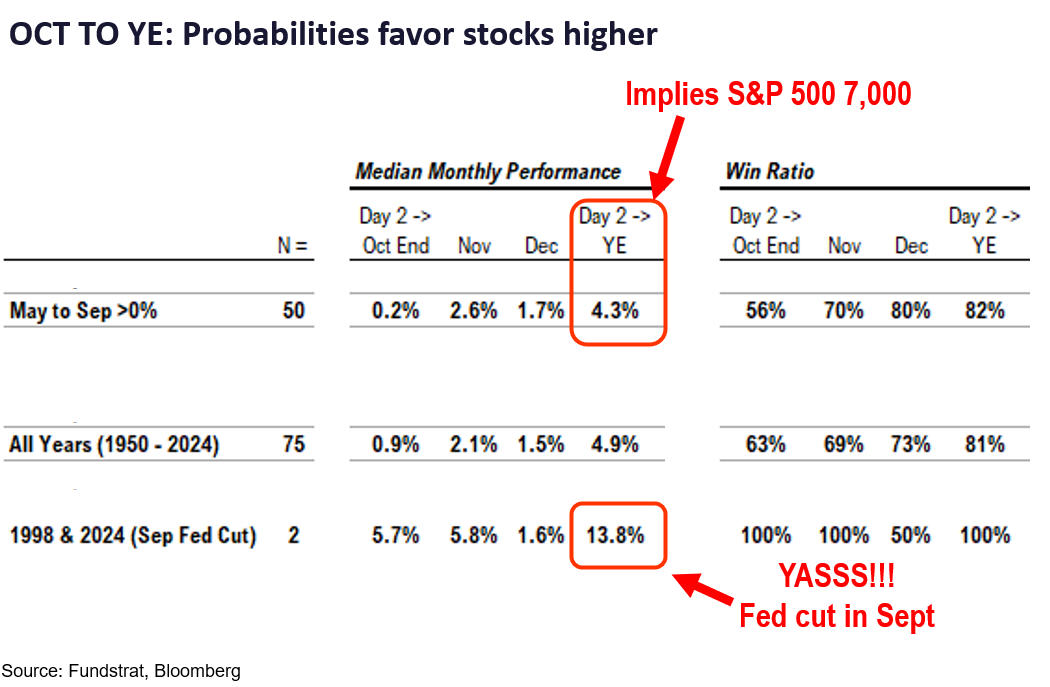
- – this implies S&P 500 7,050
– win-ratio 81%
– Fed cut in Sep, like 1998 and 2024
– avg gain 1998/2024 +13.8%
– implies S&P 500 7,750 - You get the picture. There is a strong seasonal tailwind underway and the upside is higher given the Fed is dovish. That is what we think also makes sense, given the continued skepticism around equities.
- So, we would urge looking through the messiness of the shutdown, and even the lack of data. If stocks are particularly weak, I would use this to “buy the dip.” And the same strategy holds for sectors (see below). I would not advise going “defensive” — except, owning Gold and Bitcoin make sense.
BOTTOM LINE: Still “most hated rally”
Direct quote from Finom Group’s “Q4 Proposed Positive″ Report (October 5th, 2025)
Observable Charts, Quants and Updates From Finom Group
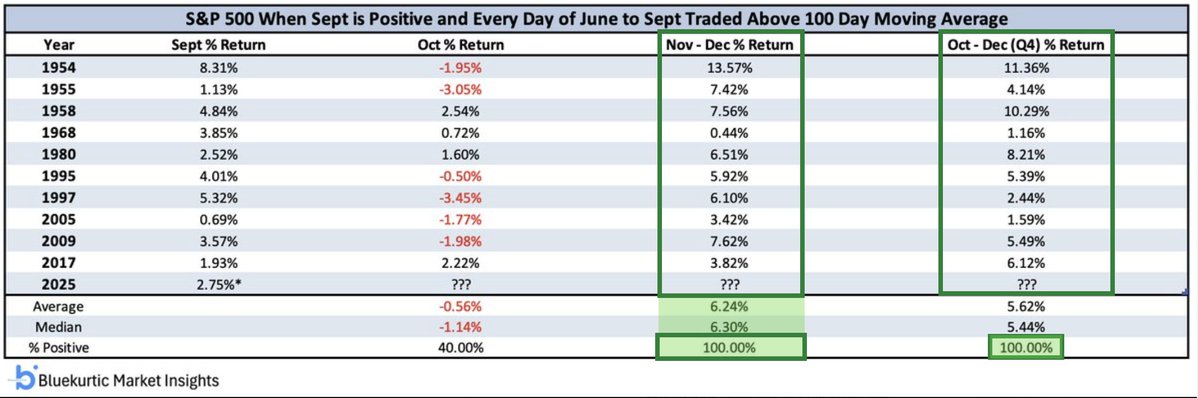
The above quant from Bluekurtic informs of the potential 5-month winning streak, if only due to the fact the S&P 500 may finish positive in the month of September while remaining above the 100-DMA since June, at least. Staying above the 100-DMA for this long, speaks to something more cemented in the fundamental landscape such that investors are not willing to wait for bigger pullbacks. We know what that fundamental something is and has been, the strength of earnings growth. As such, if we use this quant study we come to discern a more concrete and absolute understanding of the coming 3-month period. The S&P 500 has never delivered a negative return over the stated time period, with a focus on both the September achievement and price trend strength. The lesser returns, on average, outlined in the Oct-Nov period relative to the Nov-Dec period is respective of the October positivity and average returns outlined in the 3rd column.
Least we also not forget that the VIX has remained at reasonably low levels for the last several months, despite continuous all-time highs and attempts by market participants to time more material pullbacks with advanced hedging activity. This quant below also informs that investors/traders might not need to anticipate a significant pullback (-5%) in the coming October period (from with August 31, 2025 Research Report).

“I’m not terribly concerned with the near-term and when reviewing VIX quant data, but the longer-term probabilities are even more compelling than the near-term, which are still quite positive. The S&P 500 positivity rate 2 weeks forward speaks to limited downside potential through mid-September and leading up to the September 17th FOMC rate announcement/meeting. With a 2-week forward positivity rate of 91%, it will prove difficult to not buy the dip in the coming weeks. Having said that, there’s a lot of green in the table and the forward 9-month positivity rate of 100% informs investors that should any near-term probabilities fail to achieve their higher probability outcome, simply wait longer. The S&P 500 signal date/price… 6,501! Don’t be afraid
of a little increase in volatility ahead, embrace it and compound returns by year-end if not by May of 2026.
Recall the Wayne Whaley quant, which spoke to the high probability of higher prices from August 19 – September 1, 2025:

This quant now moves to 10-1 for the August 19th to September 1st period. Given that this is a price trend analysis quant study also, for the September 19th through October 12th period we need to use the September 18th closing price as the signal price over said time period, in order to set baseline expectations. The quant informs that the S&P 500 should trade lower than September 18th’s closing price of 6,631 by October 12th, not above but rather below that price. This informs that Friday’s rally or snapback was not likely a buying opportunity and a better buying opportunity is likely ahead. With that being said, wherever the market is on October 25th, investors will want to buy that price given the perfect 10-0 historic positivity rate over the October 26th to November 2nd period.
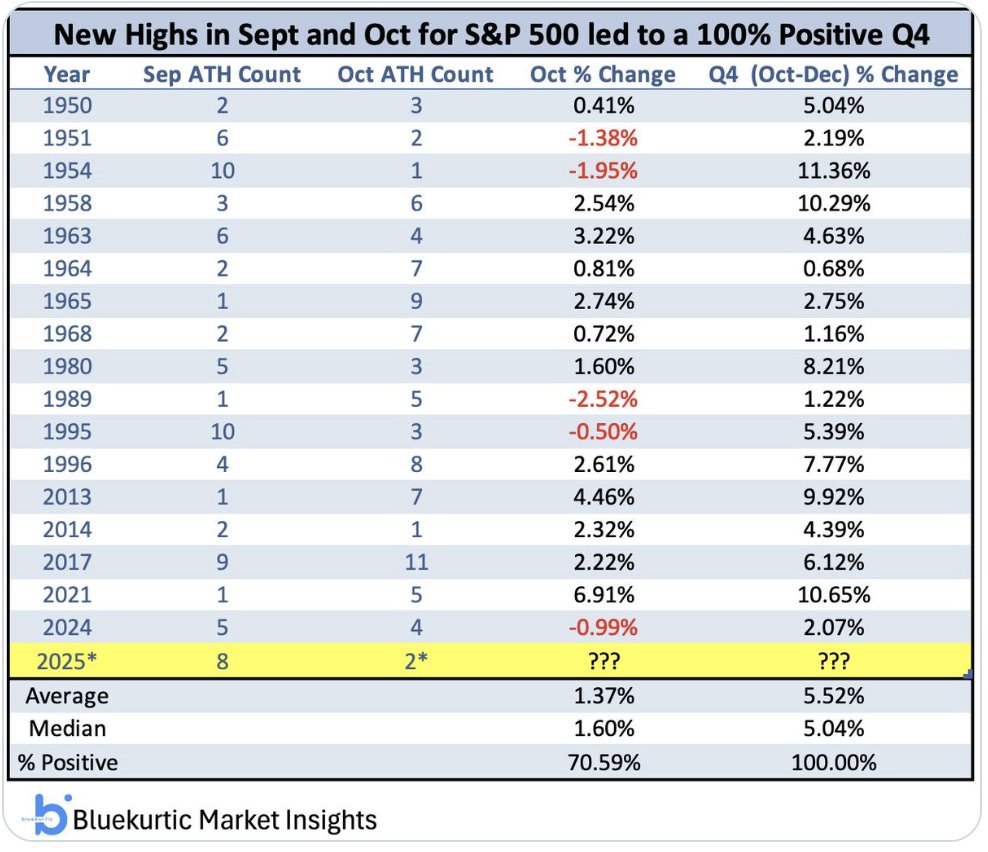
New all-time highs in September and October bode well for Q4. EVERY. SINGLE. TIME. higher in Q4 with a median gain of +5% ALSO, the S&P 500 has never made an all-time high in the month of October for 3 consecutive calendar years (2024, 2025…? ). Midterm-election 2026, something to consider! January 2026 should be negative as well, spoiler alert to bookmark. Doubt me?
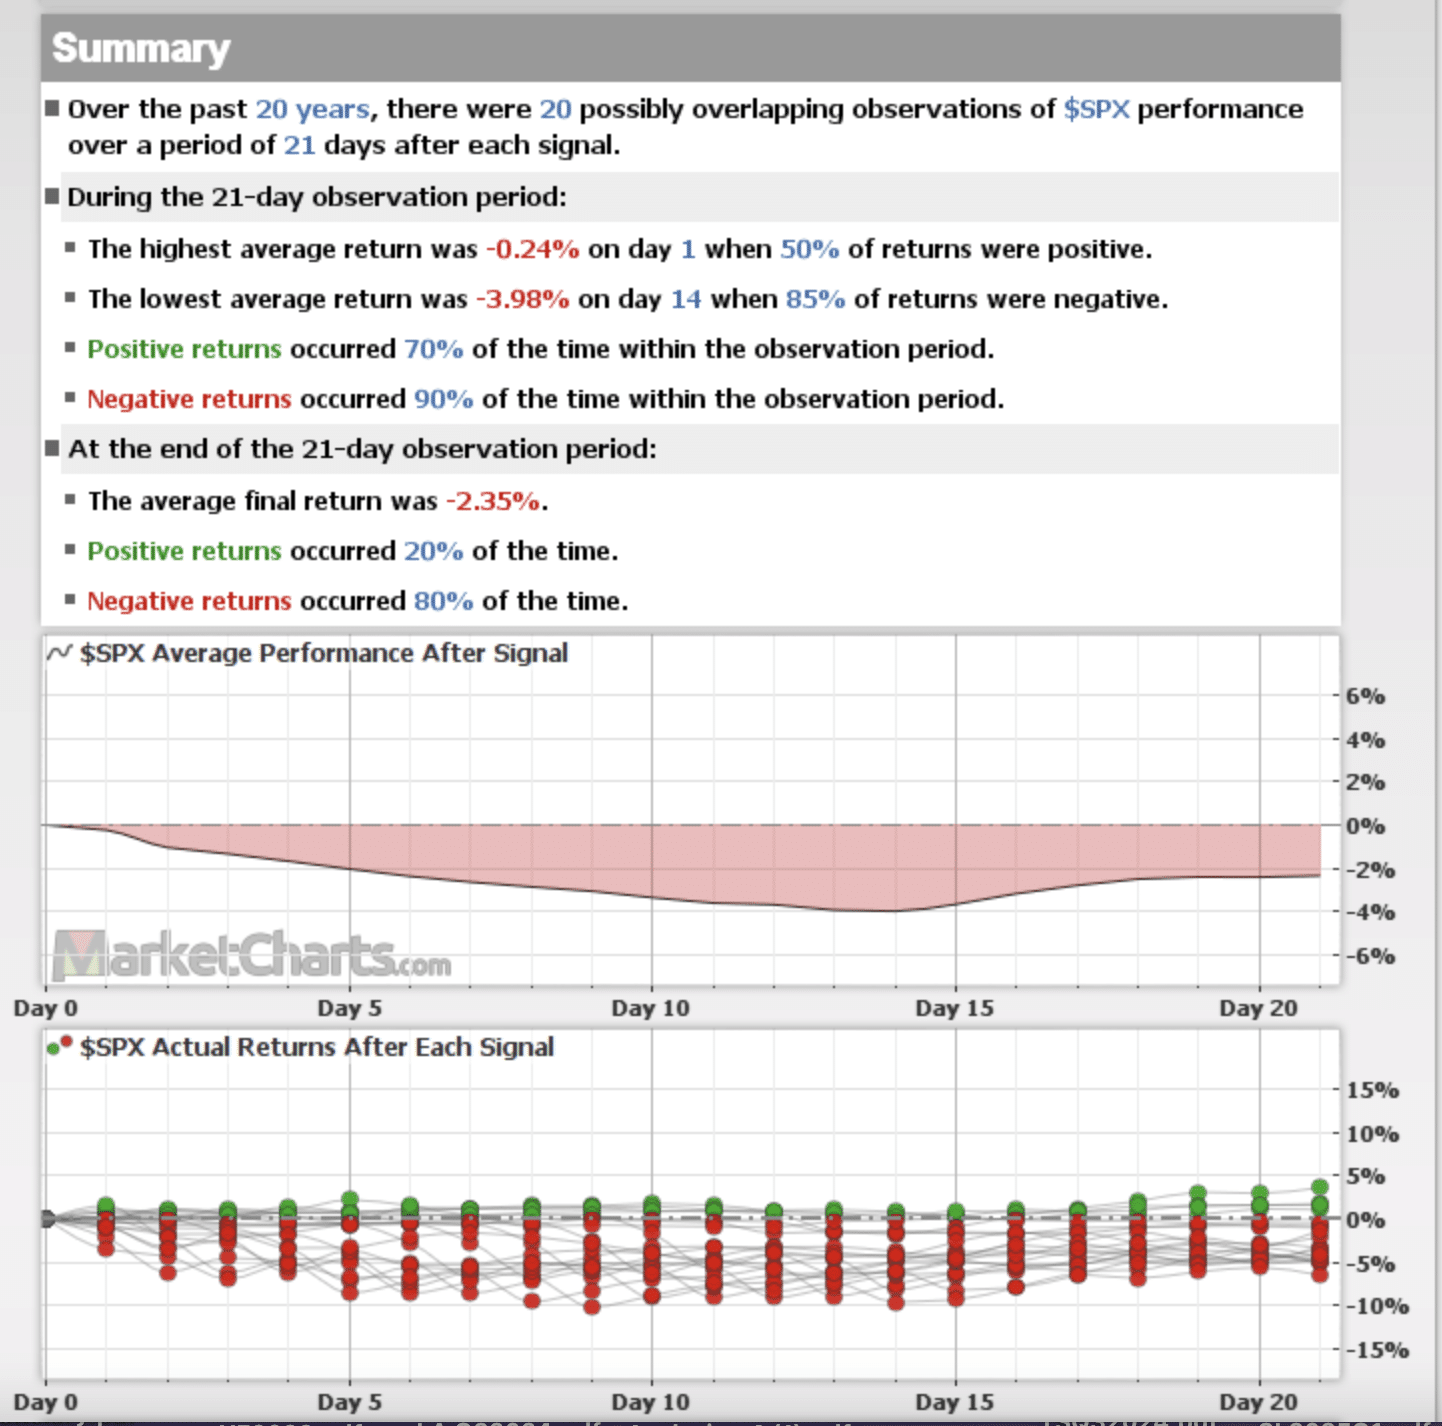
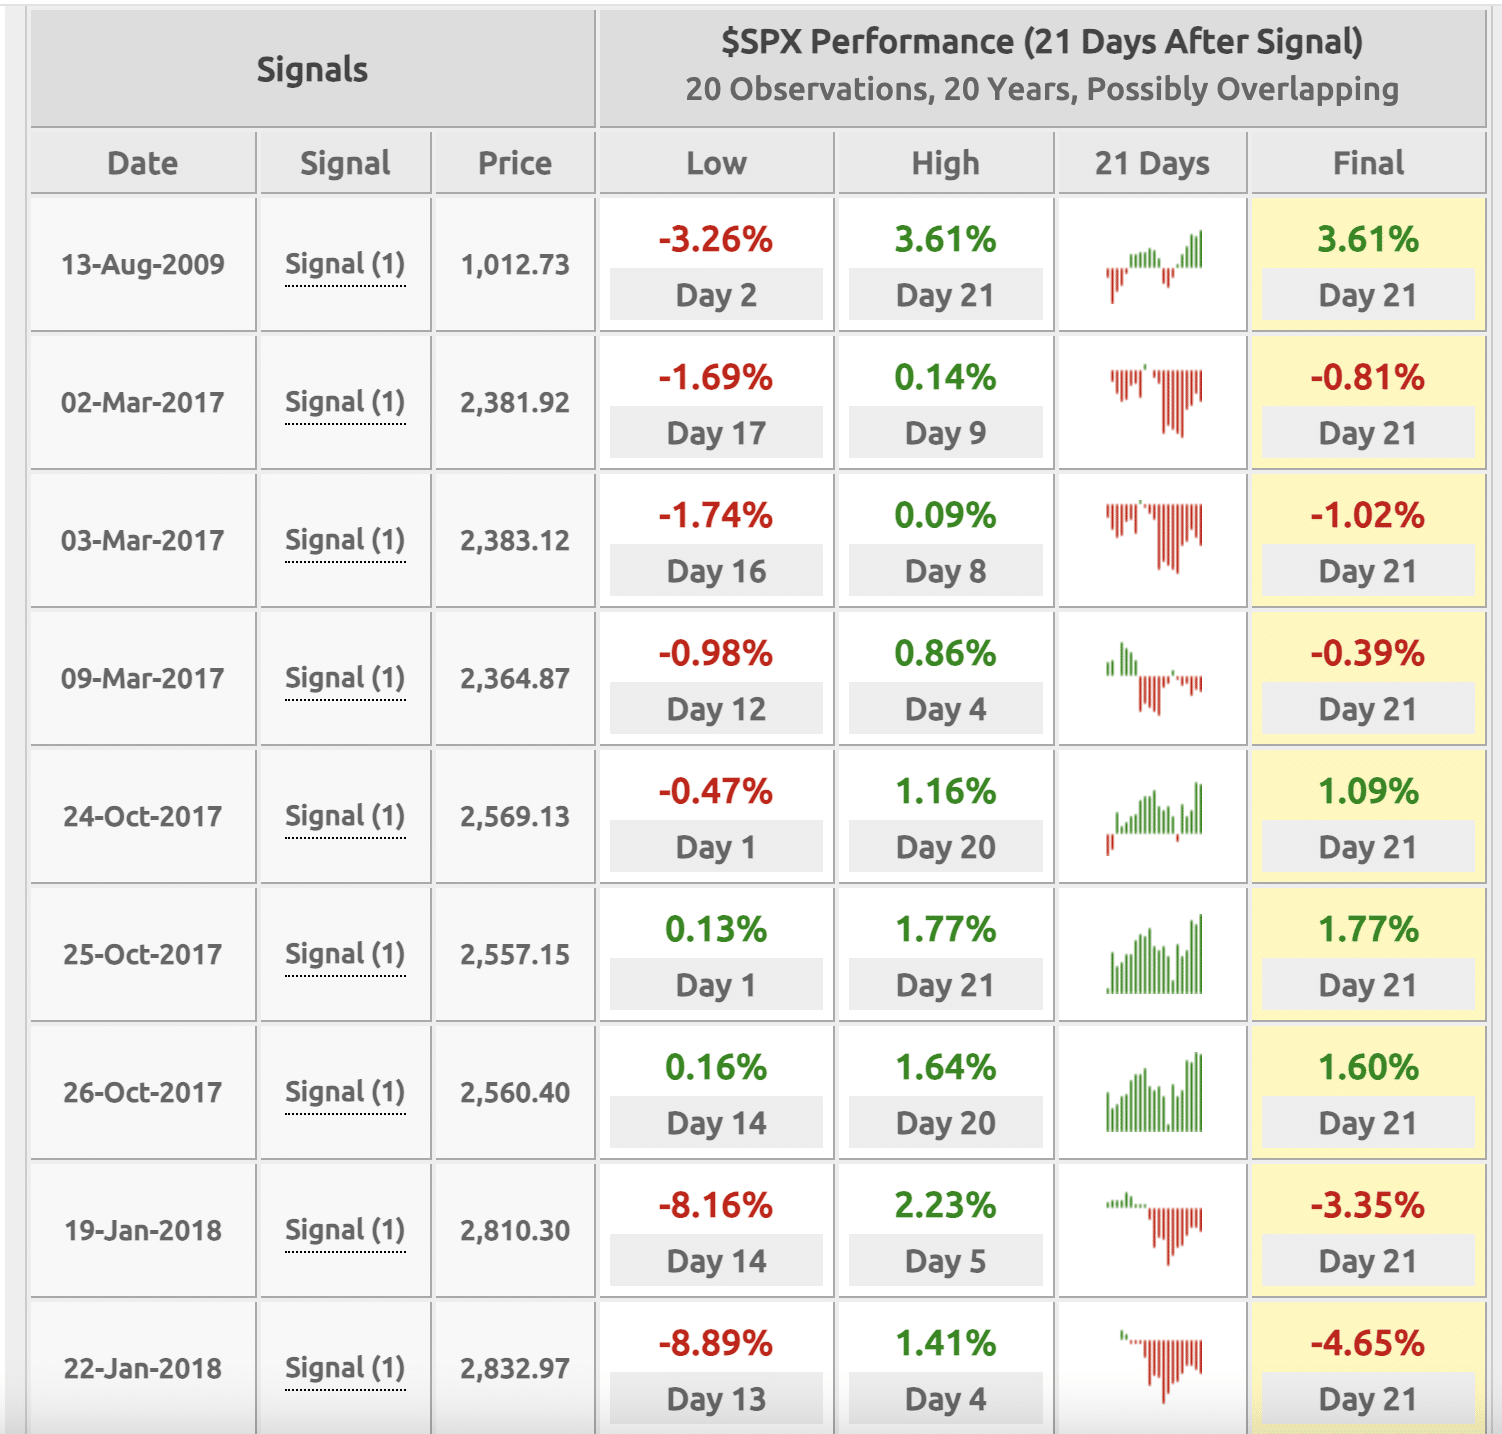
The normal inverse relationship between the SPX and VIX has sharply flipped over the past month. The currently strong positive correlation has historically been seen before a period of negative average returns. Since 2009 there have been 20 occurrences. Of the 20 occurrences, the S&P 500 was only higher 4 times over the forward 21-day (1-trading month) period. The only positive 1-month returns came in calendar year 2017, when the S&P 500 failed to achieve a 3% drawdown the entire year. Sound familiar?
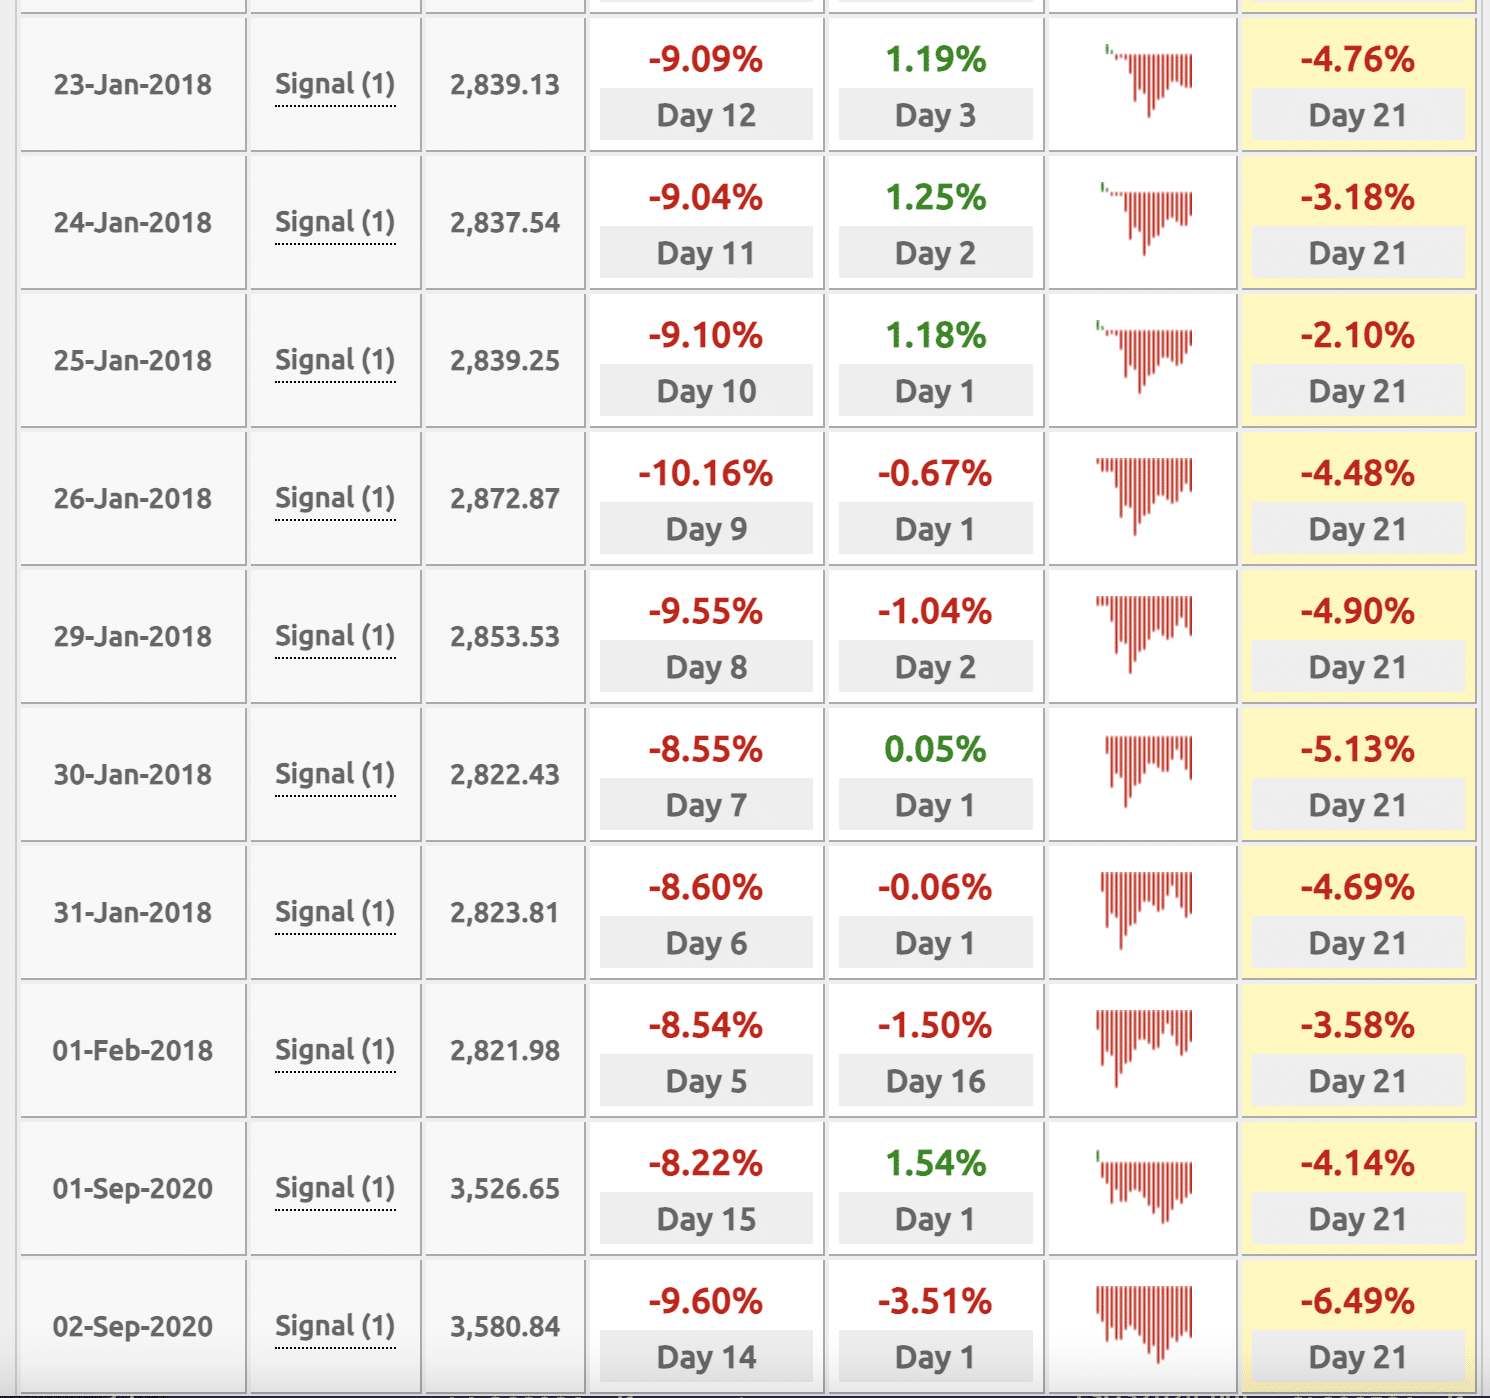
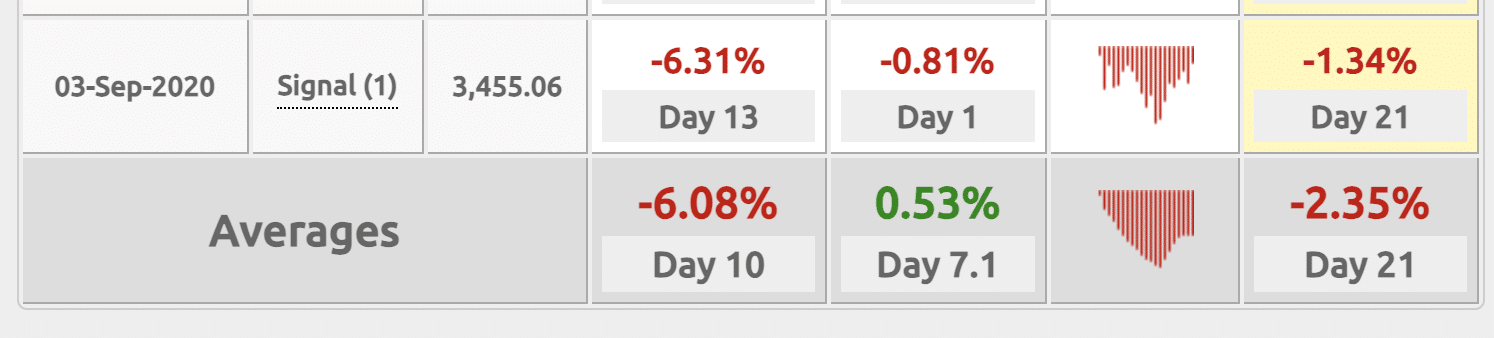
I recall 2017’s price action quite vividly, and how it helped to form the Volmageddon event of February 2018. When markets don’t have normal and expected pullbacks of 3-5% there can develop price dislocation conditions. Nasdaq Composite has now gone 115 straight days without a 3% pullback from its all time high. The longest streak in over 7 years. For comparison, the index has averaged a 3% correction every 20 days. The AI trade is quite dominant and proving a dislocation of positioning.
Stylistic positioning/trades can become overcrowded and or overextended, resulting in “payback”. The “when” aspect is the only thing in question, as the dislocation is always resolved to the downside and with an unwinding of such positioning/trades. The more recent streaks from 2021 and 2024 found payback in 2022 and 2025. Again, be aware, not beware. You can’t prevent eventuality, but you can profit from the trend.

Another way to view the price trend for the year is offered in the above study from Ned Davis Research. In years when the S&P 500 endured a 10% correction and ended Q3 up at least 10% YTD, in Q4 the index was up every time by a median of +7.5%. Past performance, as they say is no guarantee of future results, but positive reversals have a bullish probability which savvy investors/traders lean.
The awesome aspect of the Ned Davis Research quant above is that it can offer investors insight into the magnitude of potential gains above the September 30th closing value of 6,688. When we look at each occurrence in the quant, the final column offers the Q4 total return/gain. The worst gain ever and during the Q4 period was in 1933. Now we all know there was no such thing as the S&P 500 in 1933 or prior to 1957. So when we take this into consideration and even if we choose to use the gain return from 1933, the worst return the benchmark index ever delivered was 2.8%.
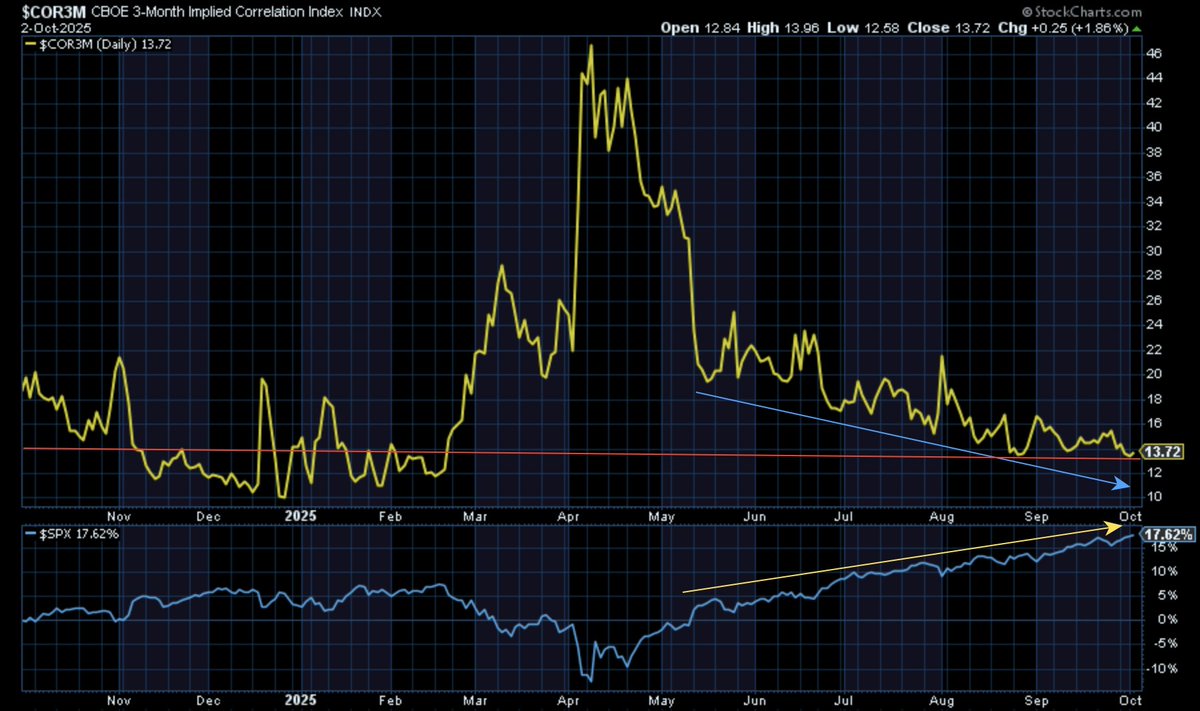
The 3-month implied correlations measure has been ~1:1 trend with the S&P 500 price trend, the absolute best sentiment indicator of 2025. Last week, it proved lower than at any time in October of 2024, and had only been lower from November 2024 to February 2025’s S&P 500 peak.
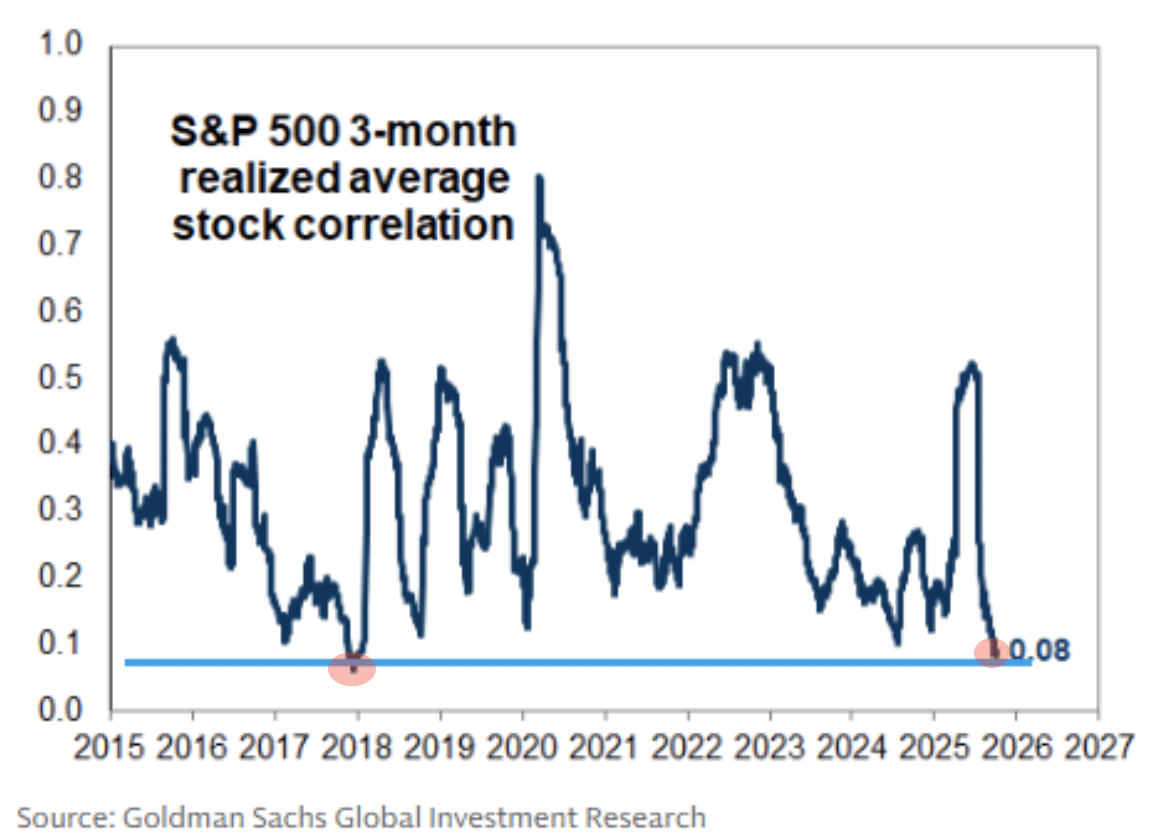
The chart above is a similar chart that recognizes 3-month market correlation, via Goldman Sachs. Realized Volatility stock market correlation is at the lowest level since late 2017. Again, it basically emphasizes a lack of dispersion as it pertains to investor/trader buying. Very little goes down and stays down, while investors continue to buy and without much discernment. The last time this occurred into 2018, the S&P 500 would eventually correct -13% and volatility would significantly spike. It did take several months to occur, but the conditions, then, were a warning signal to heed. You may have time, but it may be borrowed time. Be aware not beware!
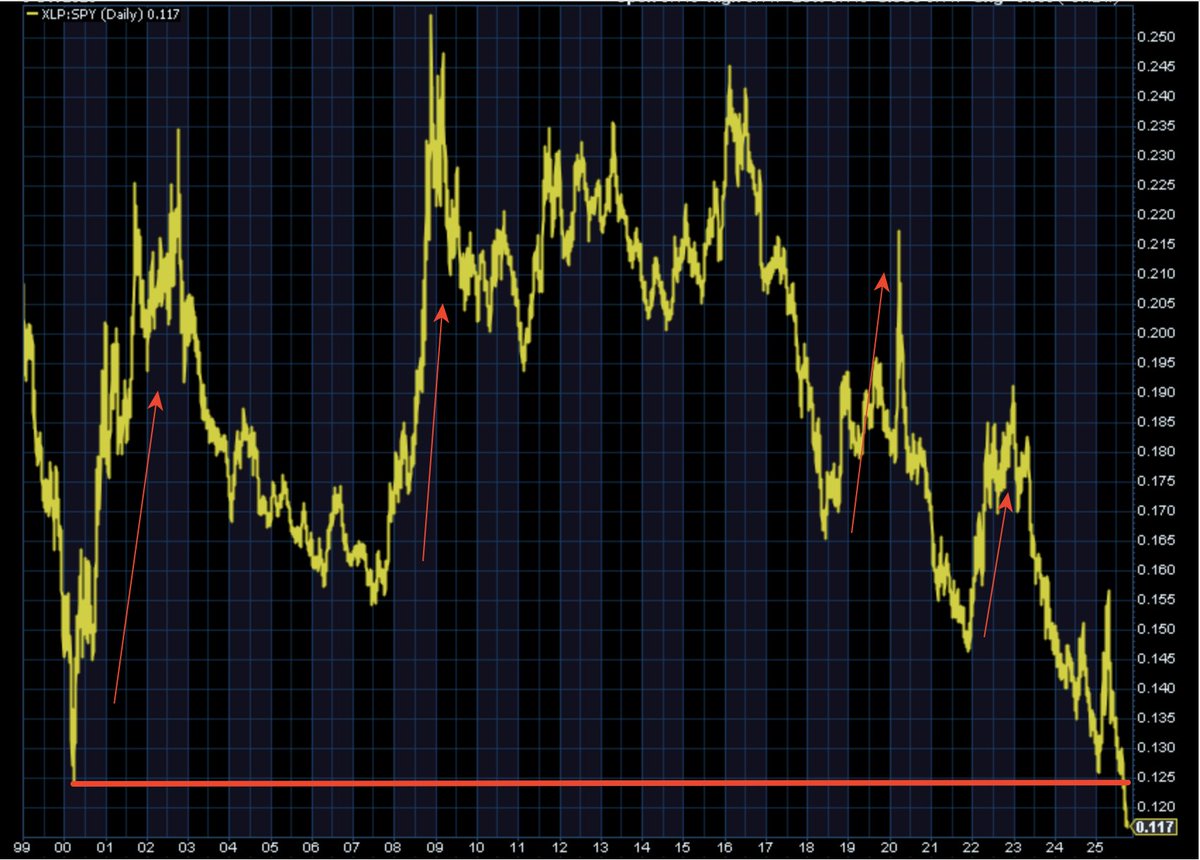
This looks worse than Health Care had been performing relative to the S&P 500, until recently. Are you game-planning for 2026? Staples relative to SPY is at an ALL-TIME LOW and with a 3std. trailing 18-month performance. All but 1 time this occurred in the history of the performance ratio, XLP has gone on to materially outperform the S&P 500 in the forward 12-month period. If this comes to fruition, it is likely at the expense of the Magnificent-7, Growth, and the Large Cap S&P 500, Nasdaq Composite, and the Nasdaq 100.
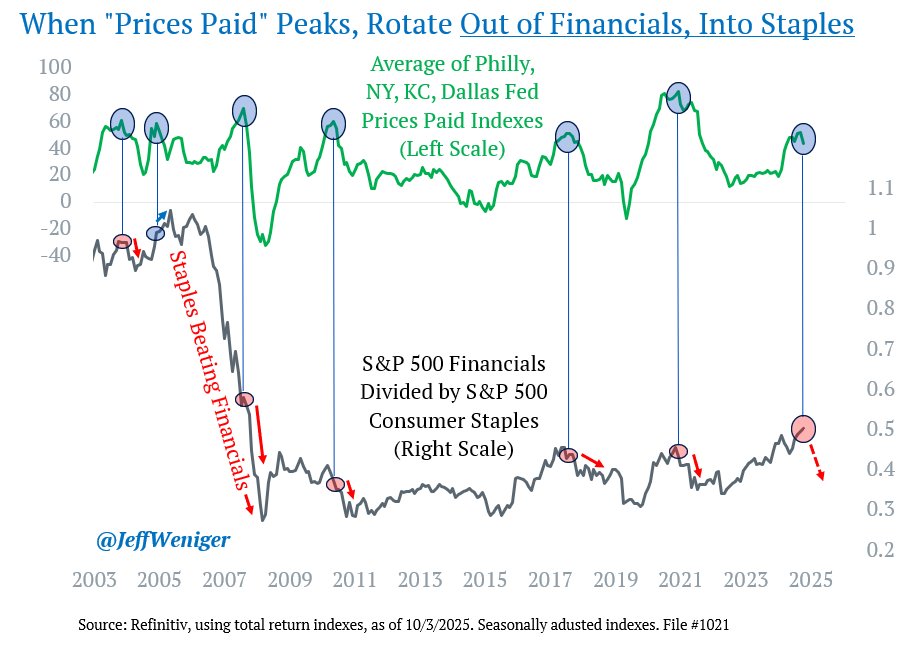
The chart above from Jeff Weniger of Wisdom Tree also says rotate out of Financials, into Consumer Staples. When “Prices Paid” peaks in the Philly, NY, KC and Dallas Fed surveys, Financials (banks, insurance, etc.) start losing to Staples (candy bars, diapers, and so on).
Direct quote from Finom Group’s “Q4 Proposed Positive″ Report (October 5th, 2025)
A Timely Finom Group Reminder From Inside Our March 30, 2025 Research Report
“We may have arrived at a point where investors/traders are asked to invoke the “willingness clause” of investing. The willingness clause asks investors to benefit from the ignorant, while accepting an interim and possibly large portfolio drawdown. The willingness clause knows it is only through this exercise that the savvy investor achieves every tick to the upside, when the upside renews… AND IT IS ALWAYS RENEWED, but when is the only question and hence the willingness clause is invoked.
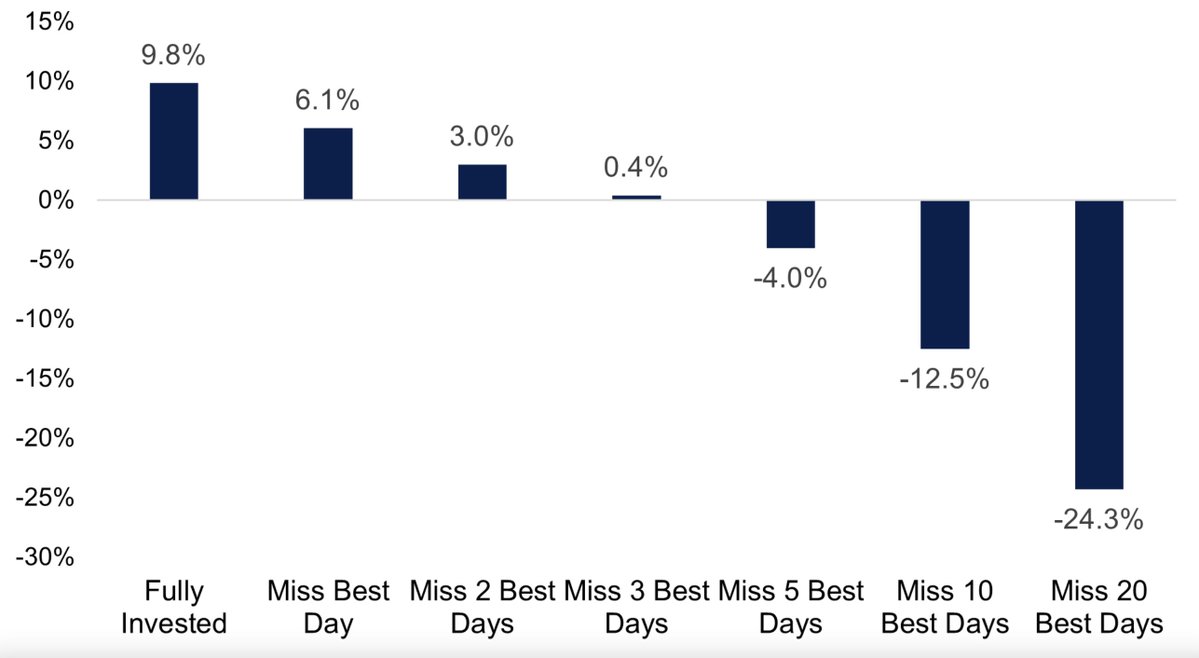
While the masses are exiting in an effort to avoid bigger drawdowns, they are forgoing the reality of the long-term gains that are achieved by simply sticking with the markets. Missing out on the best 10 and 20 days of the calendar year WILL, in all “absolutivity”, result in lesser returns. It’s as sure as death and taxes, as the saying goes.
The solace for the savvy bulls who choose to ride out the storm is that they are guaranteed the not just the greater returns, but all of the returns the market has to offer during the renewed uptrend. There is nothing heretical about these facts. They are as they have always been, facts!
The idea of the willingness clause and benefiting from the ignorant asks and informs savvy investors to continue allocating or re-leveraging cash into the market and as prices get cheaper or more attractive. Inside of the Golden Capital Portfolio, this is where we are executing our FY2025 game plan to reallocate capital and recapture exposures with the 60%+ cash holdings we previously built (by locking in profits) during the Q4 2024 period. The cash building process in Q4 2024 was a disciplined approach to addressing the limitations we envisioned for returns in 2025. Executing the willingness clause in 2025 is no less a discipline. Our plan is to build bigger positions in short-VOL through the entirety of the markets’ correction, little by little… by little. In addition, key long-term holdings in PANW, SHOP, QQQ, and recently AMZY are desired increased holdings during the correction.
Growth stocks, sectors and industries are out of favor; defense and Energy have been leaders, which in and of itself is an indicator of a weak market that may not improve in the near-term, as indicated in the charts/tables below from 3Fourteen Research:
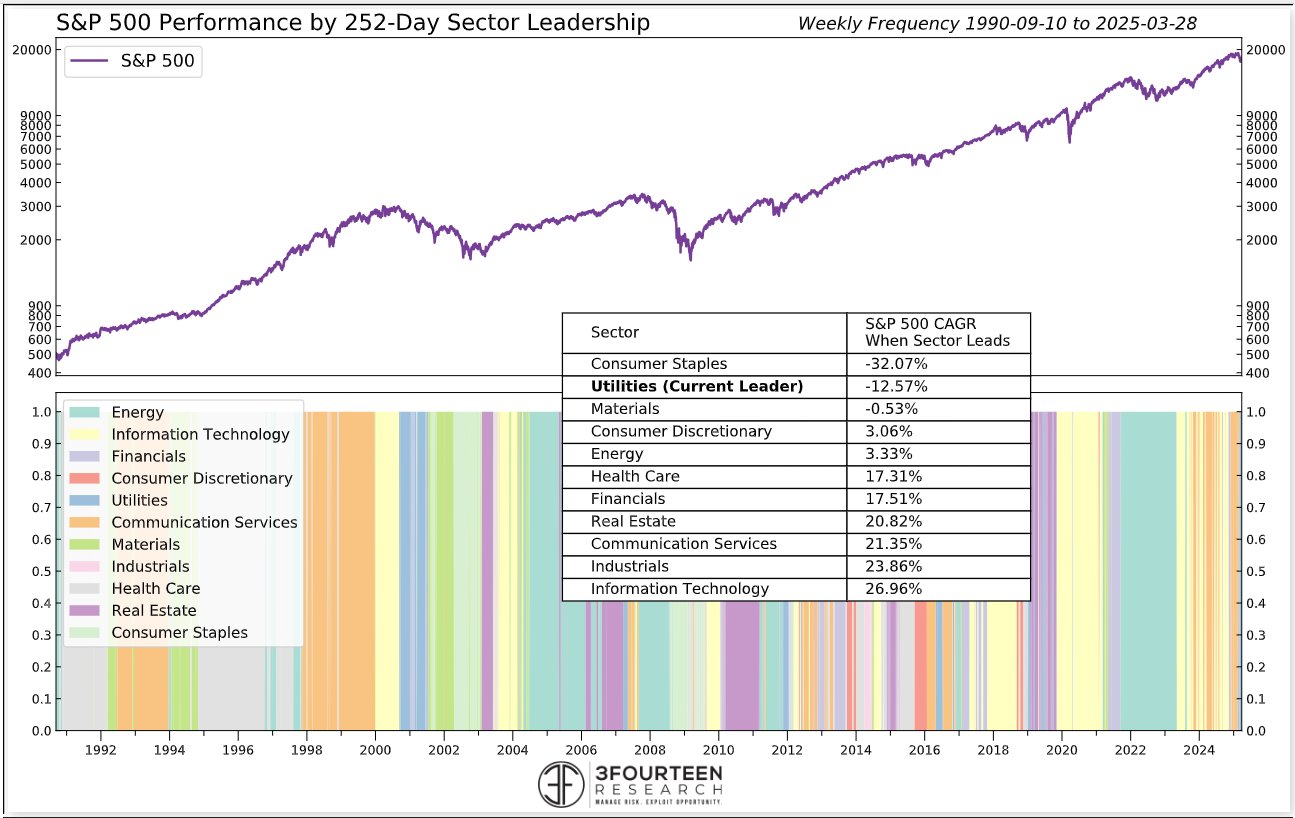
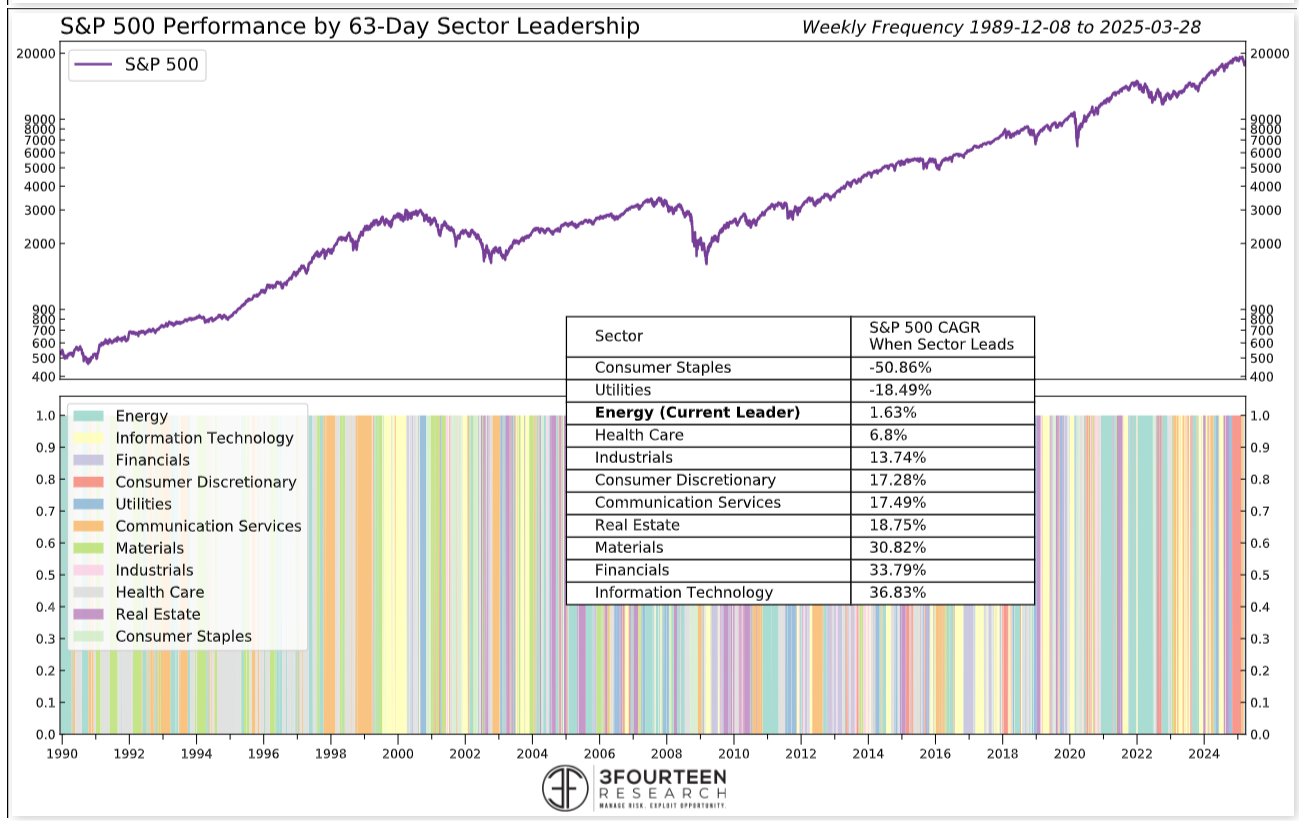
While it may prove easy to suggest reallocating capital into Energy and/or the defensive sectors, even profitable near-term, the problem with this idea/notion is that making such allocation adjustments has historically proven detrimental. Simply think back to 2022, when Energy and defense led the market for roughly 9 months, then trailed the market for more than 2 years. These areas of the market DO NOT compound capital returns at the rate of the market or Growth stocks/sectors, and it’s not even a close call. As such, reallocating to Energy and/or defensive areas of the market demands bad behavior or negating future compounding returns of greater magnitude. Again these are the facts, and again the willingness clause demands accepting the probability of larger drawdowns near-term.
As it pertains to the short-VOL building process within the Golden Capital Portfolio… we’ve been here many a time before and having watched the masses try to time the higher volatility regime with various faulty hedges and or outright long-VOL attempts. There’s a reason why the CBOE informs that most option positions and/or strategies will finish “out of the money”. With that being said, we are completely contented watching other traders engage the long-VOL trade as it could only serve to sustain higher VIX-ETP (Exchange Traded Products like UVXY or VXX) prices we desire to short over time. Benefiting from the ignorance of the masses who engage long-VOL out of fear for additional market declines.
Now recall that part of the Finom Group outlook for 2025 indicated the potential for the Golden Capital Portfolio to accept some underperformance in the 1H 2025 period, and with the potential to outperform thereafter. While this may sound an odd outlook, we have been here before, and accepting the willingness clause has always led the Golden Capital Portfolio toward outperformance.
October 5, 2025: So, how’d we do? Did Growth make a comeback or is defense and Energy still leading? We all know the answers to those questions Short term pain in 1H 2025, long-term gains have been realized since!
Direct quote from Finom Group’s “Q4 Proposed Positive″ Report (October 5th, 2025)
Last, but certainly not least, more quant confirmation concerning the probable Q4, S&P 500 performance outcome. September was uncharacteristically strong, but so was the historically worst period to own stocks (May – October). During the worst 6-month return period of the calendar year, the S&P 500 return was greater than 5%. Good things tend to continue for investors in the Q4 period when this occurs! As shown in the Trader’s Almanac table/study below…
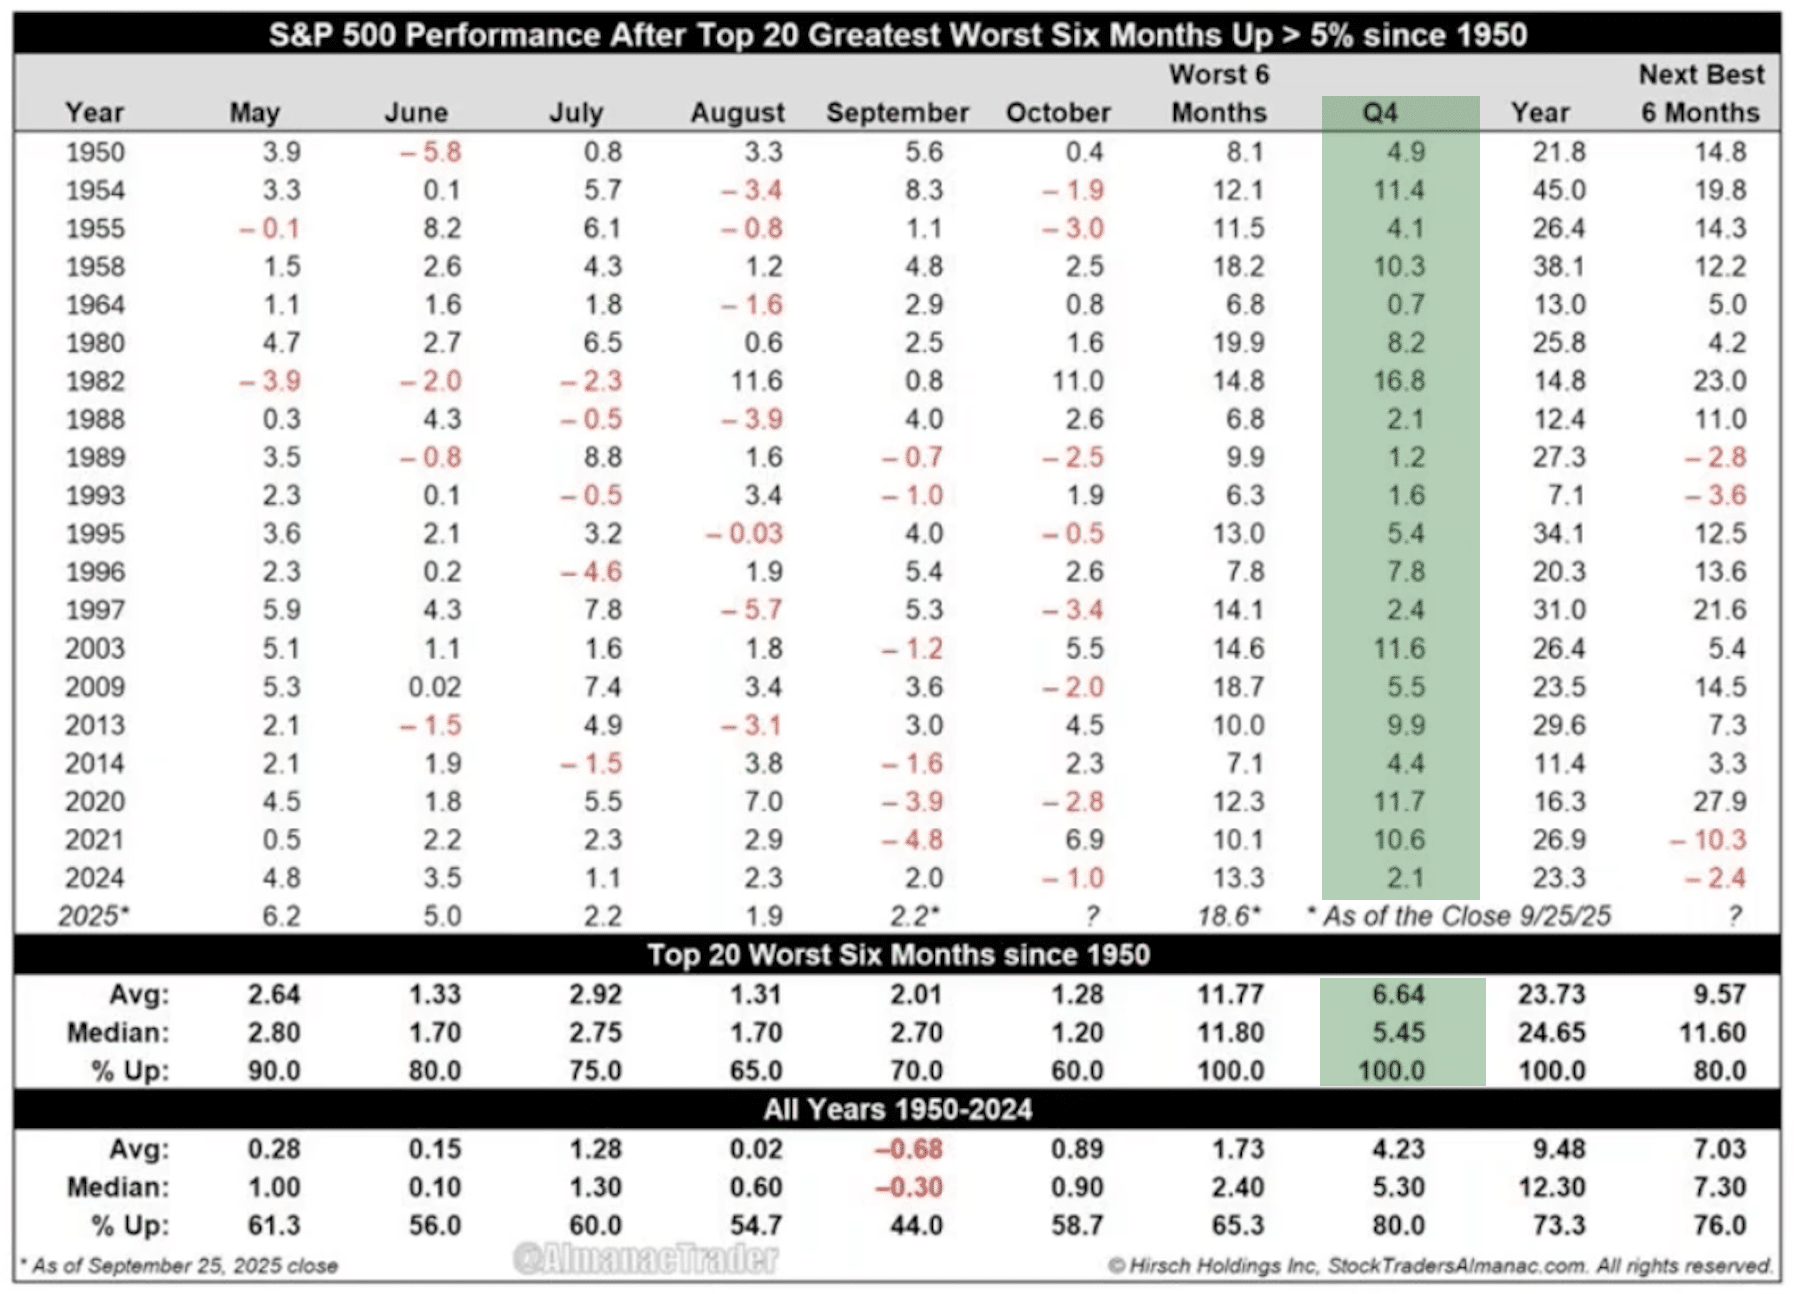
…when the S&P 500 has gained +5% or greater during the worst 6-month return period of the year, the S&P 500 has delivered a positive return every single time in the Q4 period and continued with positive returns more often than not in the following 6-month period.
Direct quote from Finom Group’s “A Long 2025 Macro-Market Race Nears The Finish Line″ Report (October 12th, 2025)
And now let’s go “old school”, we’re talking about a quant from October 2024. Okay, not so old school, but you get the point! 2025 has had a similar price performance trend to 2024 year-to-date. Tremendous trailing 6-month gains from month-end October. I know what you’re thinking: the month isn’t even over. Hear 🦻 me out, with the following quant study from October of 2024:
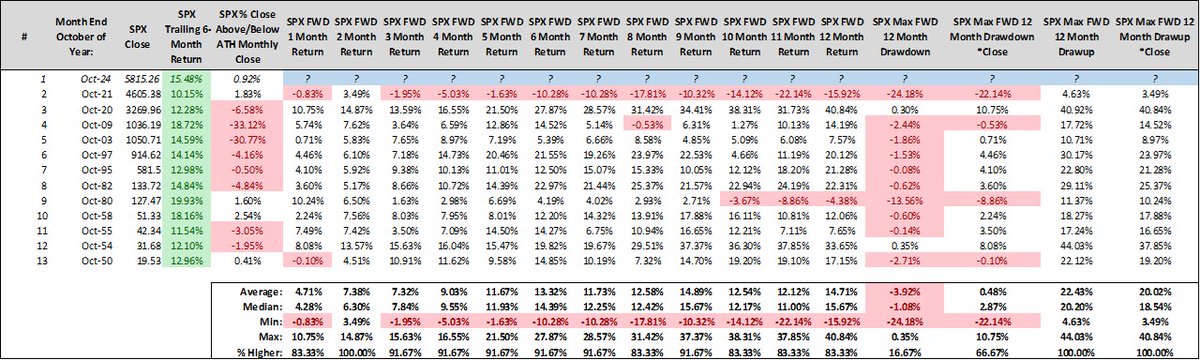
When the S&P 500 ends the month of October with trailing 6-month returns of 10% or more, the remaining 2 months of the year have never closed lower(i.e., December’s monthly close was never below October’s monthly close). If I were to update this study, which I have below, it would look like the perfect 2-month forward track record played out in 2024 and to end the calendar year:
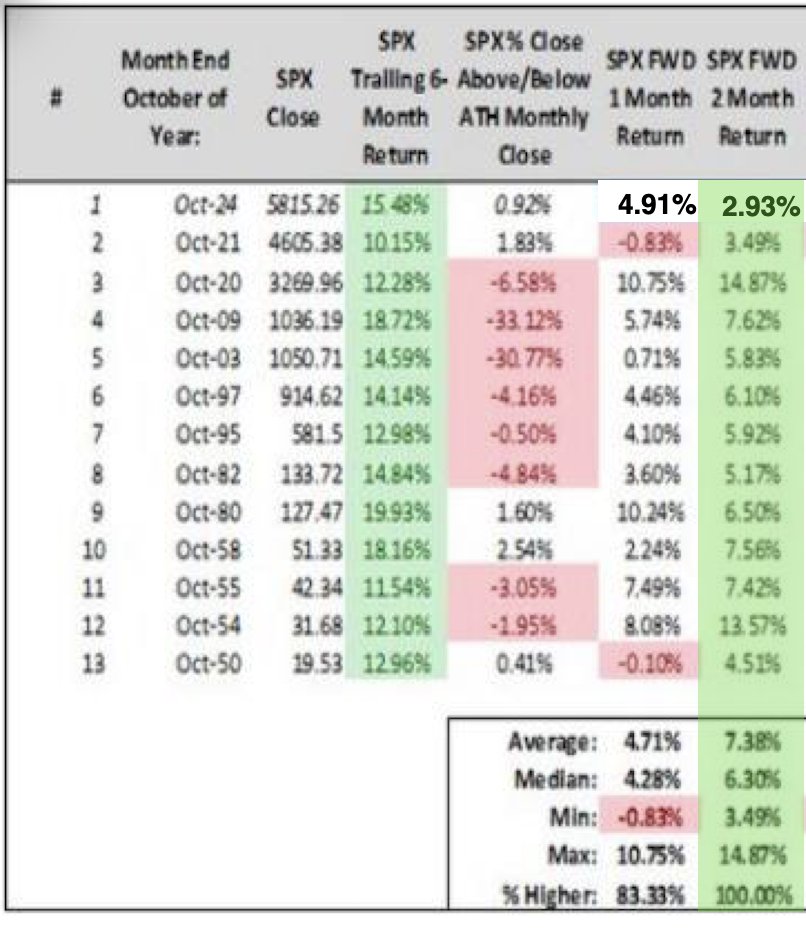
The S&P 500 was up 35% since the April low and to its most recent peak. At the end of October, SPX will have a trailing 6-month return greater than 10% (current 6-month trailing gain of +24%. Do you think we’ll fall -14% from here to disqualify the quant?). EVERY. SINGLE. TIME. higher over next 2 months (year-end) w/median return of +6%. The 3, 4, and 5-month forward periods, SPX is higher 93% of the time, including last year.
It can prove the easiest of exercises and fall into recalling all of the bearish commentary associated with the 5-month S&P 500 win streak and Nasdaq 100 (NDX) 6-month win streak, but streaks like this usually continue. As such, focus on the data at-hand and don’t allow Friday’s drawdown to void the factual probabilities within the data:
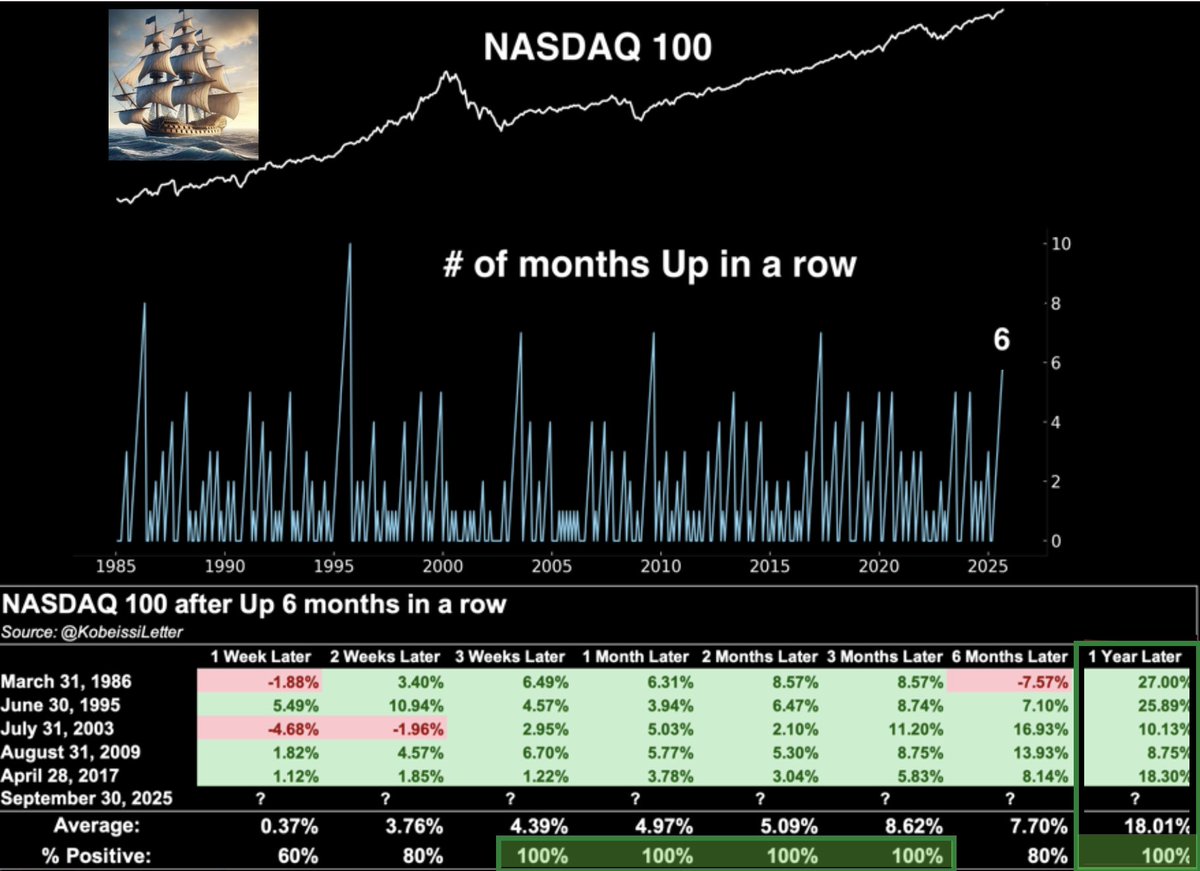
Nasdaq 100 is positive 6 months in a row. This has only occurred 5 previous times.
1-month later higher every time
2-months later higher every time
3-months later higher every time
12-months later higher every time
You get the picture, or maybe you need to know what that picture looks like from the end of September to Friday’s close, and how much room there could be to stay perfect for the Nasdaq 100?
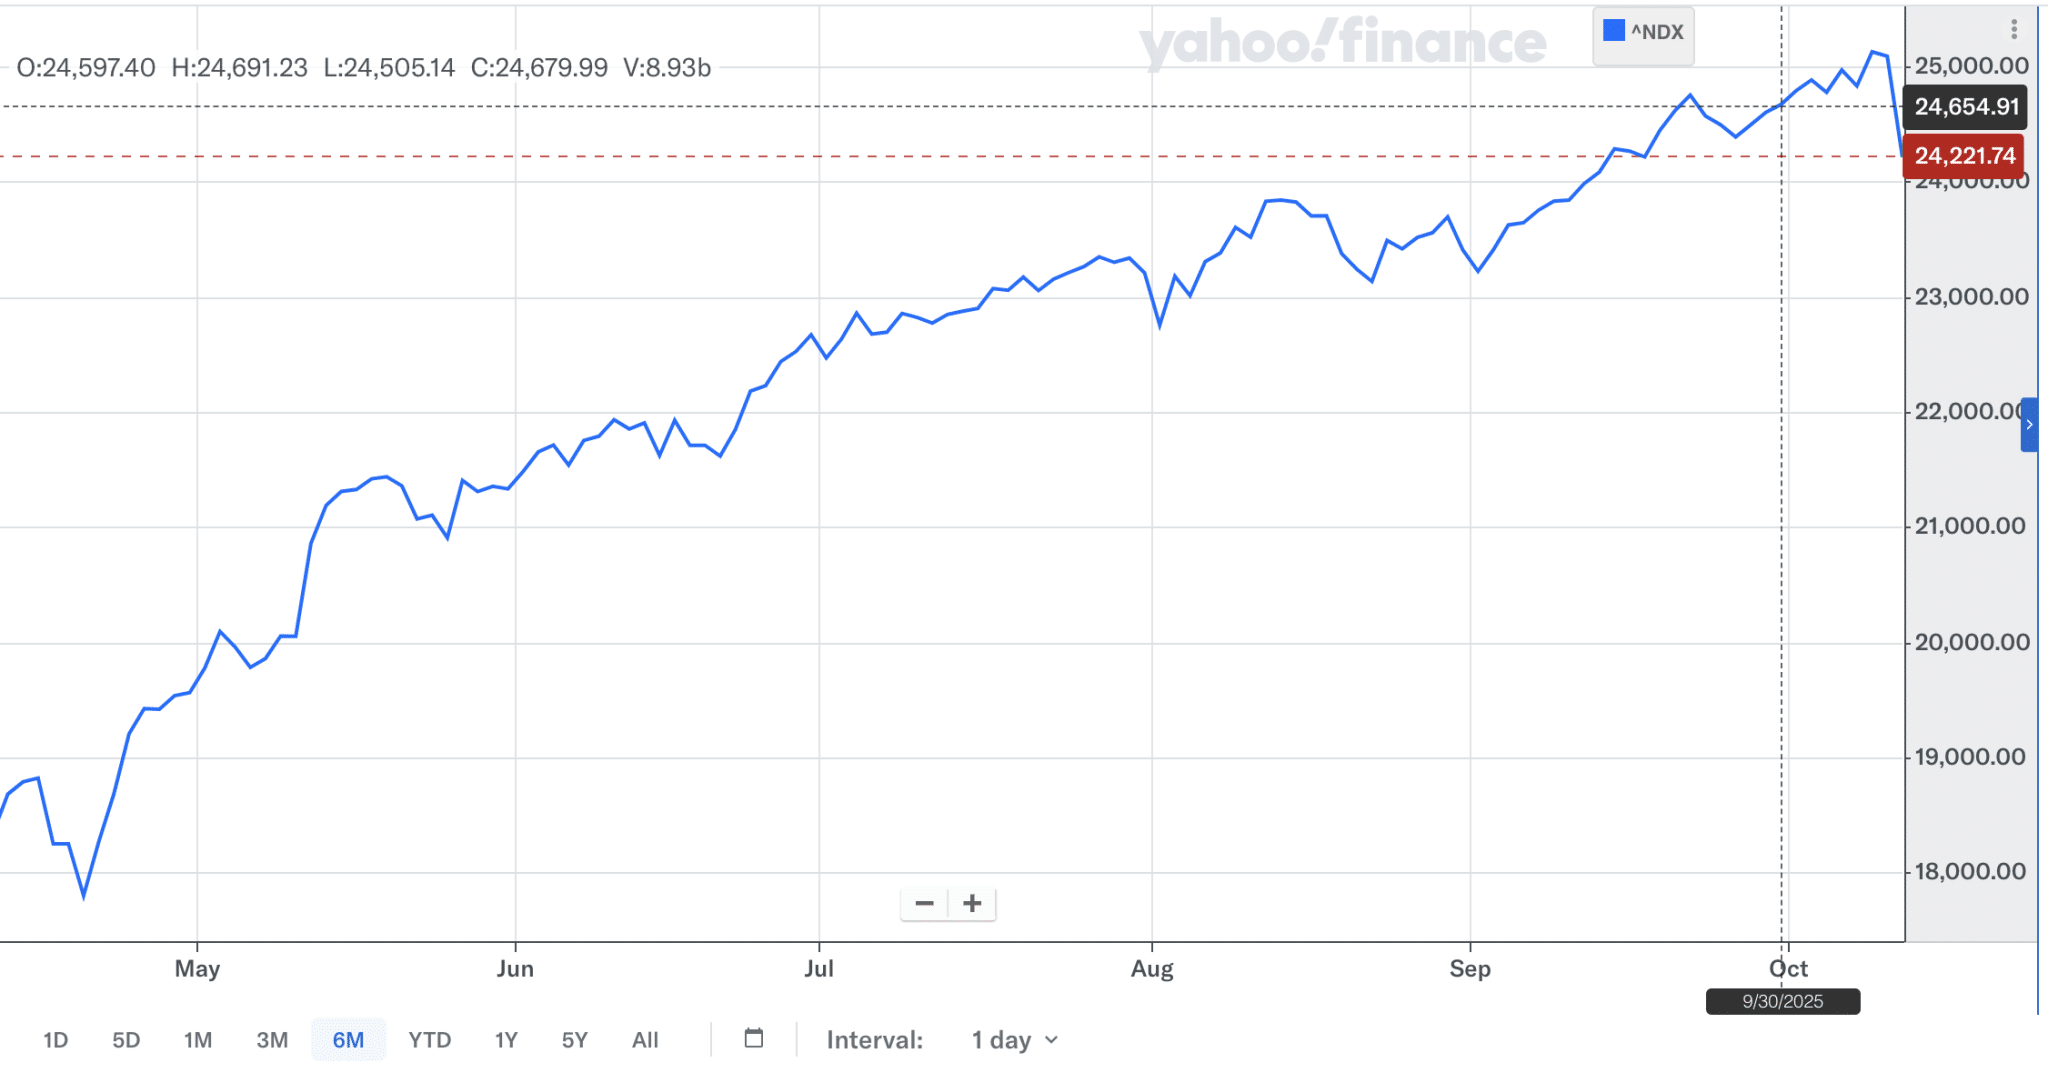
Well, that’s greater than 400 points for the Nasdaq to potentially reward savvy investors/traders who have leaned into the higher probabilities and exercised a game plan that includes buying the pullback! On a side note, I’m of the opinion the 400 points becomes greater in the coming week/s, but that lends greater compounding returns over time.
As it pertains to the Nasdaq Composite Index, a similar story is being told when we review the 6-month trailing trend achievement in price, and as outlined in the Nautilus Research quant study below:
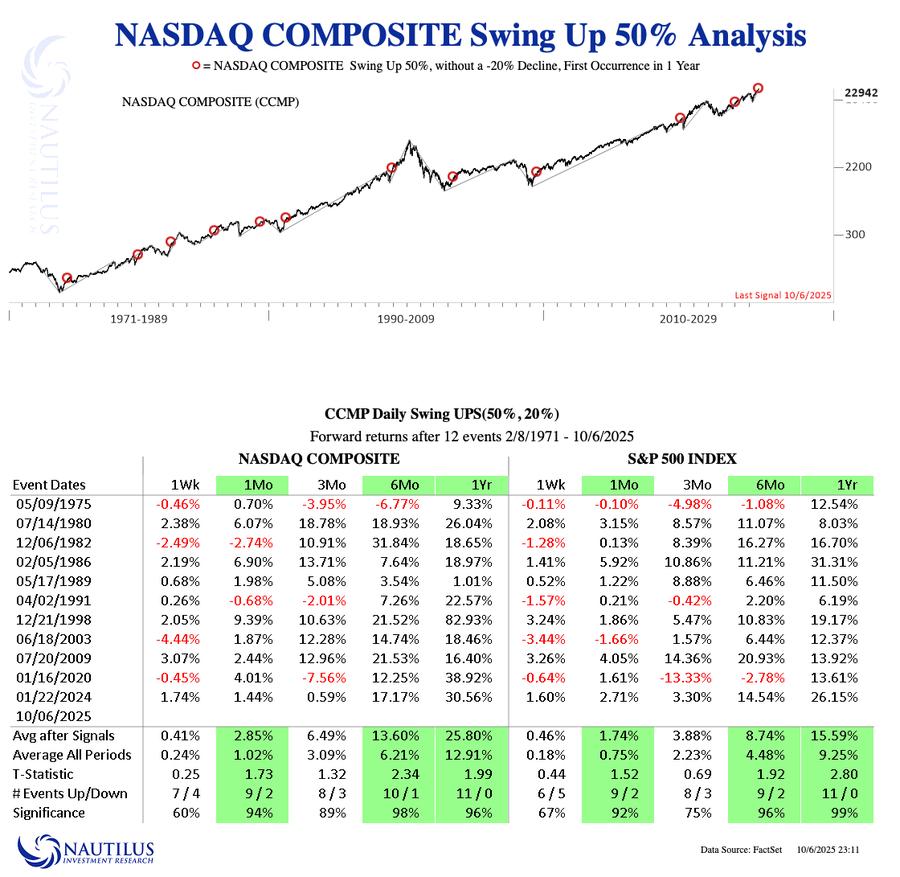
If there wasn’t enough quant evidence and predictive value pointing to a pullback in previous weeks, then there isn’t going to be enough evidence to suggest you should be buying this pullback and any greater pullback that may still yet unfold in the coming week/s. I was convicted in the belief that a greater pullback and buying opportunity would materialize. The complacency, lack of dispersion, and consistency for which both VIX and SPX were rising together pointed to an eventual trend disruption, even if only momentary. I would be of the opinion additional downside is in store, but how much I could not predict nor do I care, given the quant probabilities outlined and Earnings Growth underpinning of the markets. Again, not the frankness of speech you hear in the financial media, but purposeful nonetheless.
Direct quote from Finom Group’s “A Long 2025 Macro-Market Race Nears The Finish Line″ Report (October 12th, 2025)
It’s a matter of knowing 2 things when it comes to quantitative analysis 1) Quants outline probabilities, not guarantees 2) always leave room for disappointment, that’s your risk management!

Let’s back up the car 🚘 for a second! Recall that S&P 6,501 level from the VIX/SPX quant above? Well, it turns out that we have at least 2 quants previously outlined with the same trigger date/price. Again, the quant analysis below was offered inside the Finom Group September 14, 2025 macro-market Research Report, and it begs of investors to behavior appropriately during the current market pullback:
“There are those whom believe the markets have come too far too fast, and the already lacking of a more significant pullback is a calling-card for a market crash. We have no data to support such considerations, and recognize that with the S&P 500 gaining some +25% in the last 100 days it has never delivered a negative return 3-months forward… NEVER
.

While the macro-economic landscape can find narratives that are both bullish and bearish, the quantitative and technical analytics deliver the same bullish message to investors/traders.”
With a 3-month forward positivity rate of 100%, what else does the savvy investor need, other than cash to deploy between now and November 28, which will also coincide with “Black Friday”. Should the S&P 500 drop below 6,501 between now and November 28th, we think this quant speaks to how investors should engage such discounts! And any price from that November 28th value, whatever it should be if above 6,501, is likely to continue trending higher through year-end according to the Wayne Whaley quant revisited below:
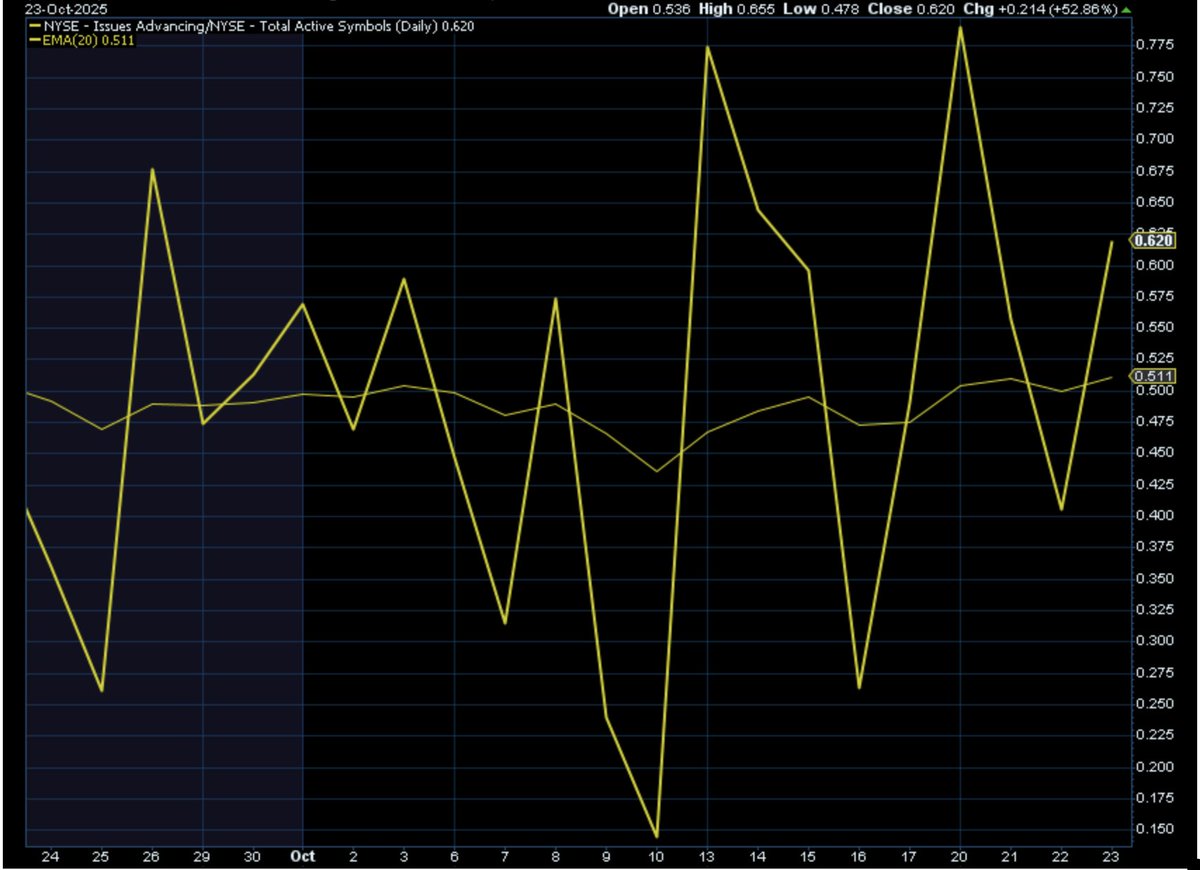
Is there good news regarding the near-term? Everybody has their own definition as to what defines “near-term”. Having said that, the NYSE McClellan Oscillator is nearing Savvy Oversold territory, and most every sector ETF is now below its lower Bollinger Band.
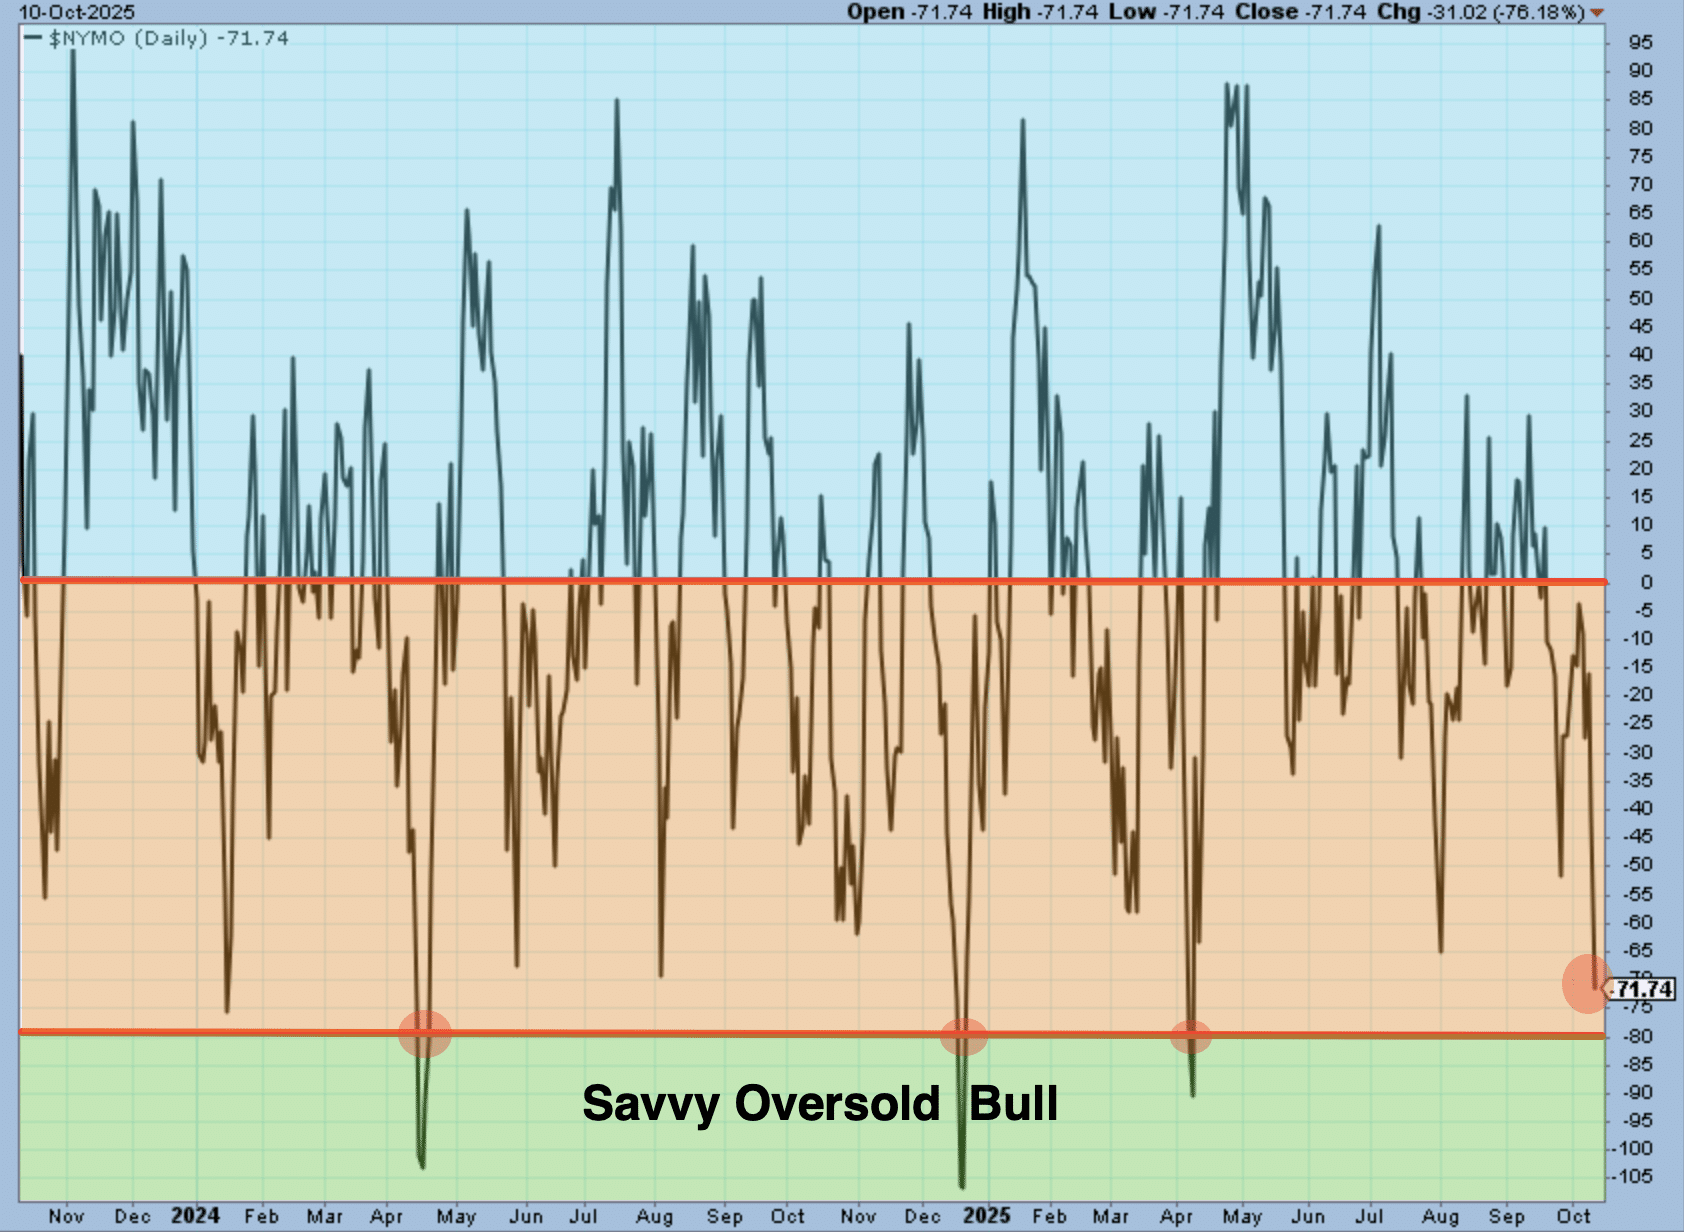
As one can clearly see from the $NYMO chart above, during bull markets, when $NYMO achieves -80 or greater, this has proven a remarkable buying opportunity for investors, with positive forward 3 and 6 months forward gains every time. The $NYMO could very easily get down to this Savvy Oversold Bull level early this coming week. Yes, in April when it got down there the headlines were TERRIBLE. Did that matter to Mr. Market or did markets bottom and trend higher across all indices and eventually deliver a Zweig Breadth Thrust in late April? Kind of a rhetorical question, right? Remember, it’s about looking at the right charts at the right time, and when we pair this chart with all the quant data that informs of a positive 4th quarter 2025 return, the puzzle pieces fit. There does not need to be a double-digit drawdown to evoke oversold conditions. Oversold is not determined or defined by the distance from the former highs. In other words, it’s not always about a level, but rather a condition.
Direct quote from Finom Group’s “A Long 2025 Macro-Market Race Nears The Finish Line″ Report (October 12th, 2025)
The Put/Call Ratio fell to its lowest level since May, this past Friday (.45). After such a protracted melt-up, one may not have thought to see such a low Put/Call Ratio, but that’s how exuberant price action has been. Either way, this level has also proven a leading indicator of a future market pullback (chart below). To what degree the market pulls back is always different, but a pullback indeed has been the message from such a low level.
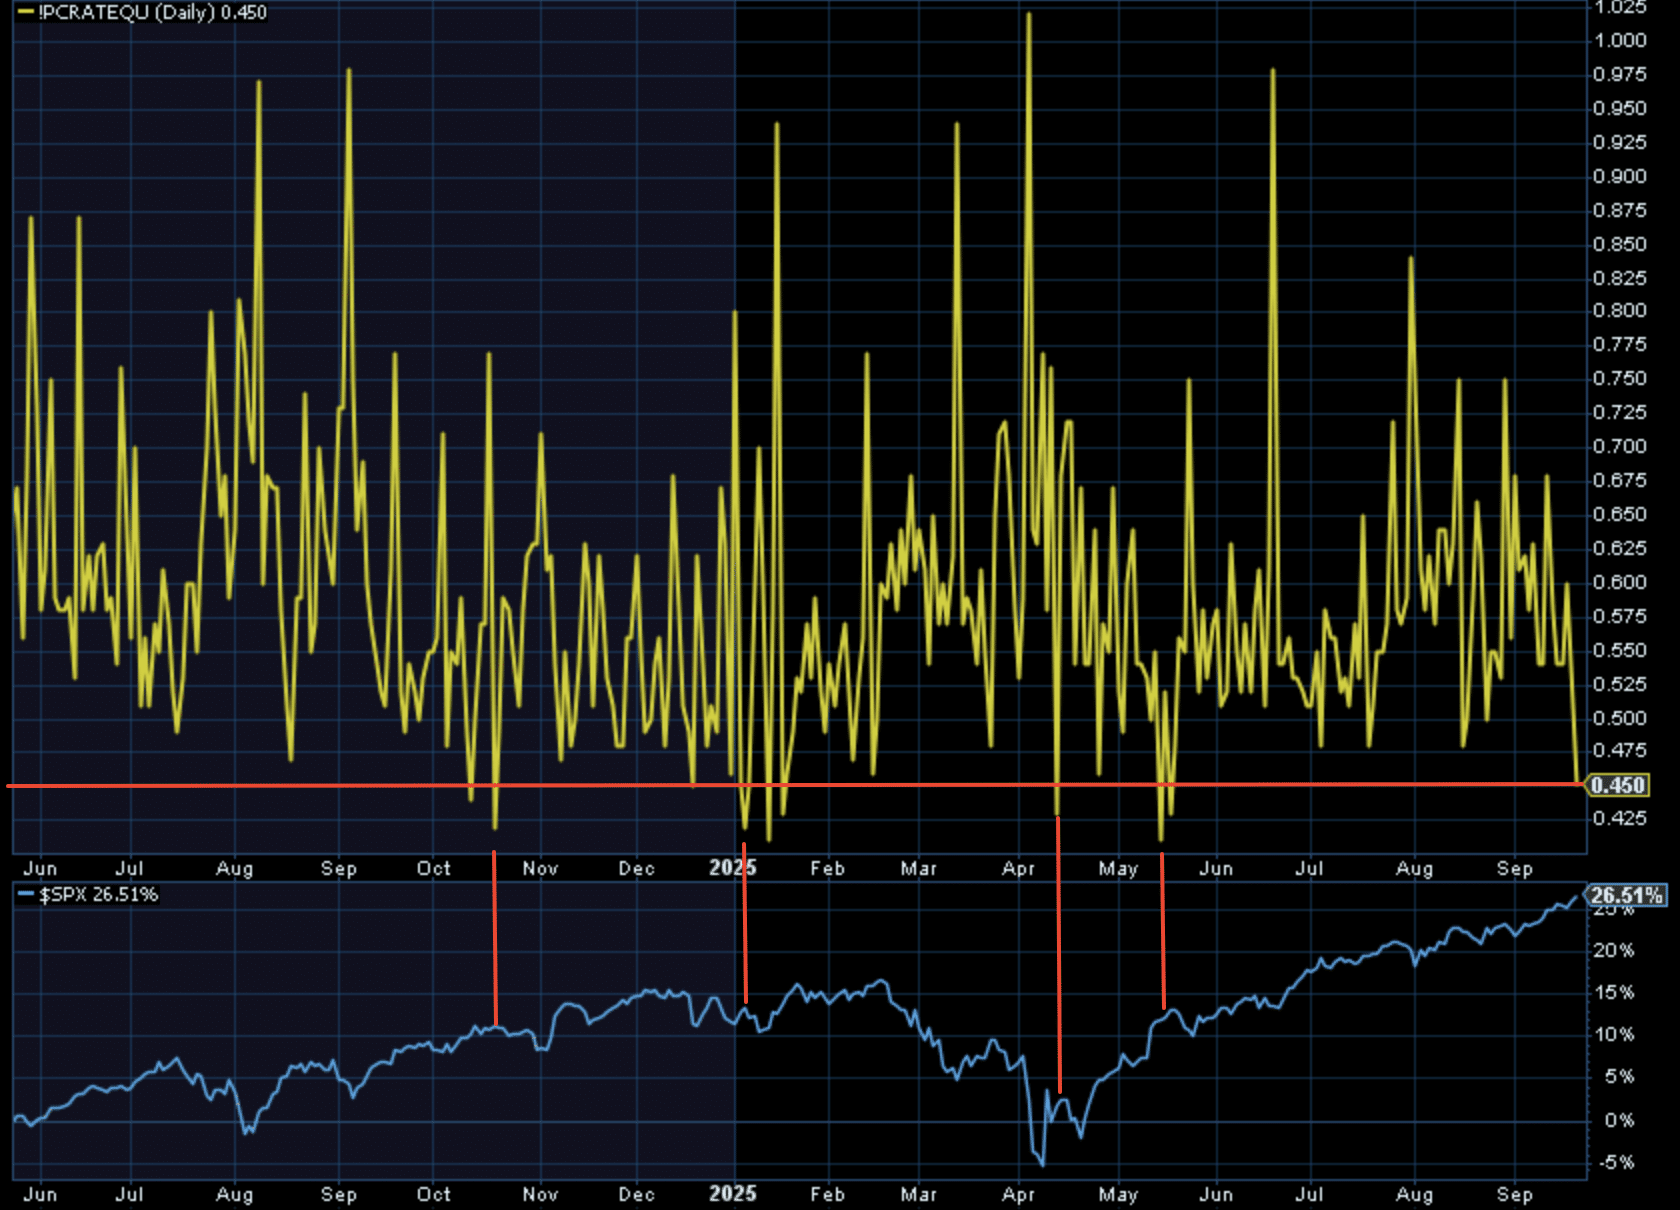
This is not to suggest the Put/Call Ratio is “causal”, but conditional for markets that have in the past consolidated price near-term.
The Equity Only Put/Call Ratio once again achieved .45 intra-week, this past week. That appears to have been the last “conditional” straw for markets, which were catalyzed to pullback by the President’s outlining of 100% additional tariffs on Chinese goods starting November 1, 2025.

I’ll remind you that you should have seen this coming, even if not with precision! Human behavior is pretty predictable if we choose to pay attention, and that behavior creates the quants! The market doesn’t respect your emotions. It rewards your discipline. Most men/women break discipline when volatility shows up. The smart money is all about buying cheaper prices, not avoiding drawdowns. Winners get sharper, so head for the poll position and step on the gas! 🏁
Direct quote from Finom Group’s “Macro-Market Pros and Cons in Q4 2025″ Report (October 19th, 2025)
Direct quote from Finom Group’s “Macro-Market Pros and Cons in Q4 2025″ Report (October 19th, 2025)
DNSI & Future S&P 500 Performance
Traditionally, when the DNSI gets as weak as it is today, either the economy is in or is headed for a recession, and assistance from policy officials is soon forthcoming. I suspect monetary policy will likely become more accommodative in the coming months due in part to increasingly bleak economic sentiment. Chart 2 shows how the S&P 500 index has historically performed at various economic sentiment quartiles. Clearly, at least since 1980, there has been a strong inverse relationship between the level of the DNSI and the future one-month average annualized performance of the S&P 500 index.
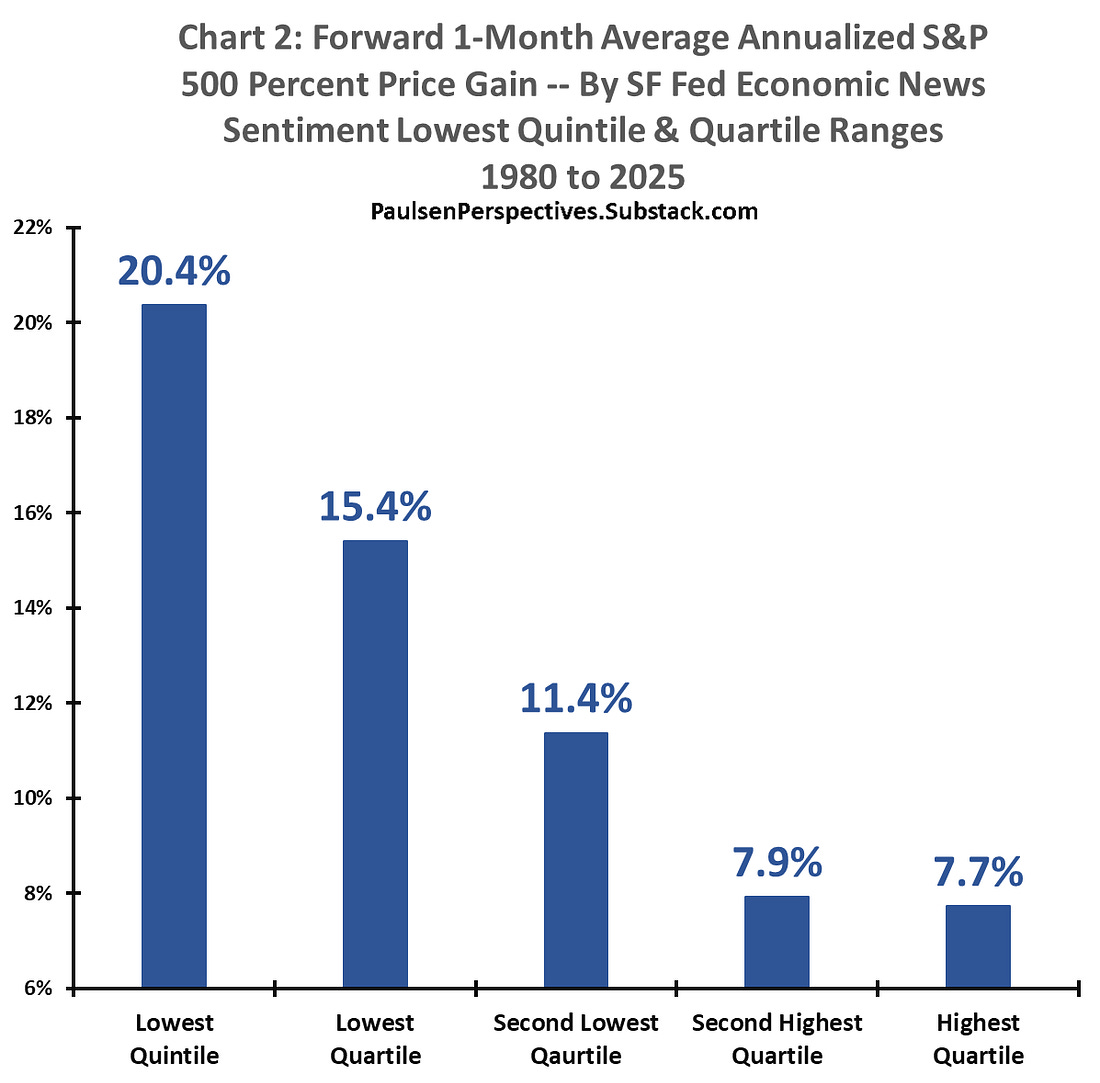 |
Lowest quartile DNSI readings have historically provided twice the forward one-month average annualized percent price gain in the S&P 500 index compared to the performance of the S&P 500 index when the DNSI was in its highest quartile (i.e., 15.4% versus 7.7%). Indeed, as demonstrated, the future performance of the S&P 500 index has consistently declined as economic news sentiment rises toward higher quartiles. The DNSI is currently in its lowest “quintile” which historically implies future average annualized S&P 500 percent prices gains of more than 20%! When pessimism about the economy gets as sour as it is today, usually the stock market has performed remarkably well.
Direct quote from Finom Group’s “Macro-Market Pros and Cons in Q4 2025″ Report (October 19th, 2025)
The Leuthold Group
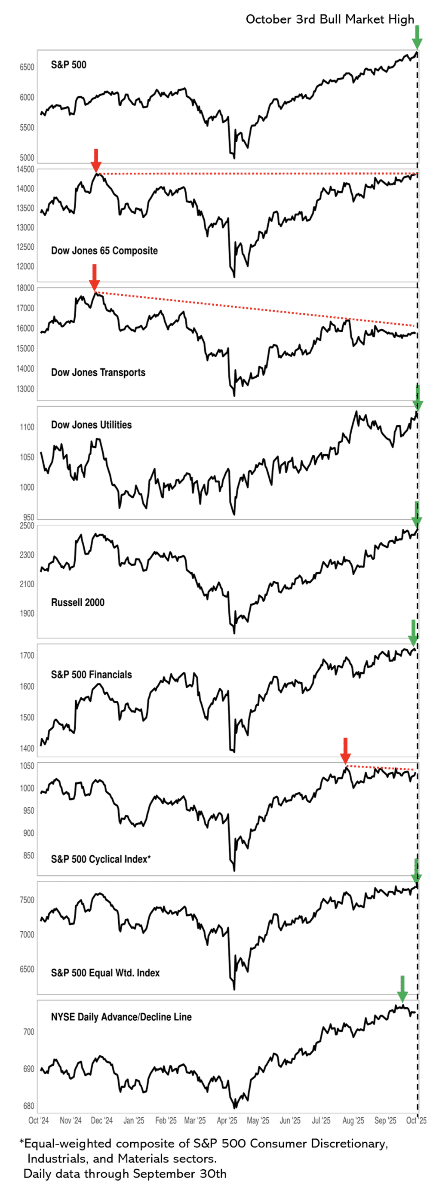
Officially, through September 30th, five of our eight bellwethers have confirmed the latest S&P 500 high. That’s typically good enough for the boat to stay afloat.
As noted last month, based on these benchmarks, the stock market appears healthier than it looked in February. At the February 19th high, seven of the eight bellwethers shown in the accompanying chart were brandishing warning flags (failing to confirm the S&P 500’s bull market high within a month’s time).
At the September 4th top, there were just four red flags among these bellwethers, and we noted that the tally could be quickly cut in half, as both the Dow Jones 65 Composite and the Russell 2000 were approaching their cycle highs of November 2024. The Russell 2000 accomplished that feat in late September and DJ 65 is on the cusp as of September’s close.
More impressive, is that the two breadth measures—NYSE Daily Advance/Decline Line and the Equal Weighted S&P 500—have been consistently confirming the highs in the S&P 500. Despite the top-heavy nature of market leadership (and the resulting struggles of active equity managers), it’s hard to contend that the stock market is now in a serious phase of “distribution.”
Last month, we introduced the Bellwethers Advance/Decline Composite in an attempt to extract a collective message from a single benchmark. At present, while the composite bellwether action has improved since early September, it continues to reveal a much less constructive outlook than that of the traditional (official) NYSE A/D Line.

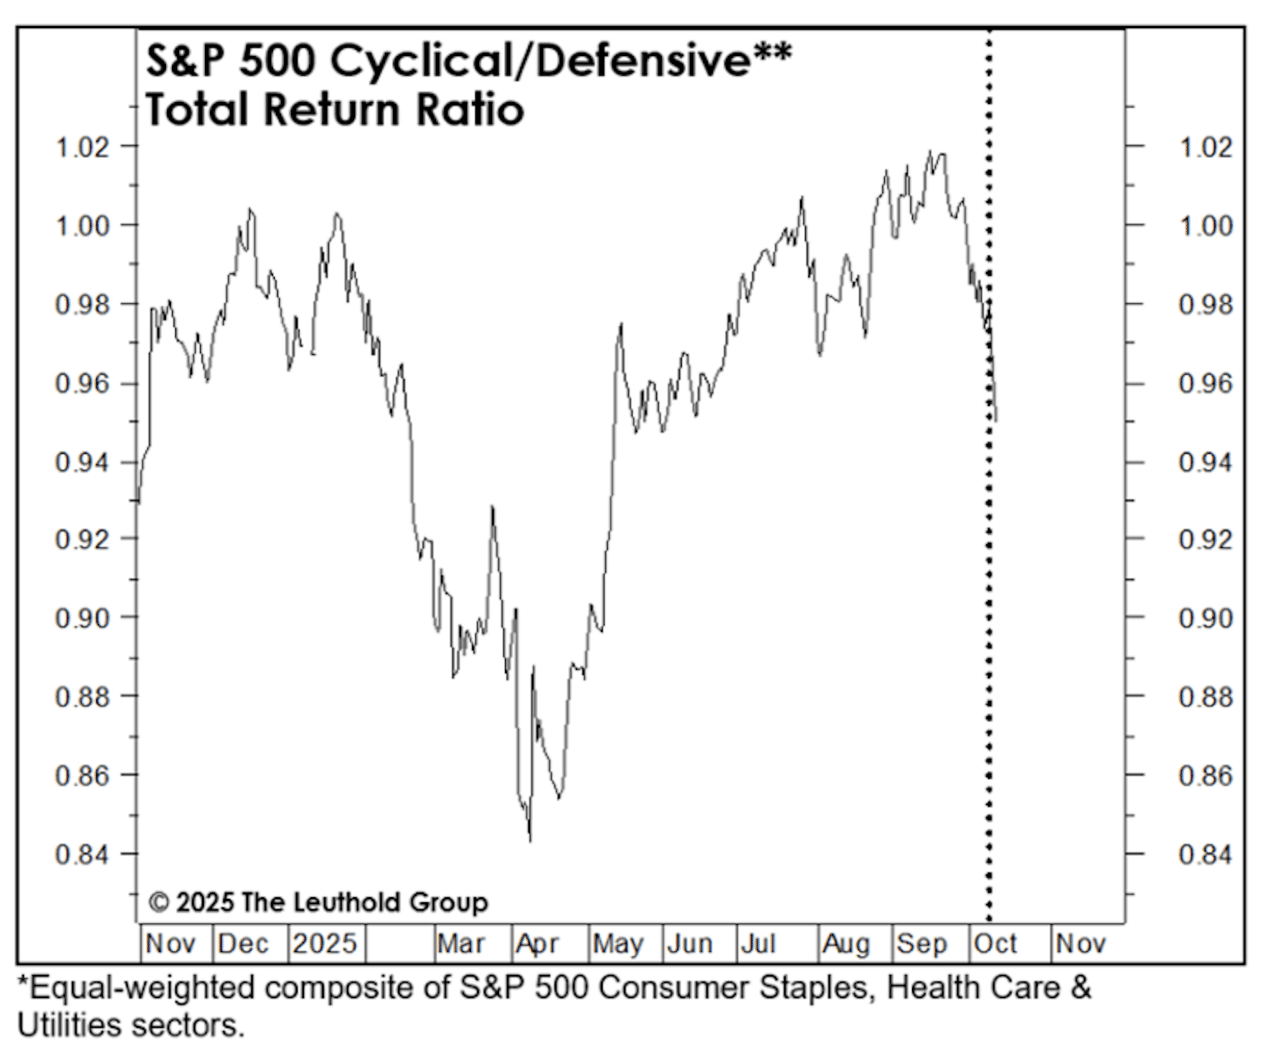
While these “old-school” bellwethers have been pretty well-behaved, we recognize there’s been some ugly developments in areas like crypto and publicly-traded private equity and private credit. And while our Cyclical Sector Composite hasn’t corrected much from its September 19th high, its drop relative to the Defensive Sector Composite is quite steep. Such action is troubling; although, our best guess is that the final bull market peak will not occur until the warnings from our traditional bellwethers have become more pronounced.
Ideally, our Very Long Term (VLT) Momentum algorithm speaks only once per market cycle, when an upturn from the oversold level confirms—a few months after the fact—that a new cyclical bull market is underway. That happened back in March 2023, and the S&P 500 is up 59% since that confirmation.
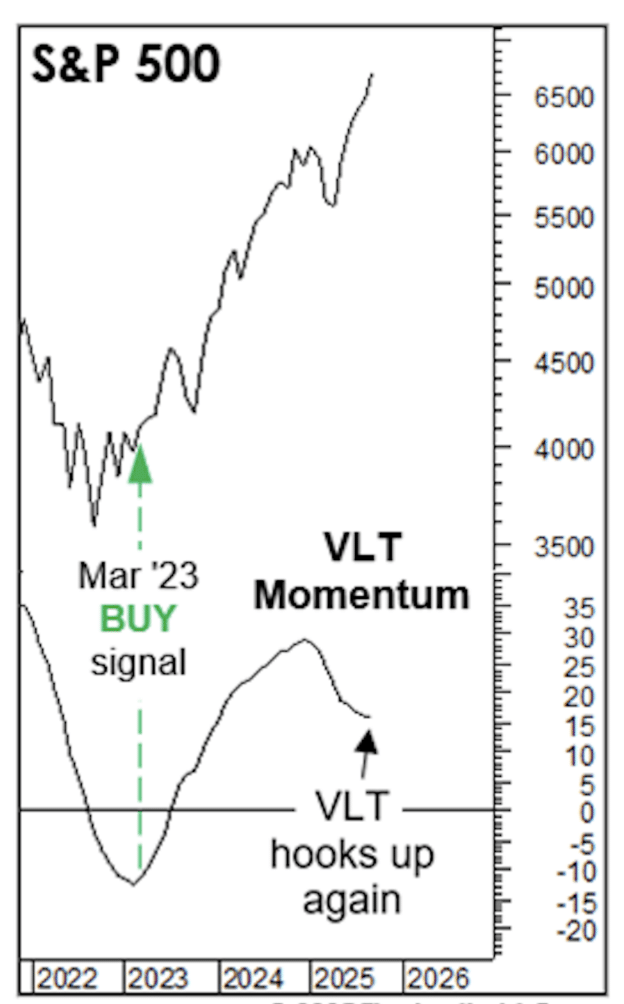
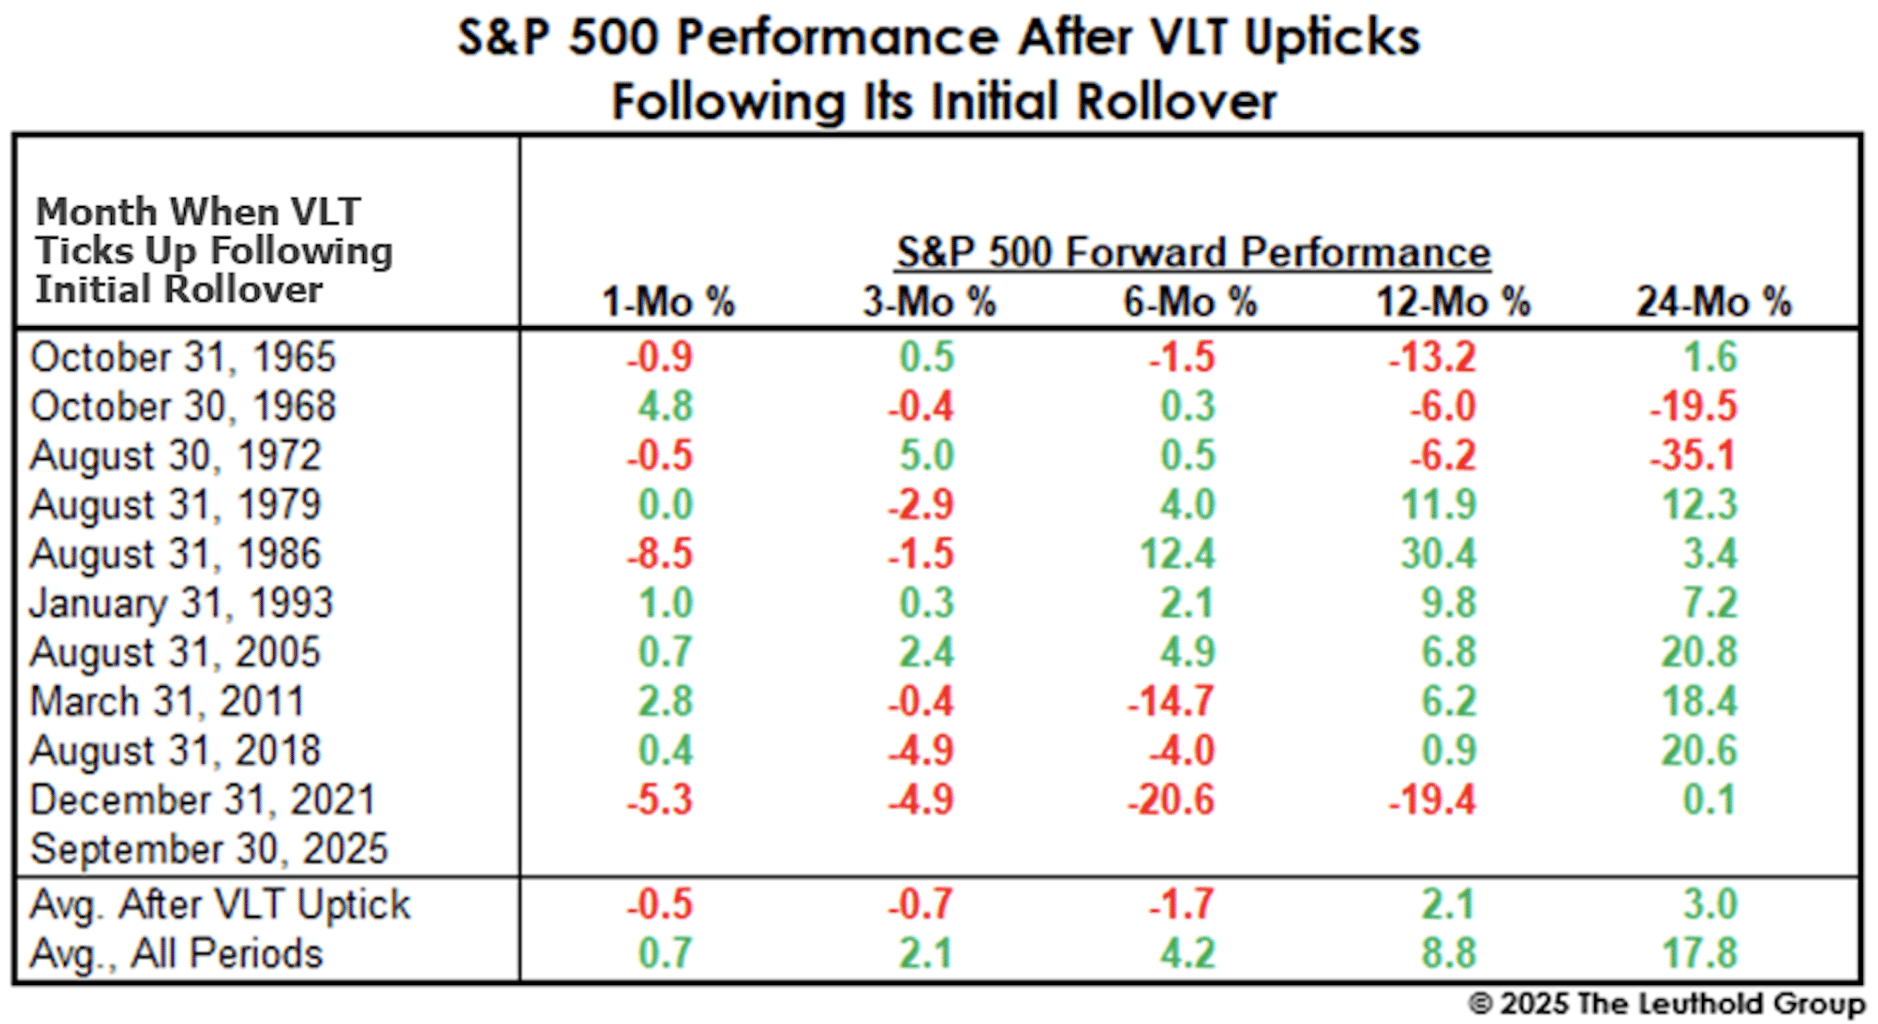
There are several secondary messages from VLT that we monitor, and one triggered at the end of last month. September’s S&P 500 VLT reading ticked up for the first time since VLT’s initial rollover last year. This is not a signal per se, just an event worth noting. Since 1957, there have been ten other cases in which VLT mustered enough strength to reverse higher after its initial rollover, and those cases sometimes turned out to be stock market traps. In the last three instances, for example, there was an important market top the very next month, followed by a “major decline” in each case (S&P 500 loss of 19% or more). Overall, looking out two years, results in the aftermath of a second VLT uptick have been well-below typical stock market returns.
Direct quote from Finom Group’s “Don’t Fall In Love With The Trend, because…″ Report (October 26th, 2025)
The S&P 500 briefly crossed above 6,800 for the first time in history on Friday, ultimately finishing the day at a new record high. The index posted a weekly gain of +1.9%, its third in the past 4 weeks, while already achieving our upwardly revised year-end and 6-month price target objective of 6,800.

“Bottom Line: The majority of the quant data is supporting of higher prices by year-end, but also recognize a reasonably high probability that last week’s modest pullback could prove the precursor to a greater pullback. The catalyst for such a pullback could range from scheduled fund flows to that of a government shutdown. We have viewed ANY pullbacks as buyable, even if those pullbacks prove greater in the coming weeks and unless a macro-event of consequence occurs. As such, we believe higher-highs are in store by year end and remind of our price target objective and time period:
“…the newly cemented S&P 500 price target objective of 6,800 satisfies the year-end time period and the Q1-end of 2026 time period. Within these time parameters, we believe the weight of the evidence which includes the current 22.5X forward 12-month EPS valuation, inform that the S&P 500 should achieve at least 6,800 and absent exogeny/endogeny; if not by year-end then by Q1-end of 2026. One could categorize this outlook by simply recognizing it is a 6-month price target objective.”
With our 6,800 price target objective achieved sooner than year-end and the 6-month period, we are maintaining the price target objective at least through year-end and into the Q1 2026 period. While there remains a high probability for even higher prices, we think it prudent and practical to maintain the 6,800 price target objective and especially as higher prices materialize. Why? An even greater extension in price beyond the 50 and 200-DMA, without a 3-5% pullback (closing basis), combined with certain quant data informs of the potential for a pullback/price consolidation at any moment. Any moment should not assume the likeness of imminency, but rather such extended markets are by default fragile and prone to headline shocks. As an early “spoiler alert” 🚨 of sorts, the following quant is of great consideration in preparation of January 2026:

Coming into 2025, the quant informed of a high probability that January 2025 would deliver a positive return. After a brief but sizable consolidation, the S&P 500 managed a positive monthly return. What is evidenced in the quant is the pattern whereby the S&P 500 express 3 consecutive negative January return years followed by 3 consecutive positive January return years. If the pattern were to hold, since 2008, then the S&P 500 should have and did have expressed positive January return in 2025. With the pattern complete, unfortunately or fortunately depending on your positioning, January 2026 would set-up the first of 3 negative January return years. This is but one data point for but one month of the calendar year, but the consistency of the pattern is not to be dismissed, and we will of course have much more quant data to consider as 2025 comes to an end. For now, this is about 2026 portfolio preparedness!
For those of you who participated and/or achieved last year’s Quant Webinar and PDF file, you’re well aware of how effective this January quant proved to be. For those of you who have not achieved the Quant Webinar, please feel free to contact Finom Group Support to inquire ($99 for members). The Quant Webinar and PDF are one of the most relevant and practical guide to markets for investors, and we look forward to updated the Quant PDF by year-end.

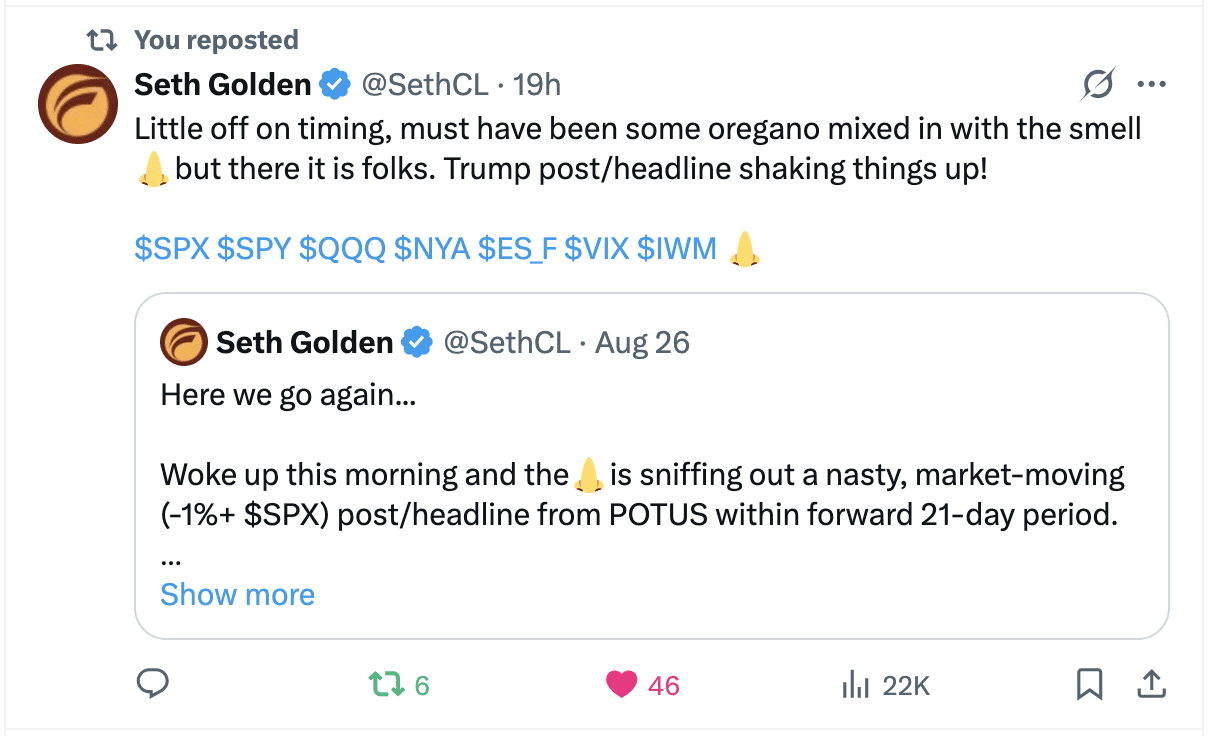
It was always going to be a significant challenge. Perfection! That’s hard for anything we can imagine, and given the seemingly disruptive nature of fiscal policy in 2025, it was likely the least probable outcome, perfection or just the right amount of this and that. Imagine nearly all hopeful trade deals simply turned into tariff implementation outlines with U.S. trade partners. Imagine a period of reflation, the lowest job growth level since Covid 2020 and a negative Q1 GDP quarter. Now imagine all of that proved the perfect amount and status for the U.S. economy to continue on its expansionary path in 2025 to-date. Can you imagine? That would have been the “perfect” consideration since July 2025, as we had considered the following:
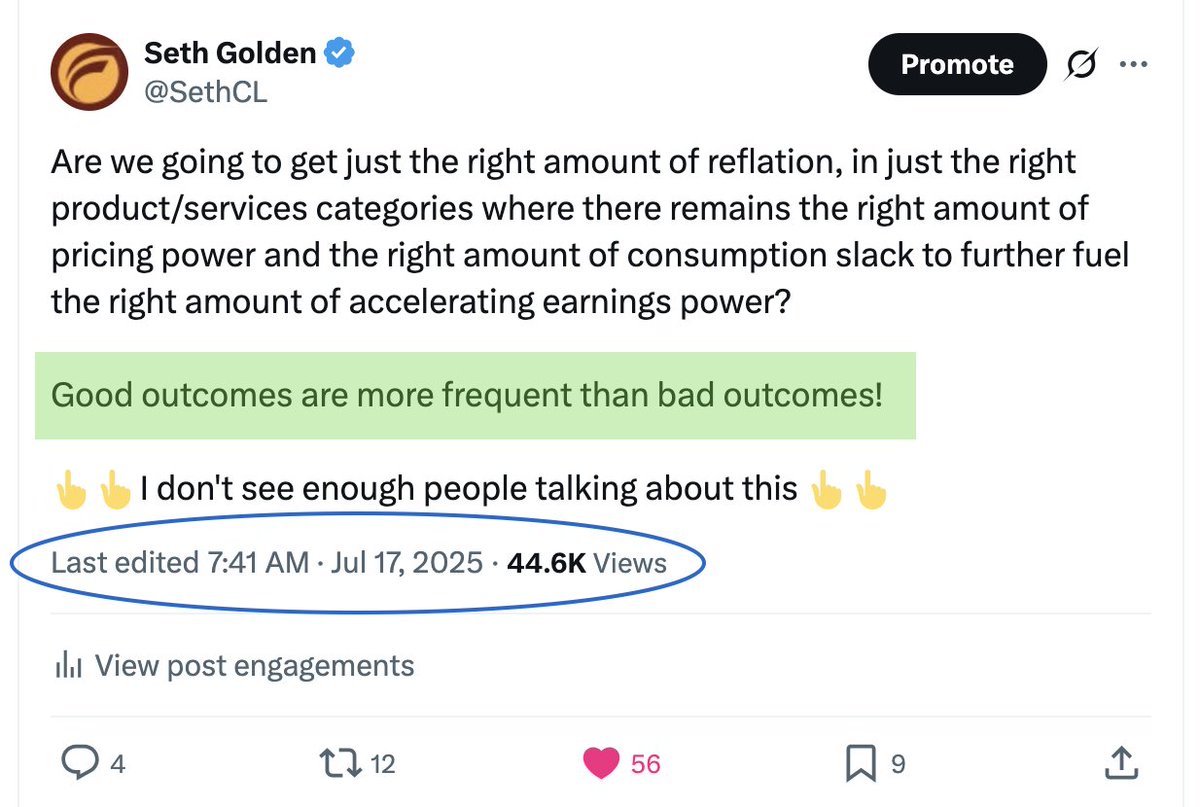
While the masses and media punditry were maintaining their pro-recessionary stance and pessimism, we tracked the data and sustained our positive considerations and participation with the markets, buying every short and shallow dip. The post above, which I offered and covered in our macro-market Research Reports and within the Finom Group Trading Room, was the ideal mindset, not to be covered by the financial media. In the investing business, we call this “alpha”, something that produces favorable outcomes and that can’t be found elsewhere. At this time, and with the market some 9%+ higher since July 17, 2025, I think we can confirm the considerations as alpha generative.
None of the above is to suggest that there weren’t and aren’t to this day concerns. What it rather suggests is that good outcomes occur more often than bad outcomes and maintaining a positive Emotional Quotient and mental framework of optimism is the savvy investor playbook!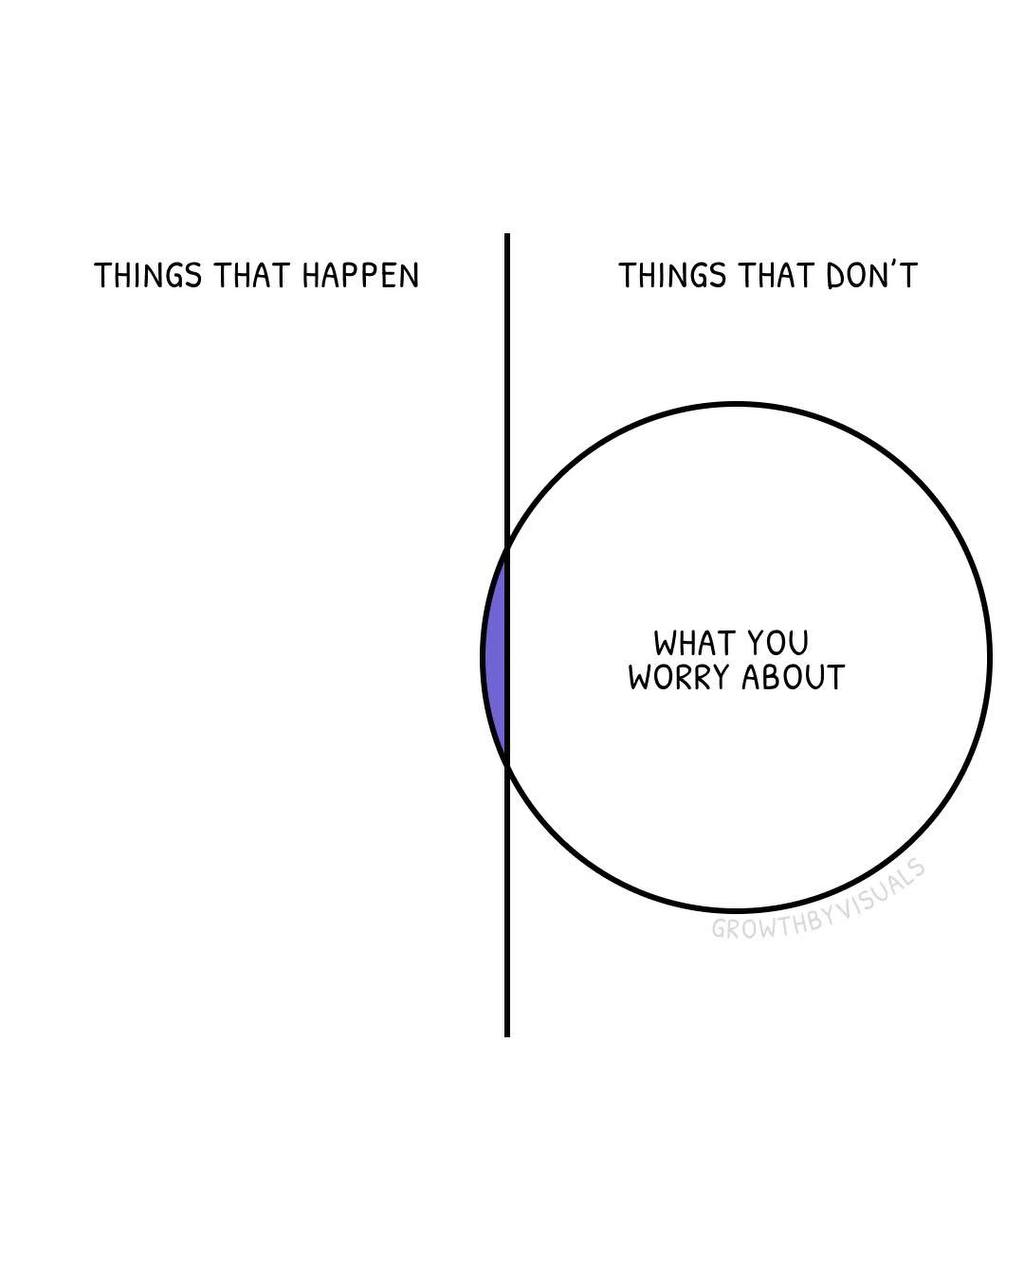 At the end of the day, we can’t control fiscal or monetary policy, and we can’t foresee black swan events let alone remedy them when they should occur. All we can do is manage cash wisely in order to ensure that short-lived market downturns are treated well, and with BUY executions. You can’t control how much or for how long the market turn lower, correct, decline, but you can behave appropriately during downturns, like 2018, 2020, or 2022. You can resource yourself and surround yourself with other savvy investors/traders that can identify the stages of a market downturn, whereby bottoms can also be detected. Since 2018, Finom Group has quite literally identified every market bottom, in real time. Our weekend Research Reports provide the proof; all you have to do is study them!
Direct quote from Finom Group’s “Don’t Fall In Love With The Trend, because…″ Report (October 26th, 2025)
Quant Review/Update
First (and remember there’s no such word “firstly”; that’s not a word), it’s your job to track the Finom Group quant analysis if you find it useful and/or effective for your performance objectives. Please take some time throughout the week to utilize prior archived macro-market Research Reports when in doubt, they are your weekly guide to markets, and often more than just that.
Additionally and as another reminder, “Nowadays everyone has quant data, but not everyone has the ability to qualify and or sequence the data properly.” I see quants all day, everyday, and most are useless… most. Many quants are simply derivatives of a “primary quant.” Meaning: the secondary quants only exist because a primary quant exists with long forward efficacy or positivity rates and with heavy structure. With that being said, let’s review some primary quants we desire to have front of mind and through year-end.
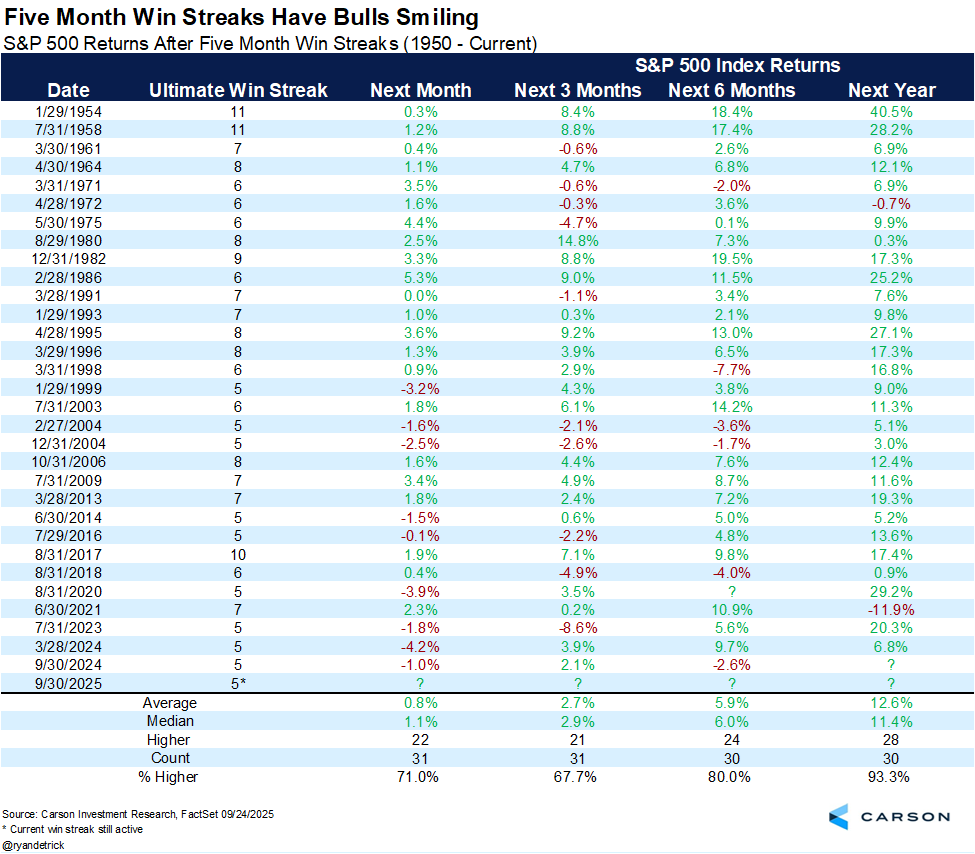
Remember something you may have learned from our Quant Webinar/PDF last year (for those who purchased PDF): “Whenever engaging a quant study for the first time, don’t read the headline of the quant study.” First look at the sample size and then scroll to the positivity rates and average/median returns. If dates… if dates included as the sample size identifier, look at the dates. Some of you have already performed this exercise and have already recognized what I’m about to outline: “There has only been a 5-month winning streak ending in September 1 other time.” So what does this mean? Well, this time is clearly different does seem fitting for one thing. But, here’s another…
I can appreciate that this is a price trend/fund flow quant, which is a most favorable of quant studies, without denial. But look at the 3-month forward positivity rate of only 67.7%. My rule of thumb with quant studies is that if the positivity rate isn’t in the 70% or better range, it proves less effective or useful. We might decide to disregard the quant for the 3-month period or through year-end, but still be reminded of the 12-month forward positivity rate of 93%.
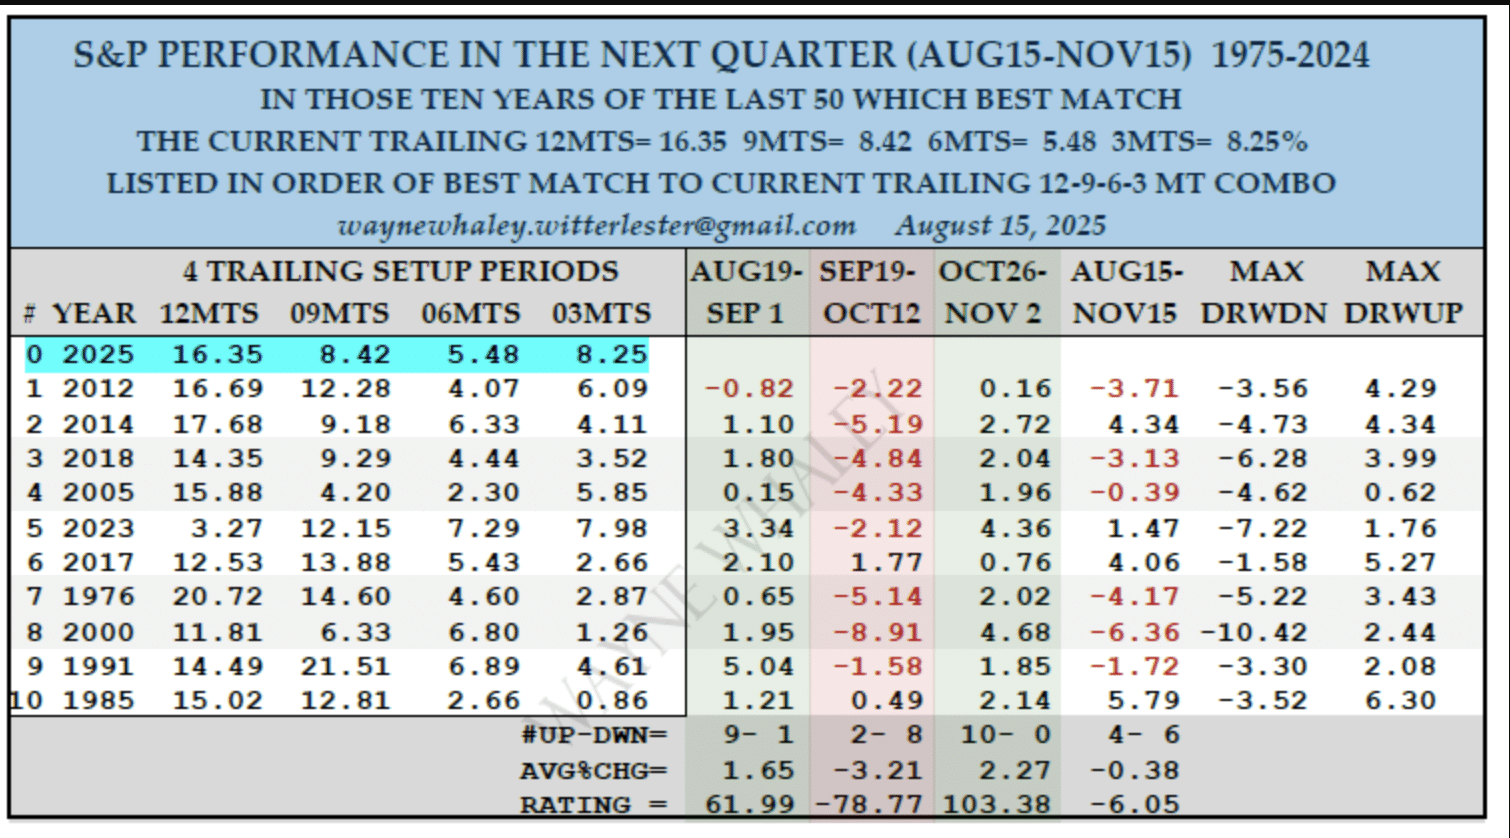
“We have arrived”, as the saying goes. This Wayne Whaley quant above has tracked quite well with history. The September 19 – October 12 period delivered its anticipated negative return. Now we look forward to the perfect 10-0 positivity rate associated with the October 26 – November 2nd period. In other words, you want to be a buyer of any SPX price below this past Friday’s close of 6,791 in between Monday and November 2nd.
The Wayne Whaley quant is also broader trend analysis quant and relates to the Trader’s Almanac quant known as The Halloween Trade: last 4 trading days of October and the first 3 trading days of November have a stellar record over the last 31 years. From the table below:

Using the Wayne Whaley broader trend quant combined with the Halloween Trade (which essentially adds 1-trading day), there is a very high probability for higher prices than 6,791 by November 5th and keeping in mind that November 1-2 is the weekend. Additionally, the Halloween Trade failed last year. What do you think the odds are that it would fail in consecutive years, which has happened only 1 other time since 1994!
Direct quote from Finom Group’s “Don’t Fall In Love With The Trend, because…″ Report (October 26th, 2025)
The 100 point gain since the start of Q4 2025 is still not even 2%. And… the worst return for the S&P 500, within the quant since 1957, was +5.5%. More room to quantitatively run is evidenced by this analysis and if we consider the 34th all-time high in 2025, quantified in the table below:
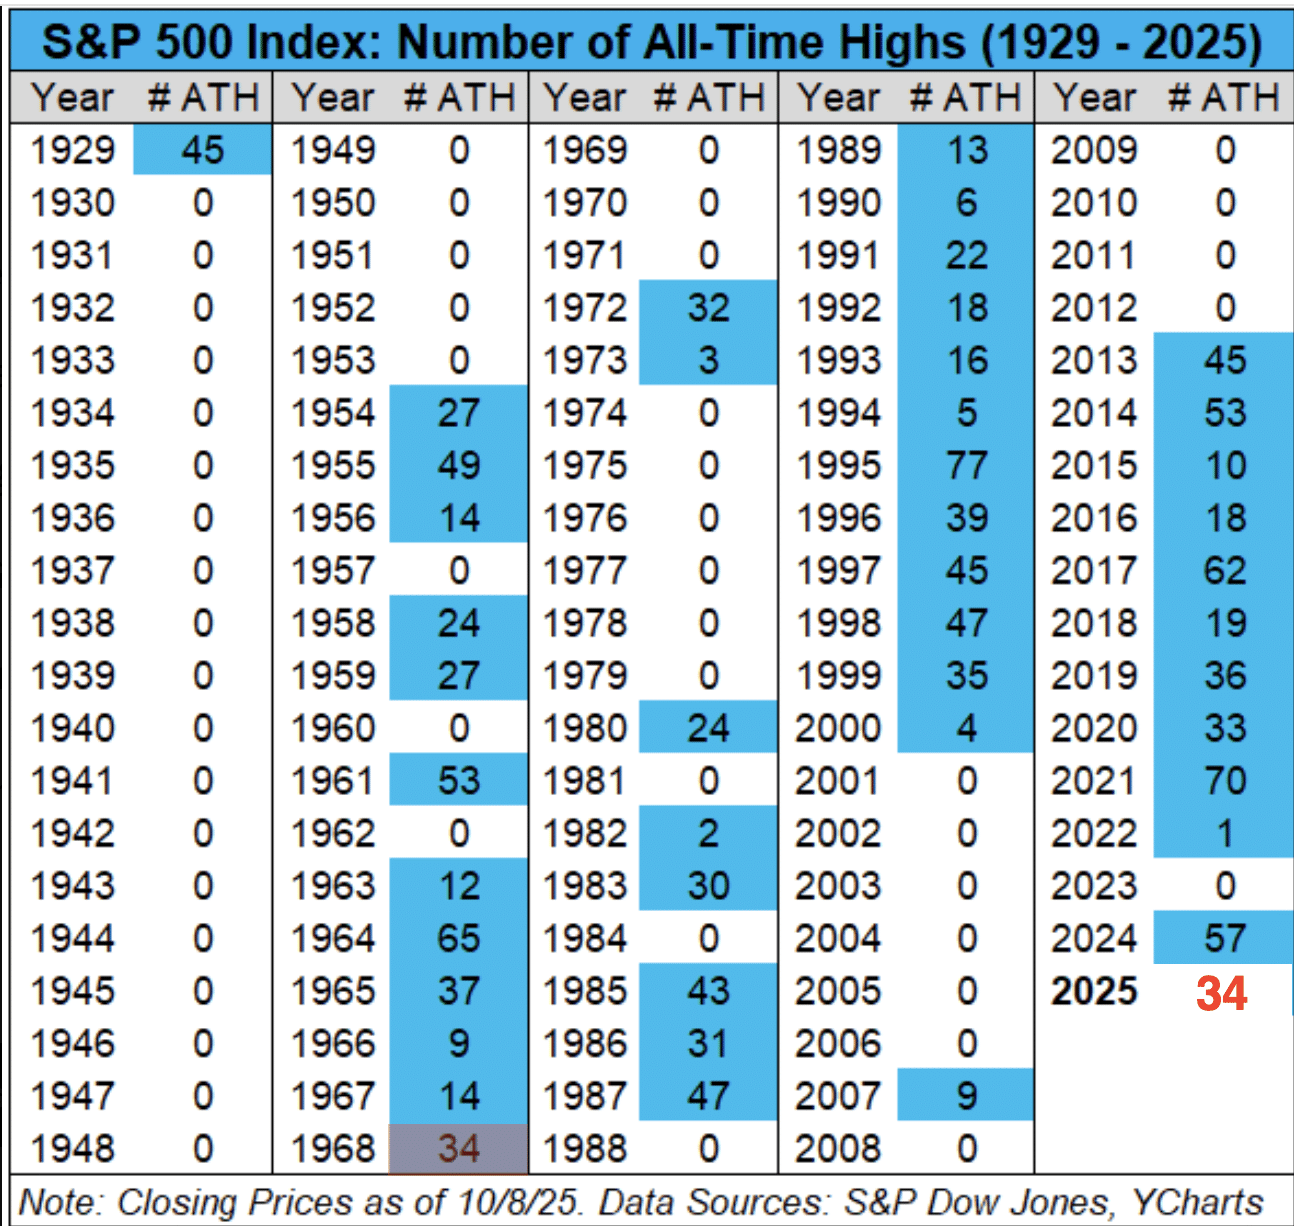
Only one other time in history has the S&P 500 made its final all-time high in a calendar year at number #34. Every other time it has made at least one more all-time high. The quantitative analytics inform there is a 89% probability of at least one more all-time high to be achieved in 2025.
Again, just looking at the return column in the quant above and the one from Bluekurtic previously regarding November – December returns (average 6.2%), that gets me to thinking about the upcoming TOY Barometer kick-off on November 19th and which runs through January 19, 2026. I don’t want to get into something more lengthy about the TOY Barometer just yet, but in considering the already reviewed quants and the one below from Wayne Whaley, I can’t help but to think about the TOY probabilities. So I will just leave it below for now, and we’ll revisit in the coming weeks as we will have a more completed scope of price action come that time. A lot of potential Turn of Year and January 2026 questions can be considered with a better understanding of the probabilities by studying this quant:
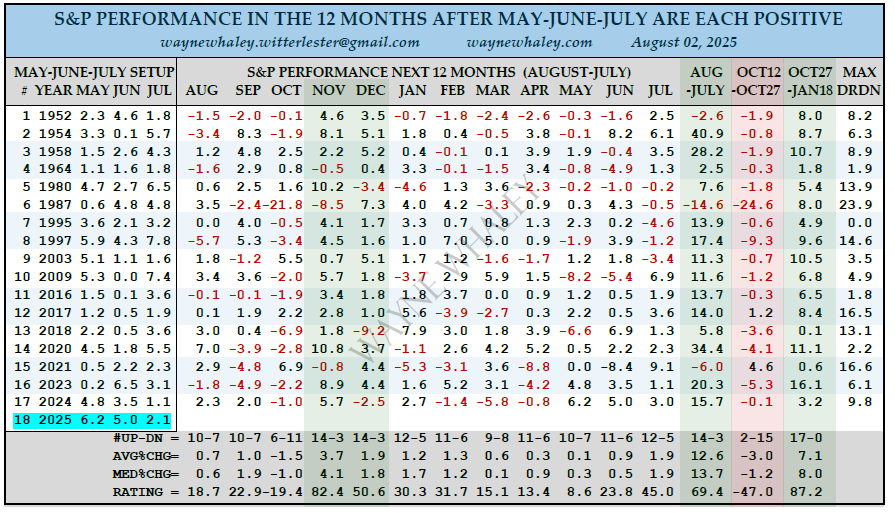
A 17-0 TURN OF THE YEAR SETUP – compliments of positive months in May, June & July Coming off the 20% Feb19 – Apr 8 pullback, May, June and July have each managed to post positive months, up 6.2, 5.0 and 2.1%, resp. There have only been 17 previous cases in the 75 post 1950 years in which the traditional “Sell in May & Go Away” time frame kicked off with three consecutive positive months (May-June-July), exhibiting resilience which history suggest merits respect. The following 12 months, August-July were 14-3 in this setup for a respectable average gain of 12.6% as compared to a normal 9.5% year. In this particular setup, the only forward negative month in the following year was October, with the October 12-27 time frame going 2-15 for an avg loss of 3.0%. However, Oct 27 – Jan 18 flips those losses and then some, going 17-0 for an average 11.7 week gain of 7.1%.
Direct quote from Finom Group’s “Don’t Fall In Love With The Trend, because…″ Report (October 26th, 2025)
The Final Words
The following technical analysis will be more educational than anything else. We hope that’s generally the case, but even so…The few charts we’ll discuss will ask investors to log the analysis for both today and future consideration.
With the seemingly endless melt-up in markets since April 8th’s bottom, and markets consistently expressing new Advance/Decline Line highs that lend toward validating the index all-time highs, investors may find themselves less concerned about a future market correction or meltdown. I would suggest worrying about a correction is somewhat futile and wasteful. You’ll never know a corrections precise timing, or even if that normal and to-be-expected correction will turn into a bear market. As such, futile and wasteful. What you can do, however, is recognize market strength and/or fragility in order to maintain appropriate exposure to the market, given the aforementioned market conditions.
Coming into 2025, the Golden Capital Portfolio was extremely cash heavy and overexposed to a highly liquid, high yielding, cash-like product known as SGOV. Some reasons for this unusually high cash-like product was largely due to quant data sets that had suggested a reasonably high probability of an intra-year correction and even a flash bear market. Other reasons for the heavy cash-like position were technical in nature.
The High-Low Logic Index was sending a bearish signal through much of 2021 and 2024’s bull market, informing of the increasingly bifurcated nature of the rally. Both of those bull market years resulted in bear market conditions the following 2022 and 2025 calendar years.
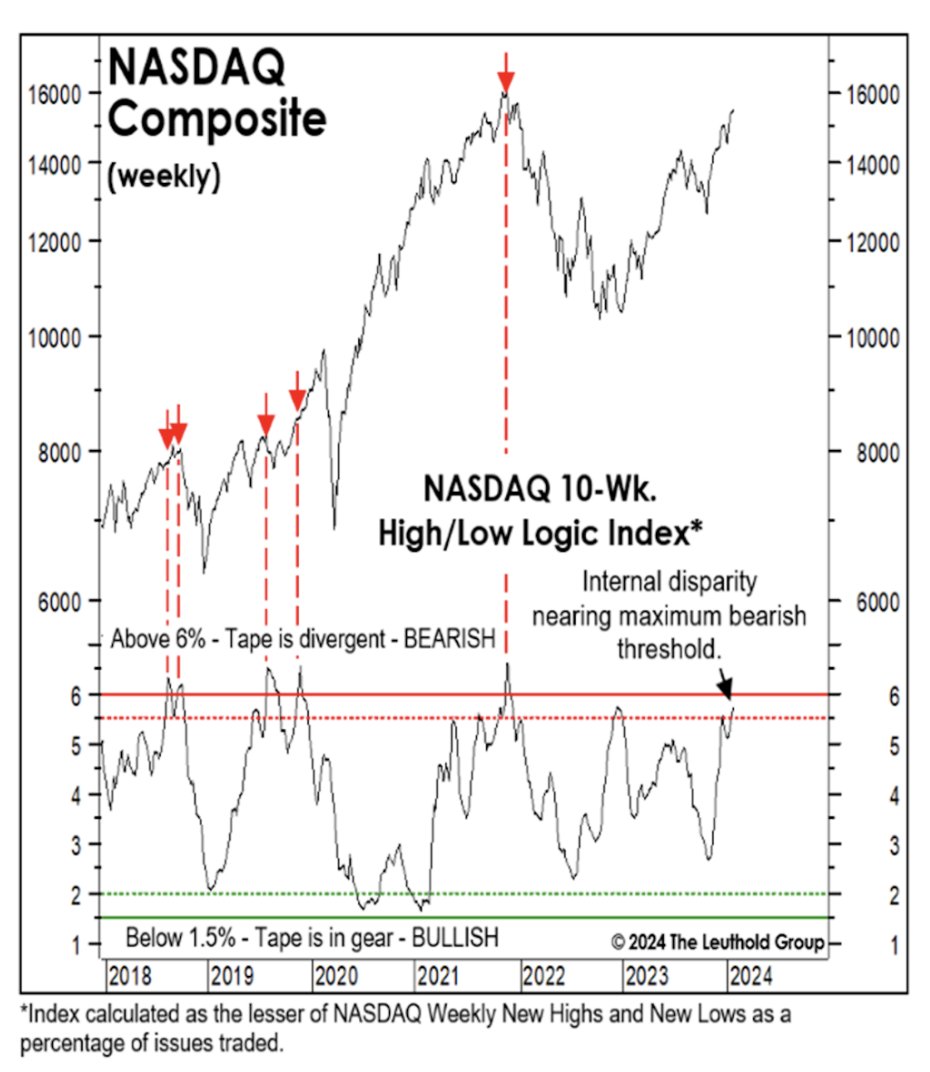
The indicator had been flashing for more than 7 months in each occurrence, informing that such indicators are not causal. The High-Low Logic Index warning signal did not cause the 2022 or 2025 bear markets, they simply signaled the fragility of the markets that would still demand a catalyst to produce such bearish market price action. Naturally, both bear market occurrences found such catalysts.
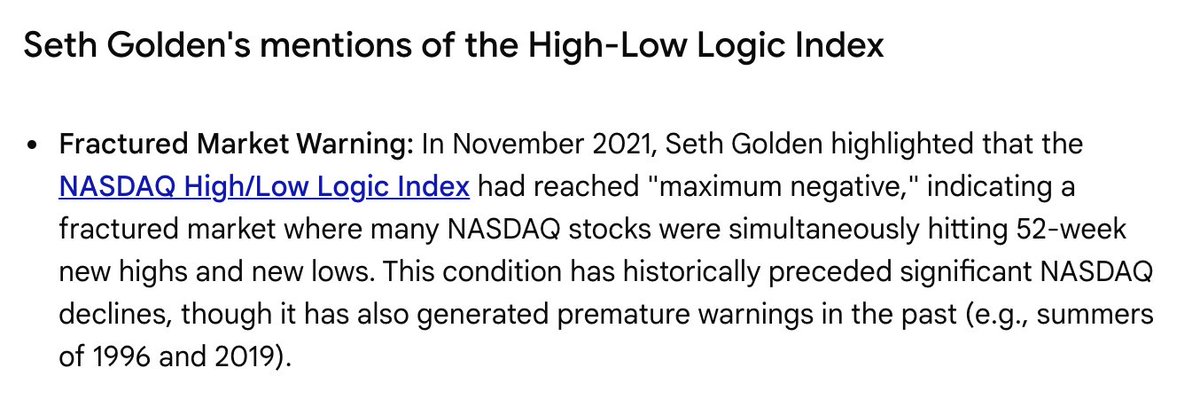
For the Nasdaq Composite, the High-Low Logic Index reached record levels in late 2024, but crashed lower with the 25% index decline in early 2025. Since the summer, however, the HLL Index has returned to the “danger zone” (above 1.70). A reading in the danger zone is not the end of the world and is not confirmed by the NYSE High-Low Logic Index, which it demands no confirmation from anyway, but as an aside the two indices with elevated readings would prove that much more concerning. In short, when asked as to wether or not one can utilize technicals and stochastics to inform of how to better allocate capital, this was one such example of many which answers that question positively.
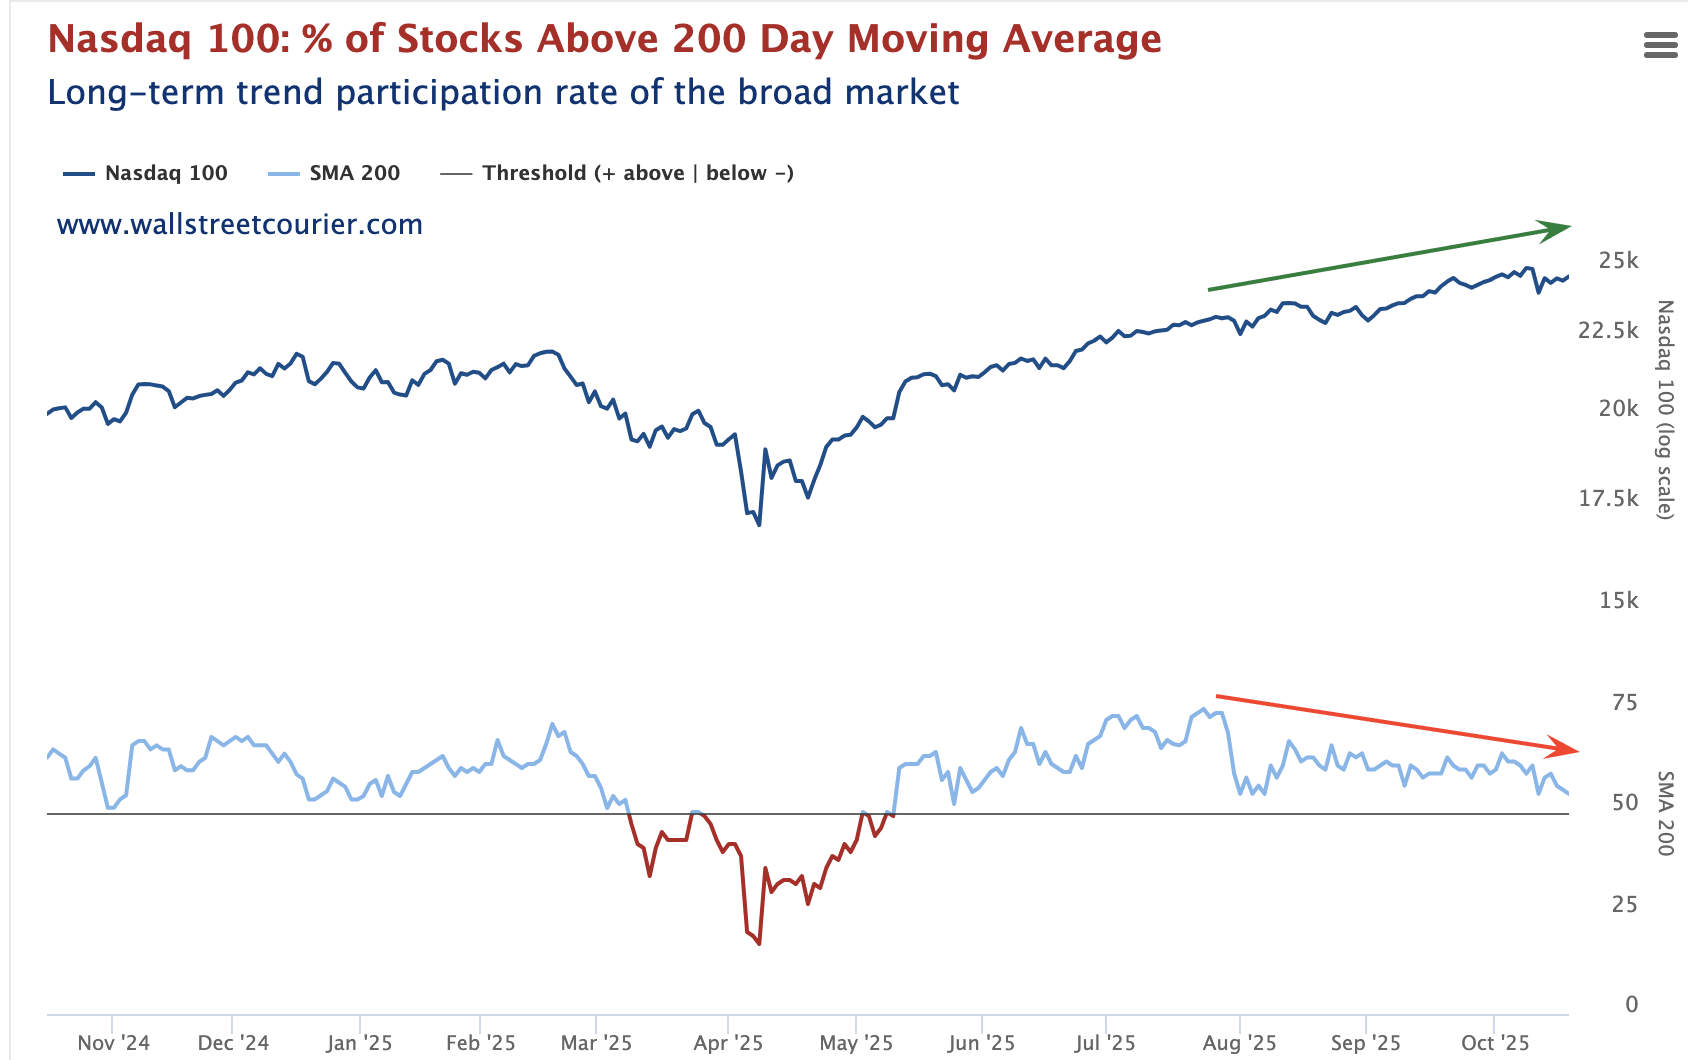
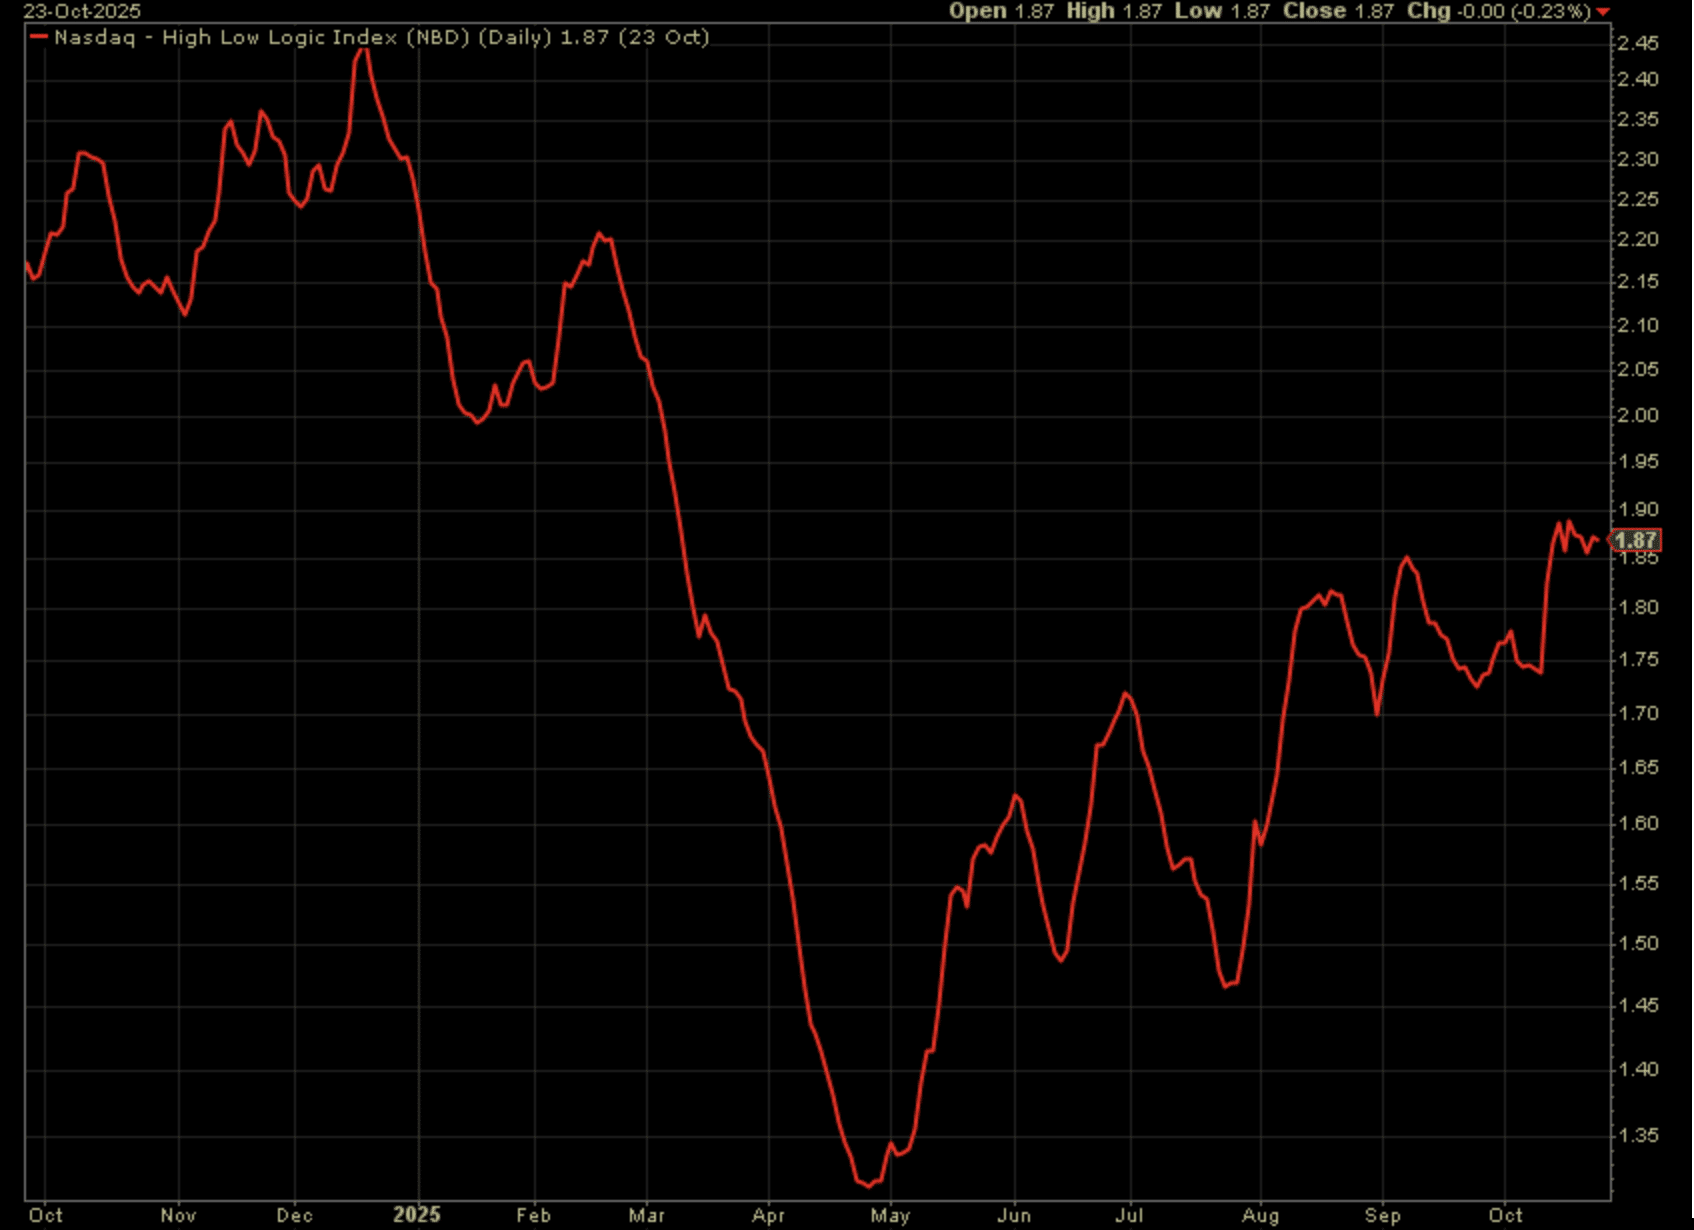
While the High-Low Logic Index proves innocuous thus far and in my opinion, I’m sure there are many other technical renderings that prove more concerning. The one I’m mostly considering for this exercise is the percentage of stocks trading above the 50-DMA within the S&P 500.
The annotated chart below identifies a longstanding bearish breadth divergence.
The beautiful aspect about this chart rendering is that it not only informs of the bearish breadth divergence, but that such divergences, like warning signals from the High-Low Logic Index, are not timing tools. Almost all manner of technical warnings demand a catalyst. For such a protracted bearish divergence, it obviously denotes that all the trade headlines have not proven a catalyst to deny the cap-weighted index of it’s uptrend since April. What it also informs is that technicals do not drive price the vast majority of the time, but rather fundamentals. Any investor/trader following the path of the 2025 earnings growth and positively revised estimates for 2026’s earnings growth can identify the 1:1 correlation for price and earnings.
With that being said, what the ongoing lower-highs and lower-lows for the percent of stocks trading above their 50-DMA suggests is that while the index is trending ever-higher, fewer and fewer stocks within the S&P 500 have trended as well as the index. This is identifiable fragility of the index as a whole. Should there prove a bearishly consequential fundamental or macro-catalyst in the future, this technical analysis will have likely proven a sound warning of the fragile nature of the late 2025 bull market.
Moreover, I’m sure I could list a dozen or so index fragility warning charts presently, but they would prove redundant with no one chart proving a greater warning signal than the next. Secondly, such redundant technical exercises are often the practice of market technicians or trend followers who are seemingly always hunting for technical problems/pitfalls, resulting in perpetual portfolio underperformance. If you’re always looking for the downside of future price action, it’s invariably impossible for that posture to not plague one’s psyche and portfolio positioning. One more technical consideration, as it pertains to the ongoing bull market…
A Zweig Breadth Thrust (ZBT) had the potential to trigger on Friday of this past trading week. With one having already been expressed in April of this year and in 2 having triggered in 2023, investors were monitoring for the triggered signal on the final day for which it could have been achieved.
“The Zweig Breadth Thrust is a technical indicator created by Martin Zweig that signals a potential shift from an oversold to a strong, bullish market. A “thrust” occurs when the 10-day moving average of a market’s advancing stocks (as a percentage of total advancing and declining stocks) rises from below 40% to above 61.5% within a 10-day period. This rapid shift suggests broad market demand is overwhelming supply, potentially signaling the start of a major bull run.
Because Friday was the final trading session to achieve this forward bullish breadth thrust and it didn’t trigger, I’m not of the opinion investors should simply shrug it off as a nothing burger. Price action, of all kinds, informs of algorithmic and human behavior. Every potential ZBT since 2020 has been realized, until this latest ZBT failure. Something has changed within the behavior of humans engaging in the market dips recently, and such tracking of ZBTs since 2020 helps to validate the behavioral change. The magnitude of the behavioral change may not be known for many months, but like the other technical renderings already discussed, I would be of the opinion investors/traders should log such detailed messages from Mr. Market and for future consideration.
There are plenty of favorable technicals taking place in the market presently, and equally favorable fundamentals (already discussed in former segments of this macro-market Research Report). With the S&P 500’s 34th all-time closing high this past Friday, the NYSE A/D Line managed, even if ever so slightly, a confirming all-time high as well.
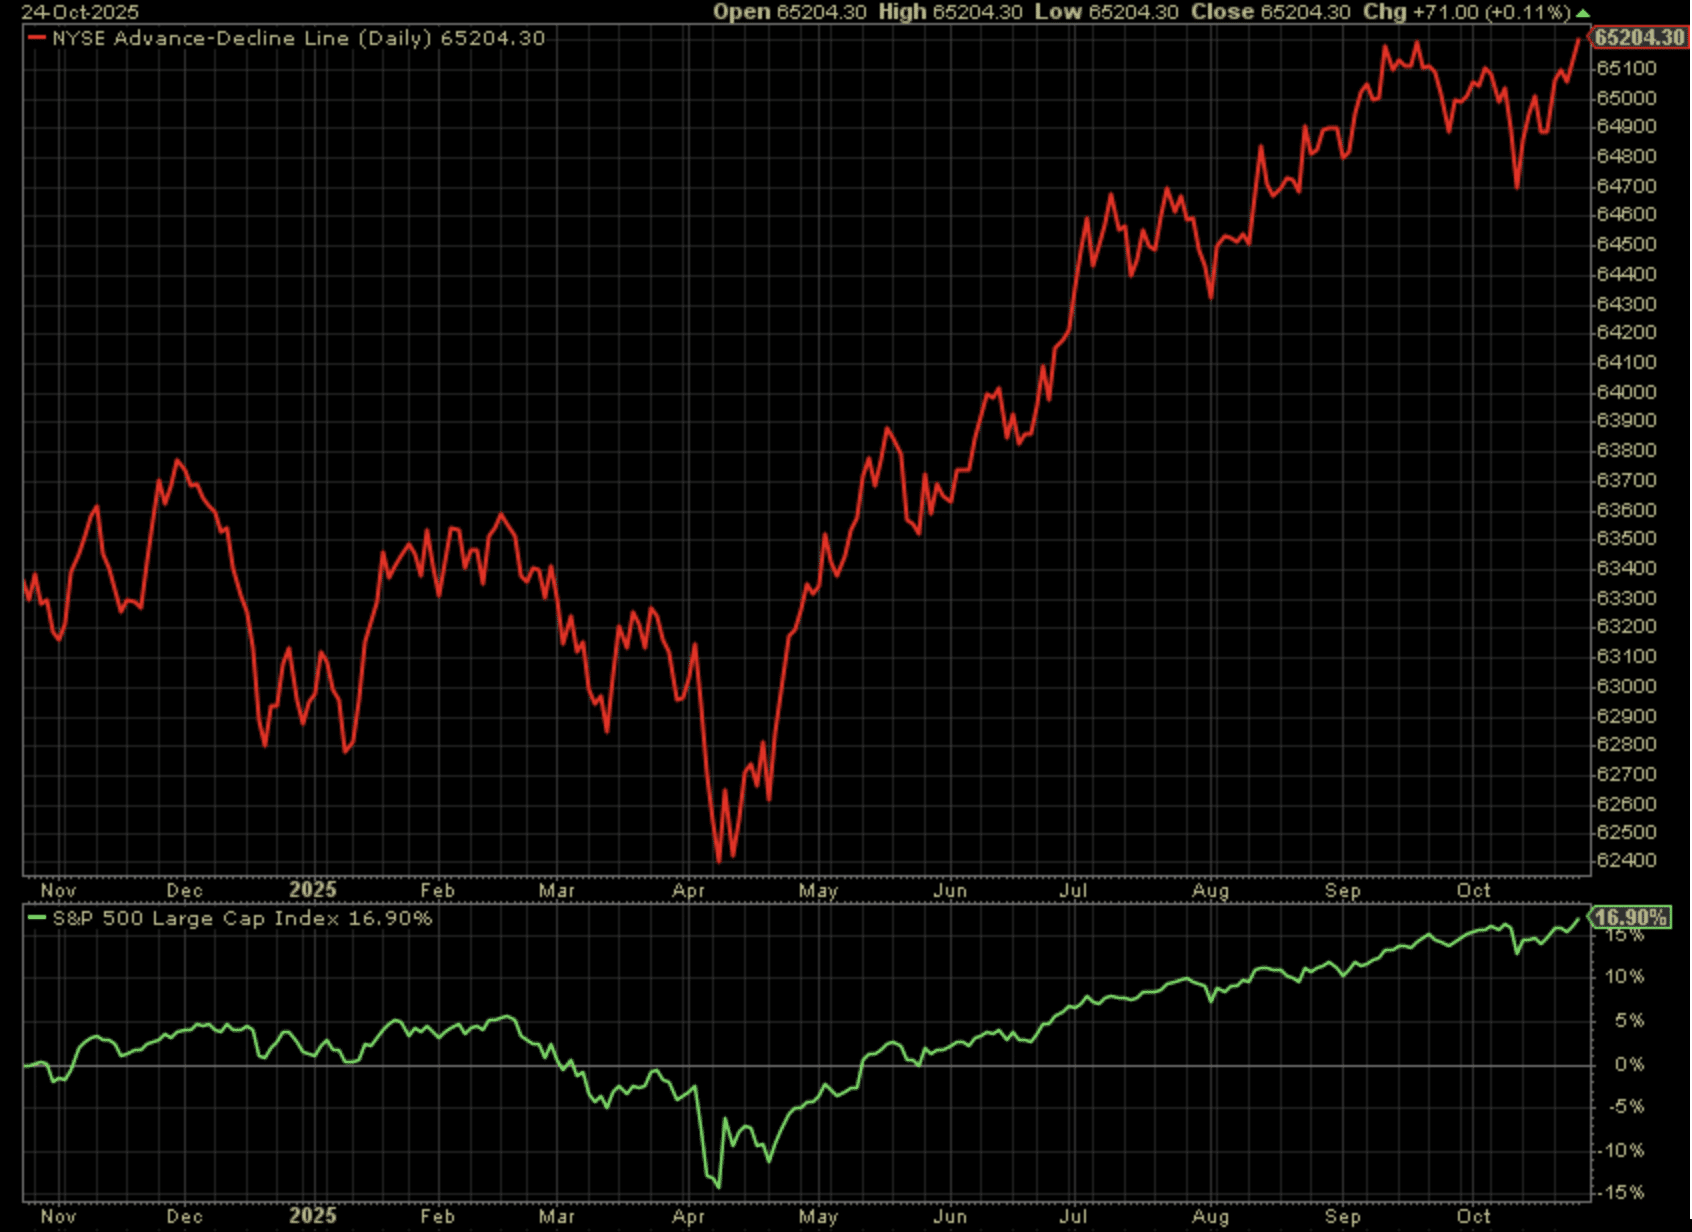
Why would you use another index A/D Line to confirm the benchmark index’s all-time high. Don’t get me started folks. I’ve never agreed with such a belief system, but I don’t make the rules for what thousands upon thousands of technicians/investors/traders have chosen as a rule for decades.
This portion of this weekend’s analysis was simply an exercise in recognizing warning signals, even if we don’t know the lead time of the warning/s. In my humble opinion, we’re likely reminded of this exercise in technical analysis come 2026’s Midterm election year. For now, the trend is your friend, just don’t fall in love ❤️ with the trend!


