
“Definitely a disproportional move in VOL today (Tuesday) relative to SPX. Heading into monthly Op/Ex.
I’m of the opinion this potential indictment to come is in-keeping with the Fed pressure campaign by the White House and to continue lowering rates in the face of a January pause, which would otherwise last until March as there is no meeting in February. Additionally, the latest development would serve as a nudge to the Chairman to remove himself from the Fed Board in May, when his term ends, instead of remaining on the Fed Board. Markets speak and will likely result in the usual backtracking of White House, but a criminal hearing is unlikely and market action in the interim is opportunity.”
– SETH GOLDEN, CHIEF MARKET STRATEGIST AT FINOMGROUP.COM
(CONTRIBUTOR/PREMIUM MEMBERS ONLY)

MID-WEEK SUMMARY
THURSDAY, JANUARY 15TH, 2025
Welcome to Market Mania #24! – Sniffing 👃 7,000, Following the Four North Stars
The S&P 500 comes into Thursday, January 15th sniffing 7,000 with investors acting like someone glued to a heart monitor instead of asking whether the patient is actually healthy. Price is jumping around, sectors are rotating, recession charts are going viral—but the real “vitals” of this bull market remain the slow-moving habits: credit, earnings, growth, and fiscal policy. Those are still pointing to expansion, even as the narrative machine insists a bubble must burst *now* simply because the last three years delivered high double‑digit returns and we are entering a midterm election year which on AVERAGE offers larger drawdowns (-17.5%) and heightened volatility in all months of the year except for Feb-Mar.
If AI is Dotcom
S&P 100 : S&P 500 Performance Ratio
2024 – 2025 will complete the achieved price action from 1997 – 1998.
2026-2027 would complete 1999 – 2000 price trend.
AI trend has not yet gotten parabolic; if Michael Burry, I'd be concerned. Too much preciseness here.… pic.twitter.com/MunruDTlXg
— Seth Golden (@SethCL) November 12, 2025
The latest scare comes from the labor corner. A widely shared unemployment-versus–3‑year moving‑average chart is being touted as a 100% hit‑rate recession signal since 1950, echoing Sahm‑Rule alarmism. Finom Group’s most recent research report, “Sniffing 7,000” shows what happens when you actually run the numbers: the correlation between that labor trigger and recession/GDP is about -0.13—more symptom than cause—and the Sahm Rule itself has already produced false positives this cycle ie opportunity cost, and a lot of it! The lesson isn’t that risk is absent; it’s that there is no crystal ball. Forecasting is probabilistic, not prophetic, and leaning on a single indicator is as reckless as diagnosing yourself off one bad heart-rate spike.
ALBERT EDWARDS “.. No-one is predicting US recession in 2026 despite this simple indicator having 100% track record. This time may well be different, but you've got to have a bloody good reason to ignore this."
EVERY. SINGLE. RECESSION. was an endogenous or exogenous event,… pic.twitter.com/9INttm85vI
— Seth Golden (@SethCL) January 9, 2026
Under the surface, the market’s microstructure is going through a noisy transition. Rotation has been the lifeblood of this bull since 2024—Mag7 to cyclicals, to semis, to equal‑weight, to small caps—but that does NOT mean leadership has truly changed. Technology has led roughly 93% of past bull markets because it is a price setter, not a price taker; it creates new demand and margin rather than just riding the tide. Right now there is effectively no leadership: equal‑weight (RSP) and small caps (IWM) are finally outpacing cap‑weighted indices for 8 straight sessions this year, semis are seemingly carrying the growth torch, and mega‑cap tech is digesting an AI‑driven, asset‑heavy transition instead of sprinting. Structurally, that broadening is healthy; mathematically, it’s a drag. Are the first 2 weeks informing of what kind of returns may be in store for rest of the year? Will Savita Subramanian finally be proven right? We hope so! 😉👇
BofA Savita Subramanian
💎Back to neutral w/7,100 PT
🔶Strong EPS growth, but P/E contraction
♦️Raise Staples to Overweight
🔷Still no consumer facing AI consumption, all CAPEX
💠Not Dotcom 2000, but demands broadening
🔸Credit Cycle looms$SPX $SPY $QQQ $NYA $IWM $VIX $XLP… pic.twitter.com/Ab0uuy18zV— Seth Golden (@SethCL) December 21, 2025
You can see the cost of that broadening in real time. From the Christmas Eve 2025 S&P all‑time high to the early January 2026 high, the benchmark gained only about 0.5% before giving it back—that’s the price of spreading returns across more shoulders while your heaviest names stall. As of January 8th, the performance stack told the story: IWM +2.4% YTD, RSP +1.6% YTD, SPY +1.1% YTD, QQQ +0.3% YTD. If that relative pattern compounds quarter after quarter, it can easily steal something like 8 percentage points from what the S&P 500 might otherwise have delivered in 2026. When you ask for less concentration, you’re often asking for better structure, not better headline returns—at least in the shorter term. Be careful what you wish for folks! Stock picker markets only end one way, please refer to 2021/2022 market action if you forgot what kind of results that may bring… unless this dynamic is quickly remediated? Cierra los ojos! 🙈 or hold your nose! 🤣
Cap-weighted S&P 500 fell over 0.5% while the equal weighted index $RSP gained over 0.4%. That’s not weakness, it’s market broadening. Only 7 such instances historically. $SPX was positive 100% of the time 3, 6, and 12 months later, with 12M max drawdowns always less than 20%. pic.twitter.com/6eWibJFsUR
— Bluekurtic Market Insights (@Bluekurtic) January 14, 2026
2020s = Unprecedented
Never had 2 bear markets in 3 year period until Covid
Never had 3 bear markets in 5 year period until Inflation
Never had 4 bear markets in 7-year period until Tariffs
Never had 5 bear markets in 8-year period until…🤞— Seth Golden (@SethCL) October 7, 2025
Layer onto that the historical context: since 1929, the market has effectively only once stalled out after making four all‑time highs in a calendar year—2000, the dot‑com peak. Got your attention yet? 😉 That episode required extreme valuations (scary), speculative leverage (scary), and deteriorating earnings (scary) to convert “four ATHs and done” into a true regime top. Today, valuations are elevated but grounded in real profitability and massive free‑cash‑flow engines; forward 12‑month earnings are still expected to grow at a mid‑teens clip; GDP is expanding; and balance sheets across households and corporates remain robust, not stretched. Could 2026 be the second “four ATHs and stop” year? It can be, but the burden of proof lies with those betting on a 2000‑style exception, not with the base case of higher highs over time.
In this environment, the only way to stay oriented is to come back to the four North Stars Seth has been hammering:
1️⃣ Credit spreads remain tight – the bond market is not pricing systemic stress.
2️⃣ Forward 12‑month earnings are still set to grow – the earnings line that explains returns over decades is still sloping up, not rolling over.
3️⃣ GDP is still expanding – noisy, but not contracting.
4️⃣ The Fed is still your friend – not actively hiking, not adversarial to risk assets.
On days like the recent pullbacks, the first question is always: “What actually changed?” Most of the time, the honest answer is: price. Price is almost always the fastest‑moving variable; fundamentals rarely move as quickly as the tape except in COVID‑style shocks. If spreads haven’t blown out, earnings estimates aren’t collapsing, the economy isn’t contracting, and the Fed hasn’t turned hostile, then rapid drawdowns are volatility doing what volatility does—not a trend break.
That’s why chasing the latest hot sector is such a trap. Rotation has kept this bull alive, but chasing the newest winner—especially in commodities, which are price takers, not price setters—is how investors end up holding fool’s gold. Commodity spikes tend to be temporary and unsustainable relative to structurally advantaged, high‑margin, innovation‑driven leaders. Large‑cap growth dips, by contrast, should be bought—if your expectations are set correctly in advance. Right expectations let you act on cheaper prices instead of freezing in investor rigor mortis waiting for “even cheaper” entries that never come. The only way to capture the full upside of a secular bull is to be systematically buying through the downside, not attempting to surgically sidestep every pullback.
And hovering over all of this is the long‑run reality: over more than a century, the stock market and corporate earnings have moved together with roughly a 98% correlation. Price is just the earnings chart with mood swings. The rotation, the volatility clusters, the geopolitical spikes in gold and Bitcoin, the never‑ending recession calls—all of that is noise layered on top of one simple truth: if earnings continue to grow, the market eventually follows (not necessarily within the calendar year, inflation trend and starting point more indicative shorter term.)
Market Mania #24, then, is about resisting the temptation to trade the heart monitor and instead managing the health of the plan. Leadership in the headlines may look muddled, but the true leadership—technology‑driven earnings power, tight credit, expanding GDP, and a non‑adversarial Fed—remains intact.
The job now isn’t to guess whether this will be the second “4 ATHs and done” year since 1950, but to align behavior with the four North Stars, a written playbook, and the willingness to buy into volatility. Failing to plan around that reality is still planning to fail.
CHART(S) OF THE WEEK
🏆 TODAY’S CHART OF THE WEEK WAS SHARED BY THE LEUTHOLD GROUP (@LeutholdGroup):
🏆 CHART OF THE WEEK: The Momentum vs Value Paradox
This week’s analysis synthesizes the fundamental strength of the S&P 500 with the tactical discipline of the Leuthold Group’s “Bridesmaid” and “Cheapskate” tactical allocation strategies. While the market is currently fundamentally guided by record earnings beats, the long-term data suggests that navigating the 2026 landscape requires a shift from chasing the “Bride” to respecting momentum persistence and deep-value triggers.
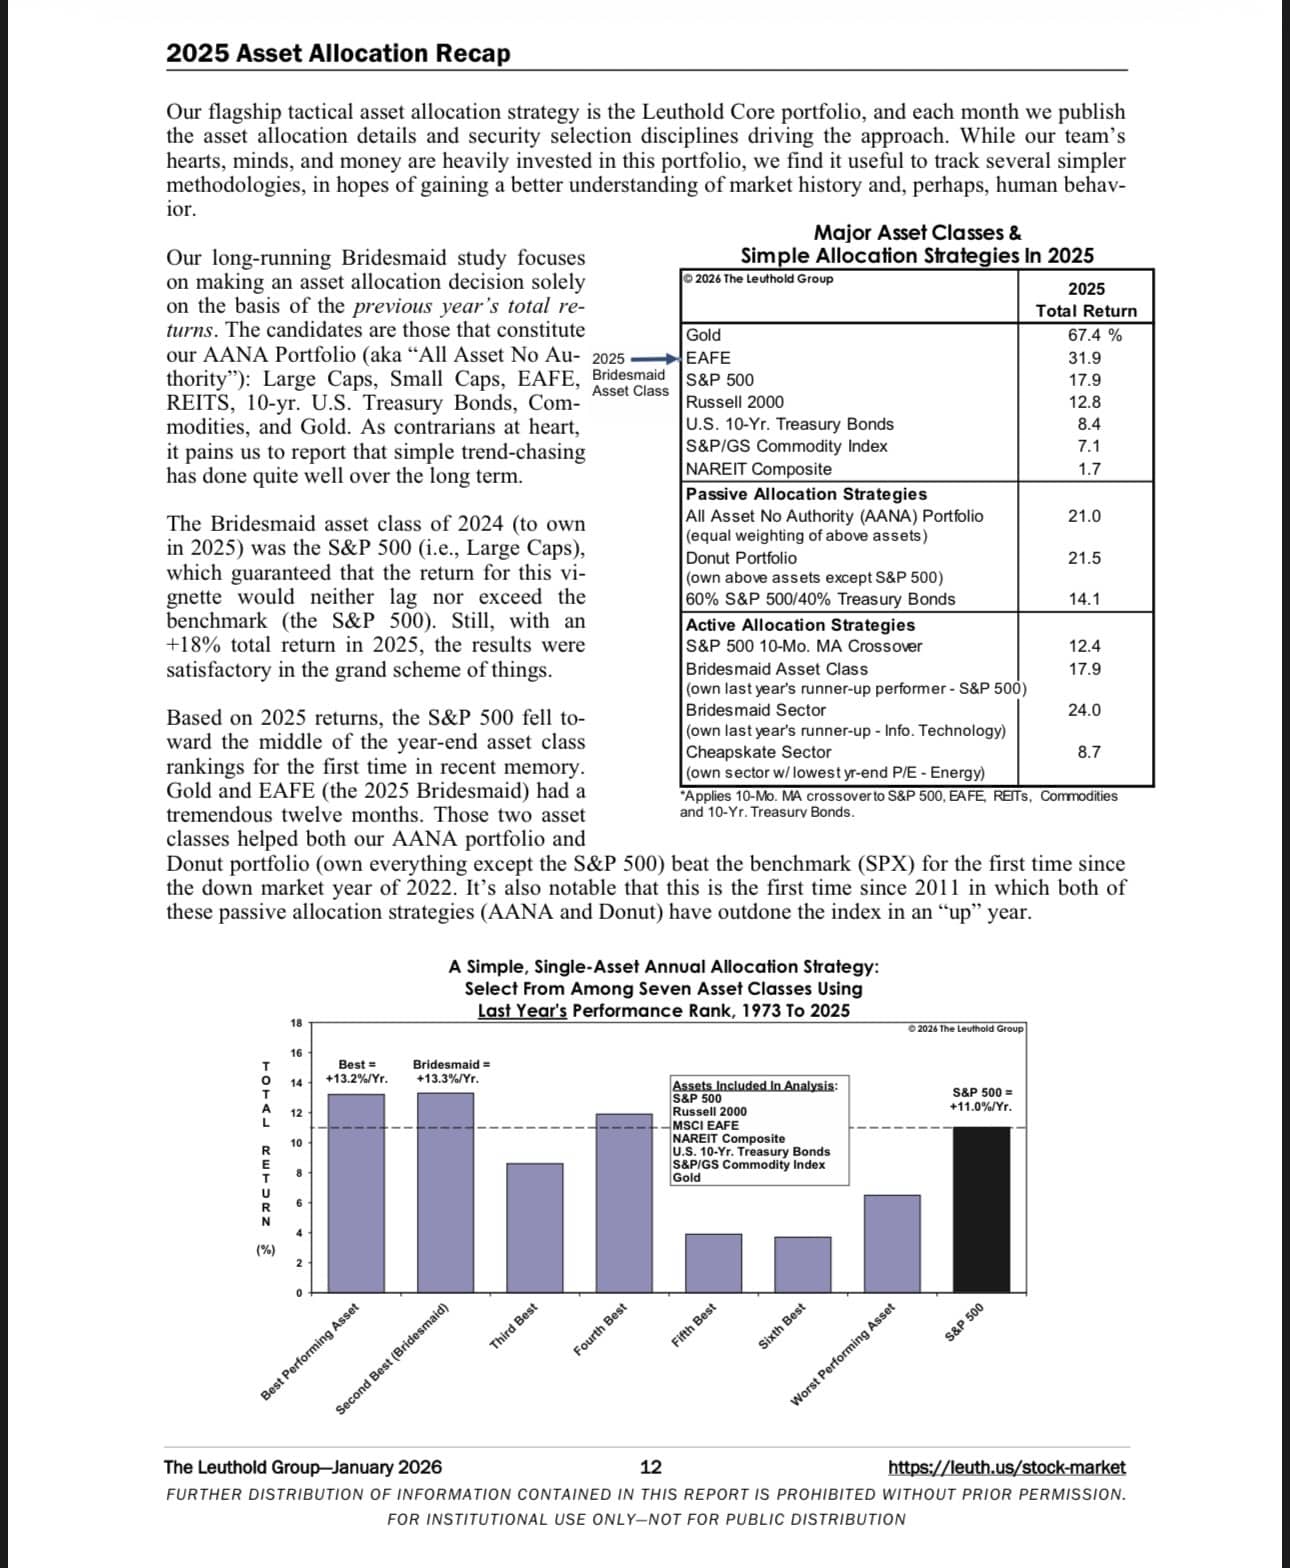
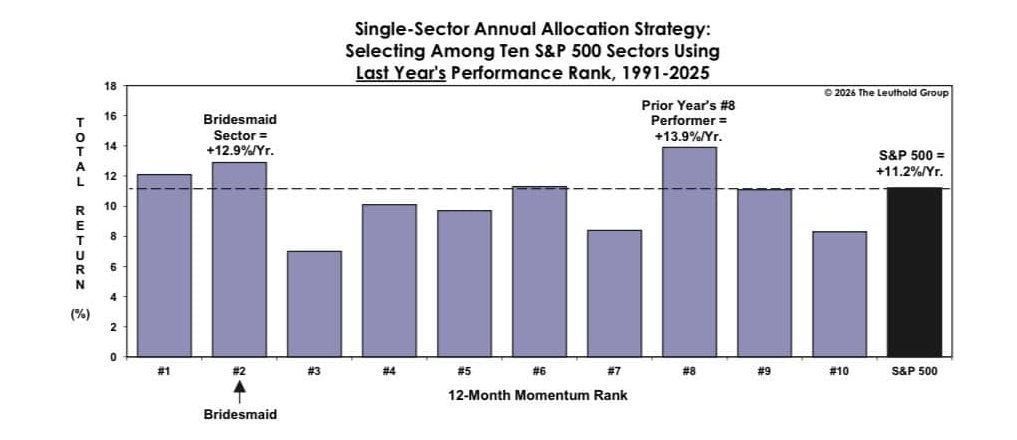
1. The “Bride” Trap: The Risk of Yesterday’s Winner
The “Bride” represents the #1 performing asset class or sector from the previous year. While intuitively attractive, the data from Leuthold Group warns against pure trend-chasing at the peak.
-
Performance Exhaustion: Chasing the absolute leader often leads to buying at the point of maximum valuation and narrative saturation.
-
The 2025 Bride: Gold dominated 2025 with a staggering +67.4% return. However, historical mean reversion suggests that the #1 performer rarely repeats its lead in consecutive years.
-
Bottom Line: History rewards those who avoid the “prettiest” choice in the room, as the Bride is prone to significant underperformance relative to the runner-up.
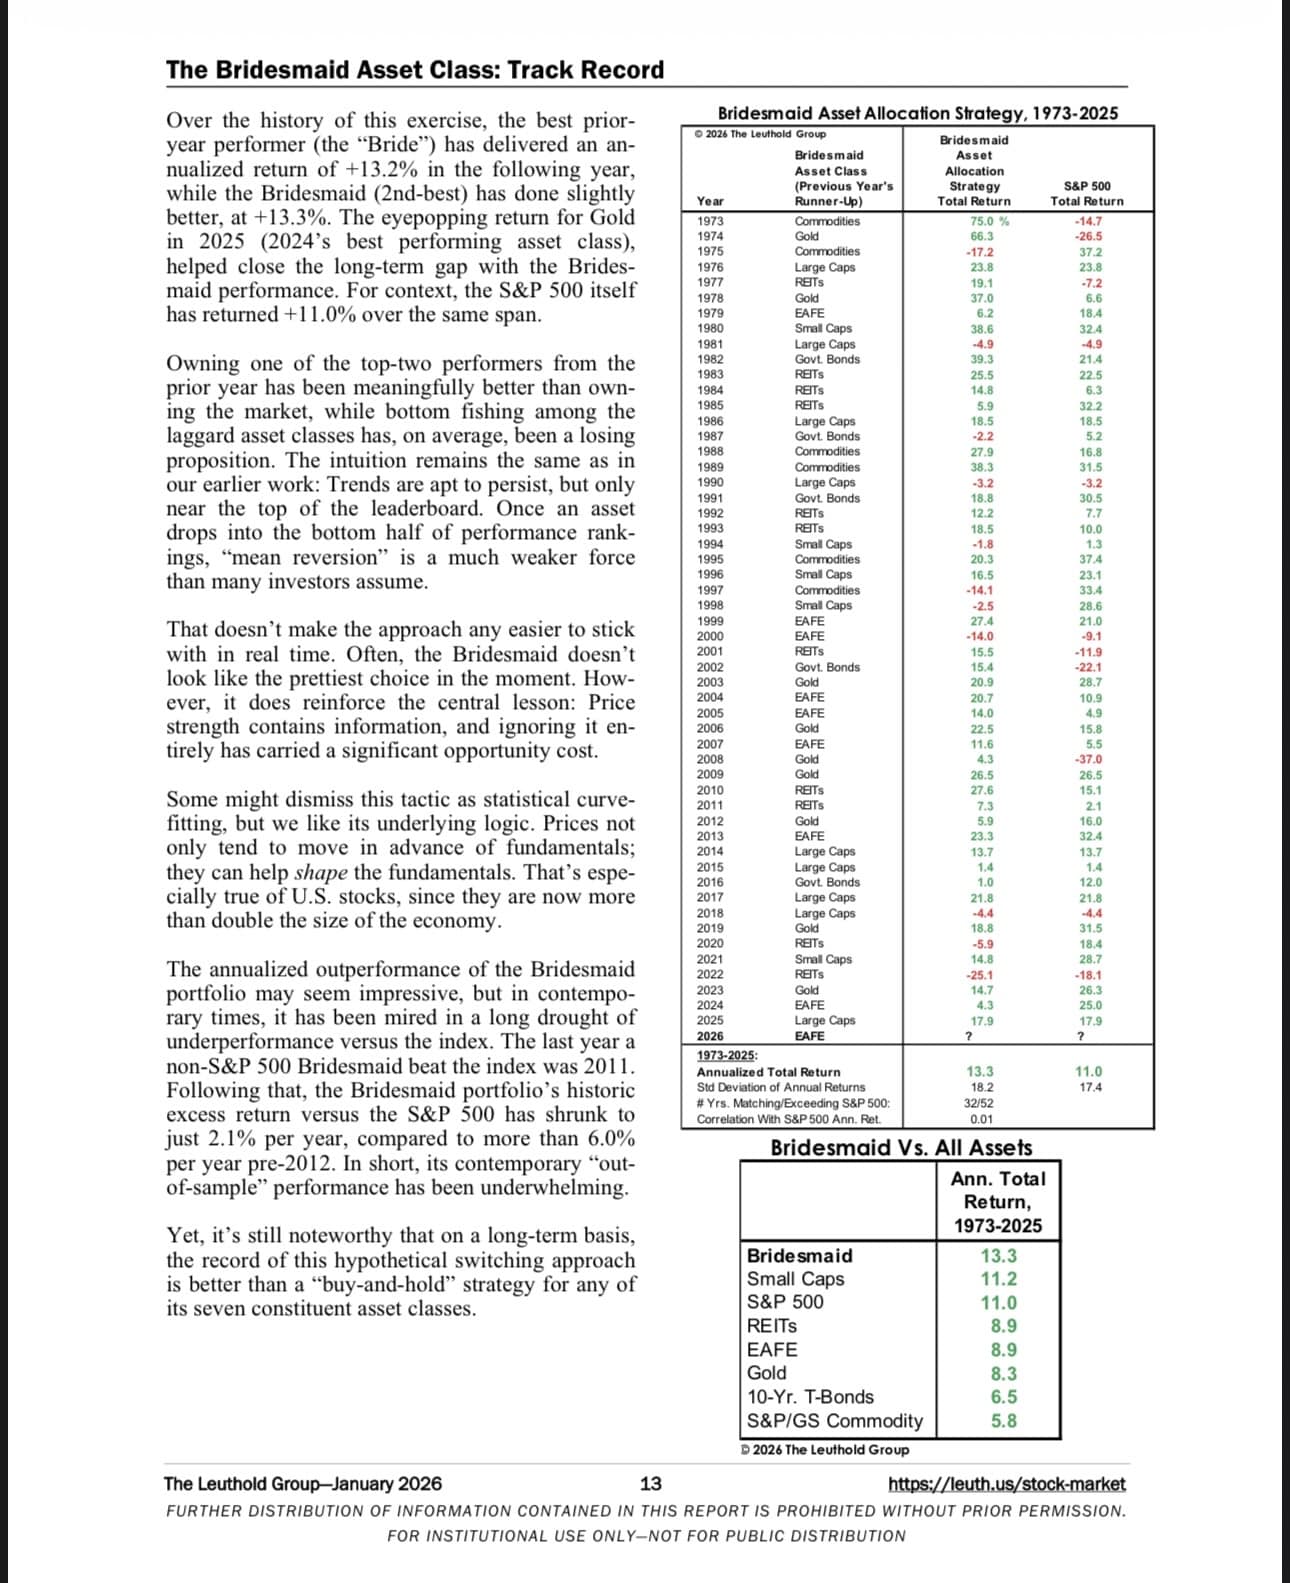
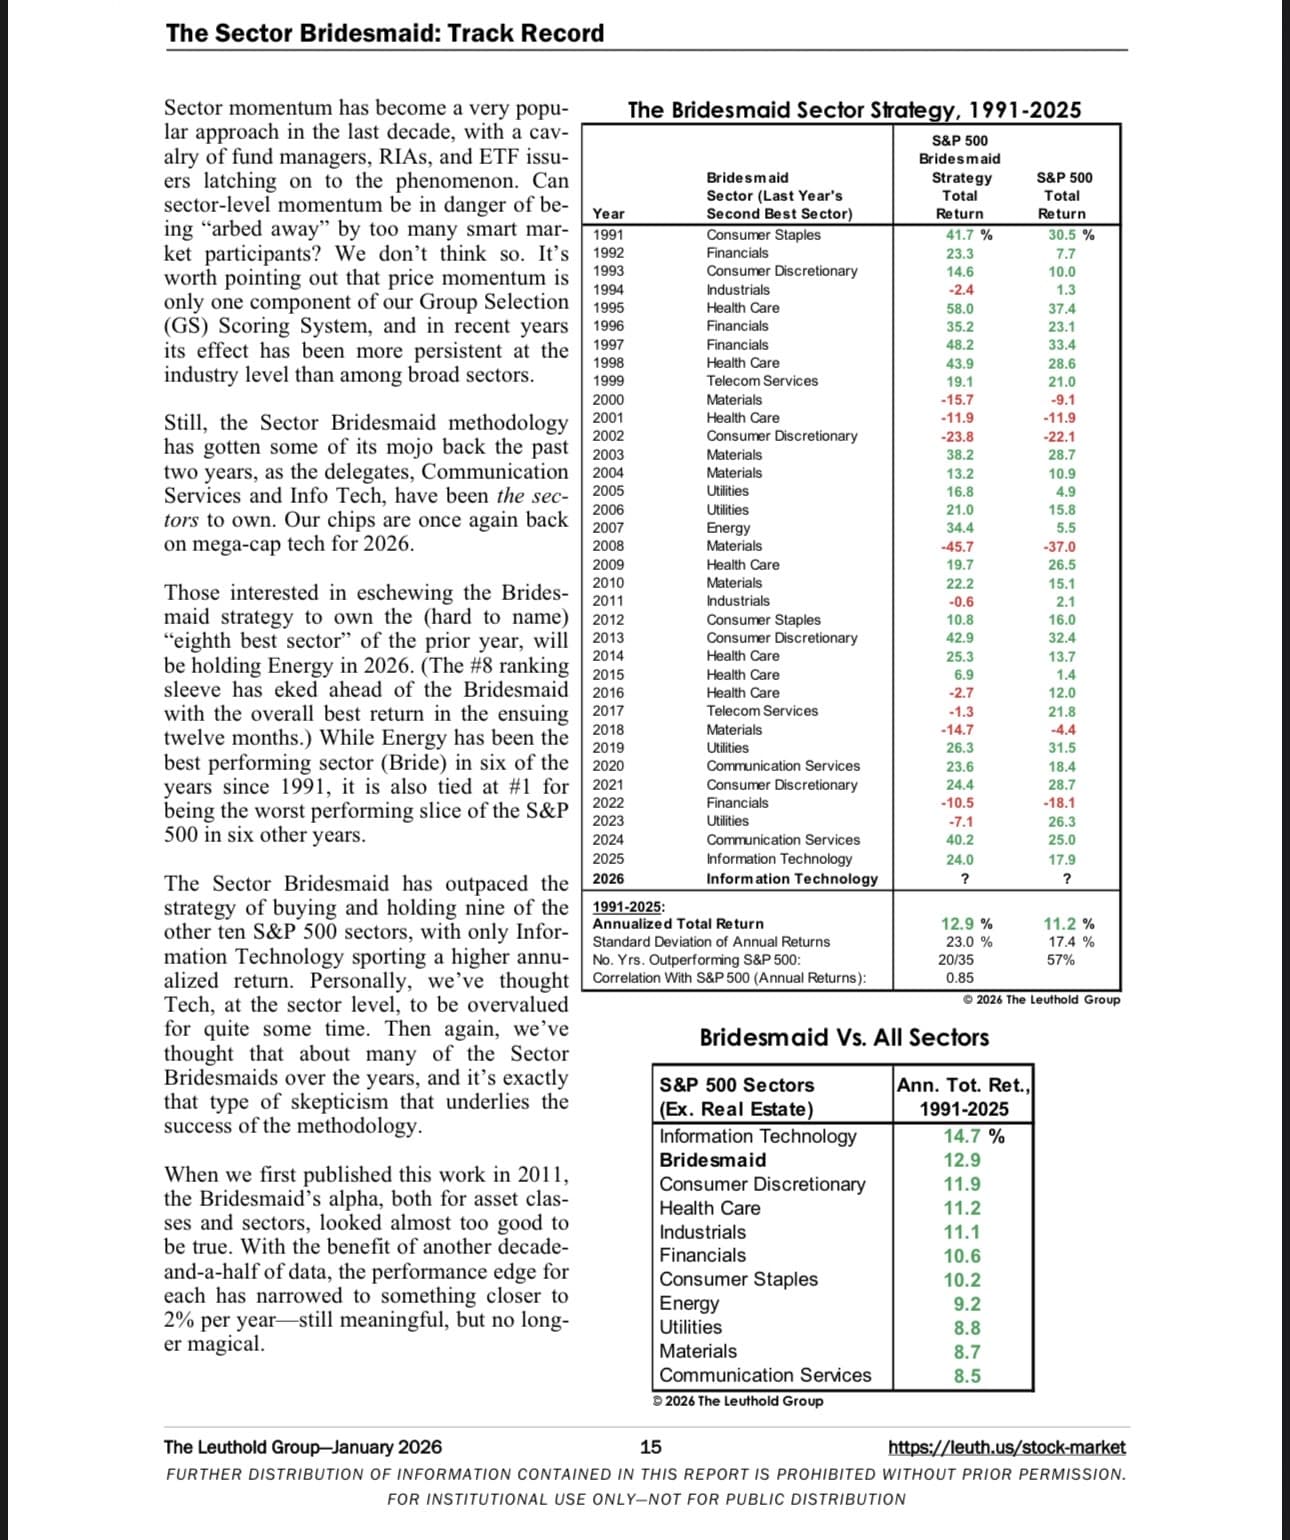
2. The “Bridesmaid” & #8 Optimal: Momentum That Lasts (XLK/XLE)
The “Bridesmaid” strategy—buying the previous year’s #2 performer—bets on momentum that has proven strength but hasn’t yet reached a state of “blow-off” exhaustion.
-
The Statistical Lead: Since 1973, the Asset Class Bridesmaid has delivered a +13.3% annualized return, consistently beating the S&P 500’s 11.0%.
-
The #8 “Sweet Spot”: Leuthold’s research identifies the prior year’s #8 performer (Energy…unfortunately) as the ultimate alpha generator, returning an average of +13.9% per year since 1991. This spot typically captures sectors beginning a fresh recovery cycle.
-
2026 Selection: Information Technology repeats as the Sector Bridesmaid, having finished #2 in 2025 with a +24.0% return.
3. The Active Signal: 10-Month Moving Average Crossover
To time these rotations, active managers utilize the 10-Month Moving Average (MA) Crossover as a trend-following filter.
-
The Crossover Logic: A “Buy” signal is triggered when the index price closes above its 10-month MA; a “Sell” signal occurs when it drops below.
-
Tactical Benefit: This signal has historically helped the “Active Bridesmaid” strategy deliver a +12.4% return, providing a defensive buffer during bear markets while participating in the bulk of the gains.
-
Current Status: With S&P 500 earnings growth estimates surging from 7.3% to 10.7%+, the major indices remain firmly above their 10-month MAs, keeping the “Green Light” on for momentum strategies.
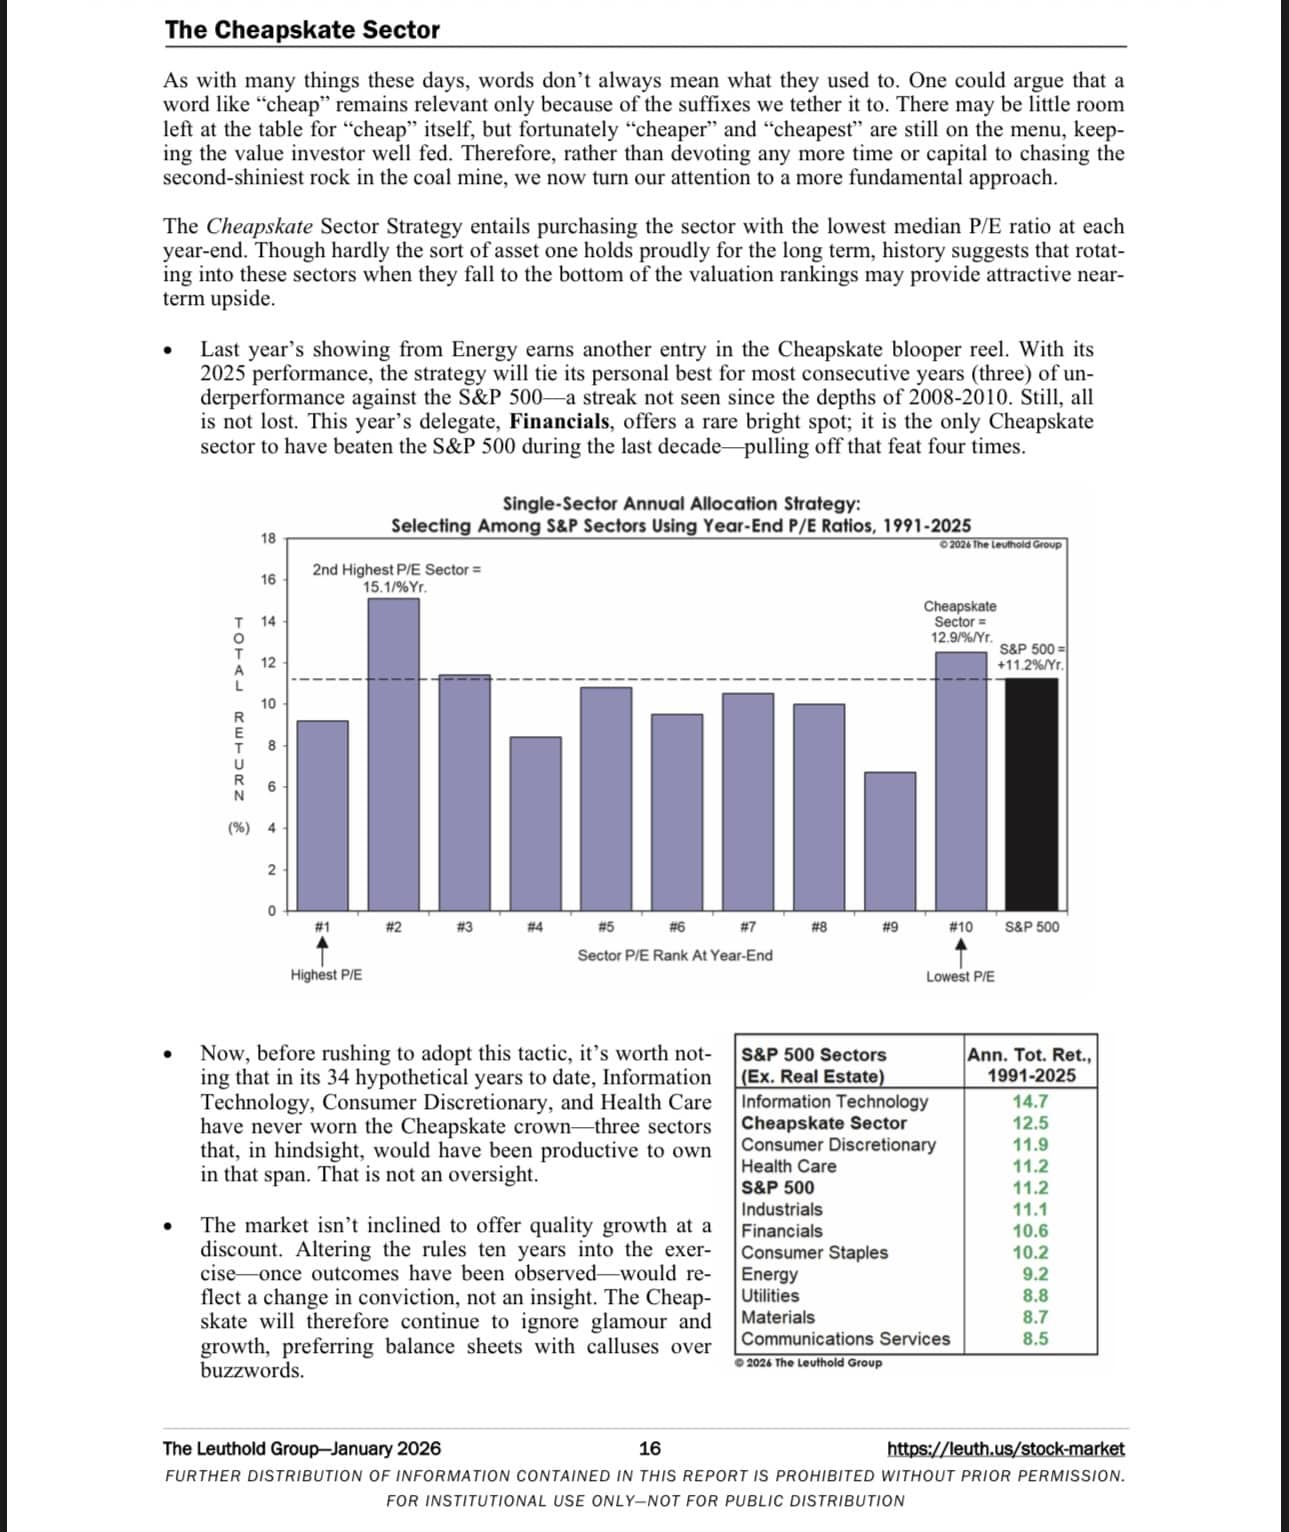
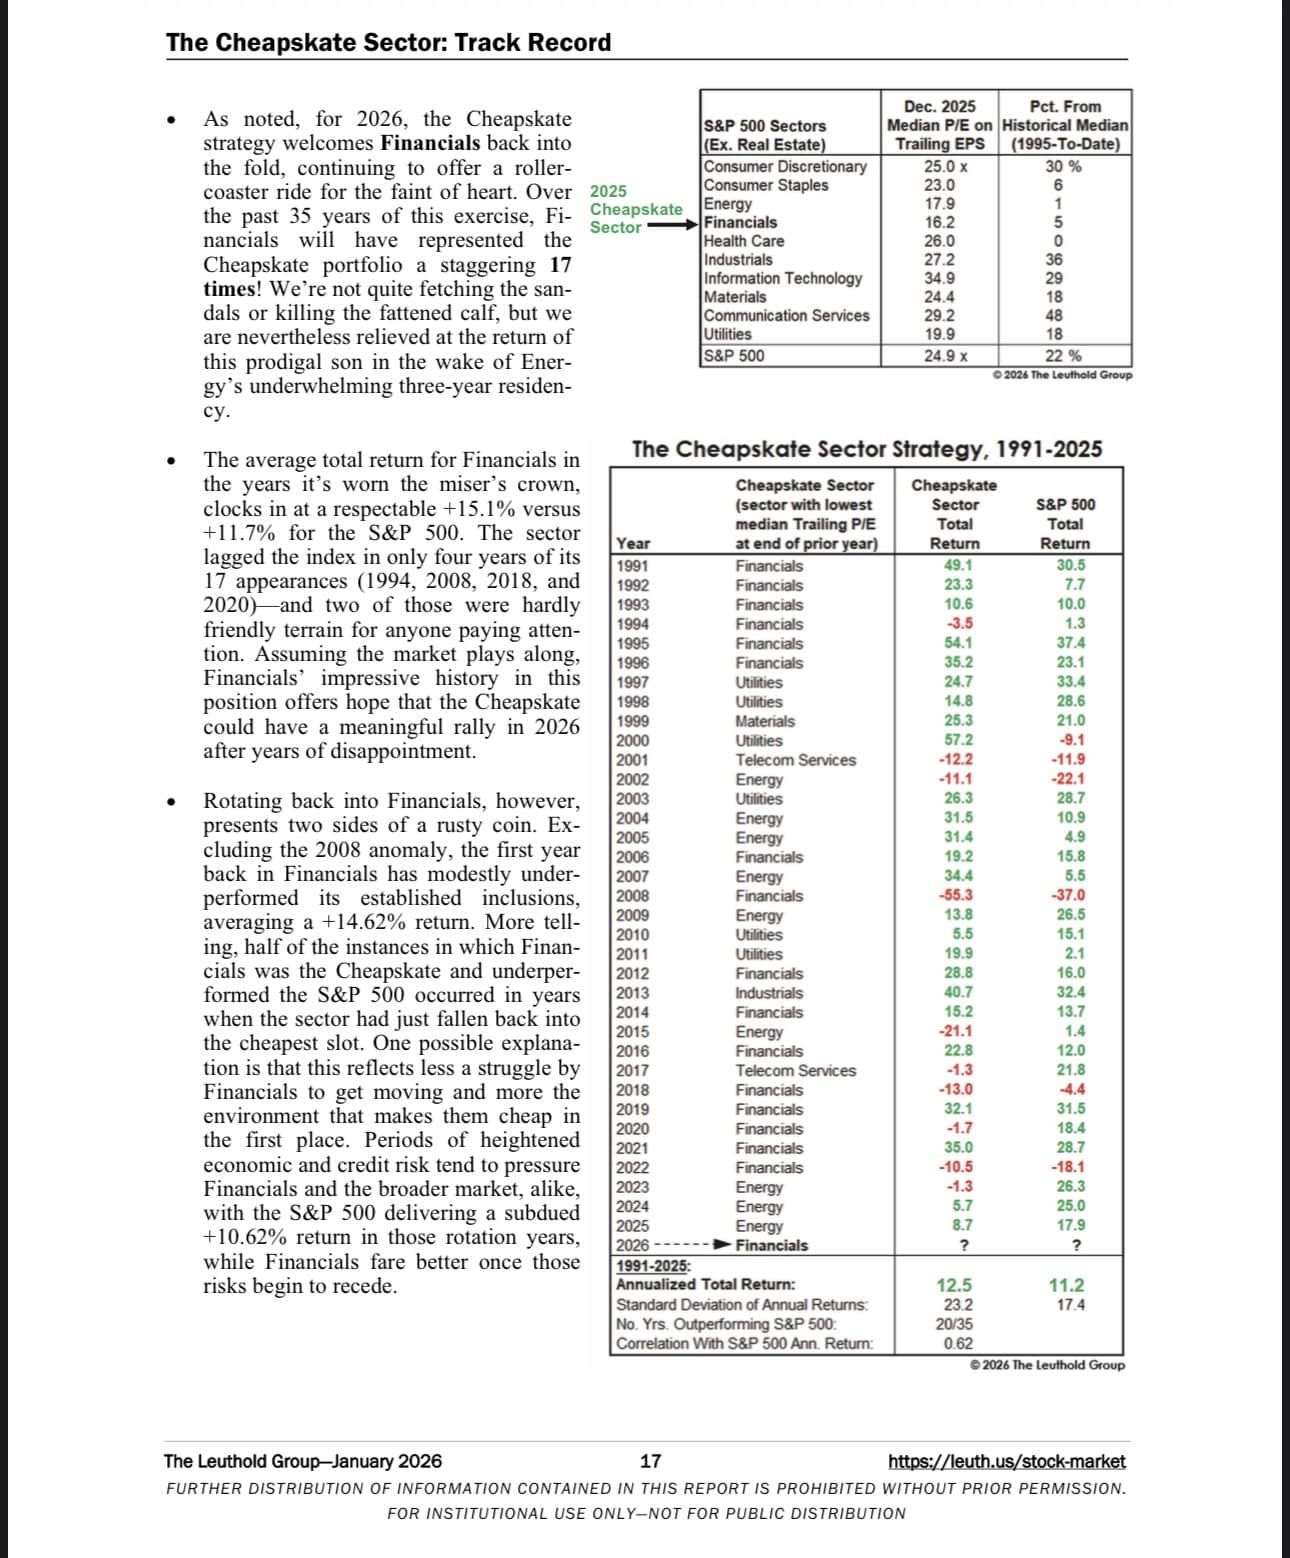
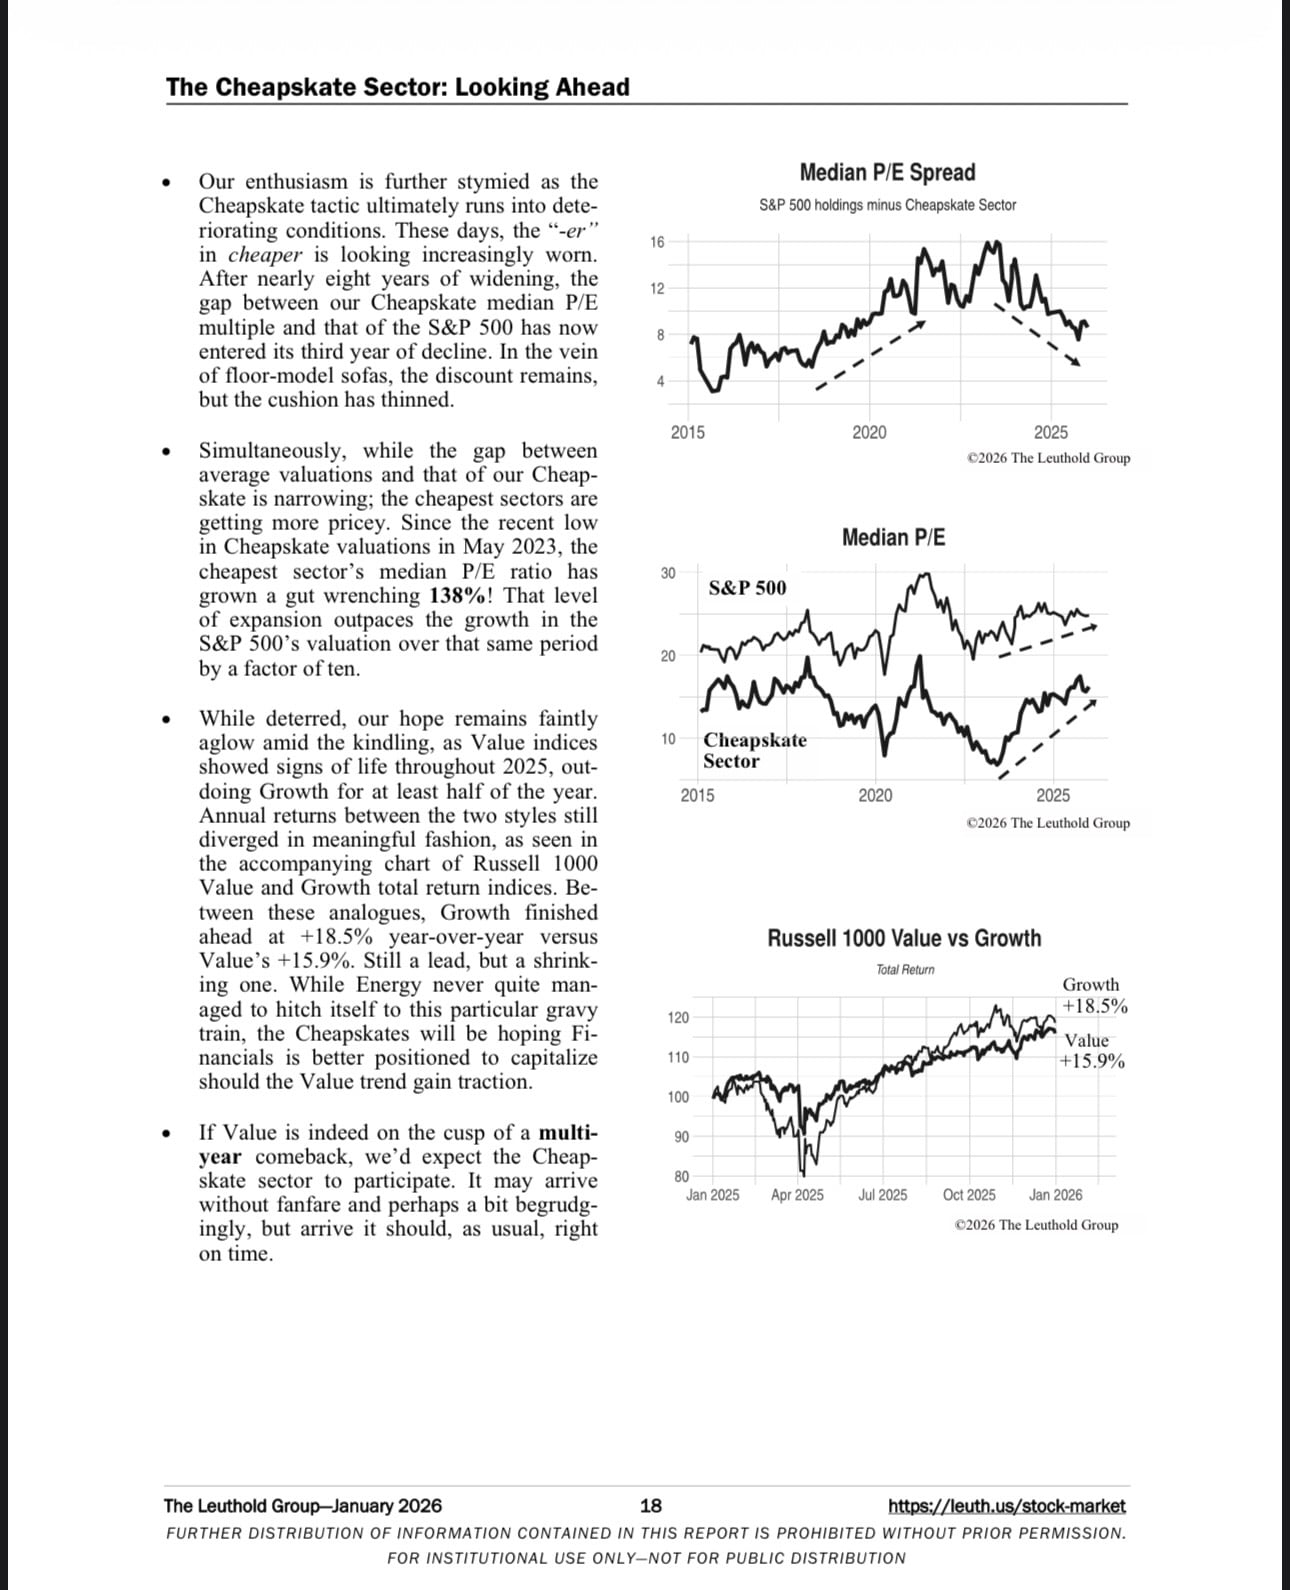
4. The “Cheapskate” Opportunity: Financials (XLF)
The Cheapskate strategy targets the sector with the lowest median Trailing P/E, offering a contrarian hedge to the market’s extreme concentration.
-
The Delegate: Financials (XLF) is the 2026 Cheapskate, trading at a median P/E of 16.2x—a 5% discount to its historical median.
-
Counter-Trend Strength: Financials is the only Cheapskate sector in the last decade to beat the S&P 500, averaging +15.1% in years it wears the “miser’s crown”.
-
The Valuation Gap: While the S&P 500 trades at a 22% premium to historical norms, XLF offers a “floor-model” discount for value-conscious investors.
💡 THE BOTTOM LINE
The 2026 playbook is a “conjunction of strength and discipline.” Respect the momentum of Info Tech ie XLK (the persistent Bridesmaid), but use the 10-Month MA as your exit ramp if the trend breaks. Most importantly, consider diversifying into Financials (XLF). As the Cheapskate delegate, it provides a crucial valuation hedge in a market that has never been so dependent/bifurcated on so few names.
We would like to extend our sincere gratitude to The Leuthold Group for the exceptional research and historical data provided in this analysis. Their proprietary studies, including the “Bridesmaid” and “Cheapskate” strategies, offer invaluable tactical insights that allow investors to look past surface-level market noise and focus on proven statistical signals. We deeply appreciate their commitment to producing such high-caliber, institutional-grade work, which serves as a vital resource for navigating complex market cycles with discipline and clarity. For more of their industry-leading perspectives, we encourage you to visit their website at https://www.leutholdgroup.com/ for more infromation
BONUS:
No Leadership
There are outperforming areas of mrkt, but that isnt leadership as mrkt continues struggle w/in uptrend. $OEX/ $SPX performance continues lower. Steepness of ascent leads to corrective price action. If taking place in context of mrkt rotation supported by GDP and… pic.twitter.com/fanCuq5eSO
— Seth Golden (@SethCL) January 14, 2026
🚨The good, the bad, and the UGLY
Good: Value Line Geometric Index major breakout
Bad: More stocks are participating… at the expense of
Large-cap/Growth, which curtails index gainsUgly: First warning⚠️signal in Dec 2025 to strategist
price targets… pic.twitter.com/gKrEYnFdqJ— Seth Golden (@SethCL) January 8, 2026
QUOTE(S) OF THE WEEK
$SPX https://t.co/Vr3FDlCqs1 pic.twitter.com/eHCHL8gpPq
— Finom Group AYNI Luis Solórzano (@aynirealtor) January 8, 2026
“The complicated part of @POTUS’ social media posts is investors never know what will actually become policy. Considering the boldness of Trump’s foreign policy agenda thus far in 2026, I think investors should take him seriously. This is an election year & these mid-terms are…
— Schaeffer's Investment Research (@schaeffers) January 8, 2026
Goldman: We expect another year of solid gains for US equities in 2026. We forecast an S&P 500 total return of 12% to a year-end level of 7600.
Earnings growth accounted for 14 pp of the 16% S&P 500 price return in 2025 and has accounted for 8 pp of the 9% annualized gain for… pic.twitter.com/JtQZ64gnzV
— Neil Sethi (@neilksethi) January 8, 2026
Markets spent all of Q4 2025 convincing investors that 2026 would be mediocre at best.
It worked.
The next step is convincing investors that every pull back during 2026 fulfills the promise of mediocrity and potential catastrophe.
This will work, as well.
— Zenolytics (@AMeshkati) January 8, 2026
Fed chairman Jerome Powell will likely go down as one of the best performing Fed chairman in U.S. history… 1 of only 3 to deliver a soft and no landing monetary policy cycle performance and only 1 recessionary month within 8-year term.
Aforementioned is an opinion, not…
— Seth Golden (@SethCL) January 7, 2026
Fintwit archive, 2015. pic.twitter.com/bIRNSznuxP
— Ed Borgato (@EdBorgato) January 8, 2026
“In a nuclear war, the living will envy the dead.” – Khrushchev
— Morgan Housel (@morganhousel) January 6, 2026
"…customs brokers and lawyers are advising companies to at least have their import records in order for a refund."https://t.co/PGEwFKnrw0
— Ed Borgato (@EdBorgato) January 8, 2026
The amount of locking in and discipline it takes to change your life is crazy… But it's possible.
— The Daily Dose of Discipline (@tddodiscipline) January 8, 2026
“Any damn fool can make it complex. It takes a genius to make it simple.”
— Ray Dalio pic.twitter.com/iwcFe9e6jP
— Reads with Ravi (@readswithravi) January 7, 2026
All progress is slow.
All breakthroughs take time. pic.twitter.com/ZyuSjWexxm— sysls (@systematicls) January 8, 2026
Nomura's Charlie McElligott : Tapping the sign⚠️
"If you're short VOL you make money, but eventually die! But if you're long VOL, you die before you make money!"$SPX $SPY $VIX $UVXY $SVIX $QQQ pic.twitter.com/KUHSlSFWqj
— Seth Golden (@SethCL) August 8, 2024
“The distance between deciding and doing is the single most reliable predictor of whether your life will be extraordinary or ordinary.”
These three paragraphs will change your life: pic.twitter.com/eXJqDOAJI0
— Anthony Pompliano 🌪 (@APompliano) January 11, 2026
Dimon in JPM's last four earnings announcements. Economy resilient. Uncertainty heightened. Hope for the best. Prepare for the pic.twitter.com/lTGAAPuV6E
— Sam Ro 📈 (@SamRo) January 12, 2026
"Most expect the U.S. stock market’s growth streak to continue in 2026, fueled by rising earnings, falling interest rates, government stimulus, and consumer spending." @barronsonline pic.twitter.com/BPvUH4H4lR
— Sam Ro 📈 (@SamRo) January 12, 2026
Yea but credit card debt
Yea but manufacturing recession
Yea but the yield-curve
Yea but leading economic indicatorsDoes Warren Buffett worry himself about such Macro-economic issues when allocating capital?
Short answer: NO…and why?$SPX $SPY $QQQ $DIA h/t @SamRo pic.twitter.com/bli1nAshxN
— Seth Golden (@SethCL) September 26, 2023
“I have not failed, I’ve just found 10,000 ways that won’t work.”
– Thomas A. Edison pic.twitter.com/VuexfPhL7J
— Finom Group AYNI Luis Solórzano (@aynirealtor) January 11, 2026
If Newsletter Writers and Economists Were Honest
"Next recession will be due to an exogenous or endogenous shock, again. This is hard stuff. End of Report."
— Seth Golden (@SethCL) January 13, 2026
Just a reminder that it does work both ways… pic.twitter.com/USyh8BJtSD
— Walter Deemer (@WalterDeemer) January 13, 2026
“Doing the right thing and the hard thing are often the same…
But you will get an even greater reward.”
– Gabby (Bachelorette) @TheTraitorsUS
— Finom Group AYNI Luis Solórzano (@aynirealtor) January 14, 2026
Via @SethCL: “It’s not leadership change, you have no leadership!”$VUG $XLK $XLG $MAGS $RSP $RSPT $XLE $XLC https://t.co/jzdOWpsRxf
— Finom Group AYNI Luis Solórzano (@aynirealtor) January 8, 2026
TOP 10 TWEETS OF THE WEEK
If you bought the S&P 500 at the peak of the dot-com bubble (March 2000) and held, you'd have a 7.5 to 8% long-term annualized return today.
That's why I'm not worried about whether or not there's an AI bubble.
If you're a long-term investor (20+ years), you can weather the…
— Paula Pant (@AffordAnything) January 7, 2026
Citadel's Scott Rubner: RISK ON!!
Vibes: pro-growth, pro-cyclical, pro-expansionary.
Implied correlations approaching 1-yr lows, a signal of healthier market structure…
Only thing clients aren't actively buying; TECH!$SPX $QQQ $SPY $NDX $XLK $AAPL $MSFT $AVGO $NVDA $IWM… pic.twitter.com/Es2wRxrsry
— Seth Golden (@SethCL) January 8, 2026
When the S&P 500 makes at least one new ATH and closes positive in the first 5 trading days of January, the year ends higher 80% of the time, with a median gain of 13%. The average price path shows a softer Q1, while July and December lead with 80% positivity. $SPX pic.twitter.com/asqzD6SfPF
— Bluekurtic Market Insights (@Bluekurtic) January 7, 2026
Earnings have grown at a 14% 5-year CAGR, which is about as good as it ever gets. pic.twitter.com/yfCrkAgZ6p
— Jurrien Timmer (@TimmerFidelity) January 7, 2026
$IWM +2.4% YTD $SPY +1.1% YTD$QQQ +.3% YTD $RSP +1.6% YTD
If compounded quarterly through 2026, it steals roughly 8ppts from S&P 500’s potential annualized return.
When you ask for less concentration, be careful what you’re asking for!
— Seth Golden (@SethCL) January 8, 2026
SOX divergences have preceded 4 of 7 cycle tops since 2007. Today’s confirmation supports bull-market continuation but doesn’t negate the bear case. SOX leadership combined with broadening participation and youthful momentum, however, is a constructive brew, by my reckoning. pic.twitter.com/DztbC0c0L4
— Mark Ungewitter (@mark_ungewitter) January 13, 2026
Lag-7: Worth watching this potential Diamond or complex Head-and-Shoulders pattern, given outsized market weight. pic.twitter.com/o5yjGgXwrZ
— Mark Ungewitter (@mark_ungewitter) January 14, 2026
Stocks don’t necessarily struggle when they’re overbought. Looking at $SPX, periods with RSI above 70 have delivered strongest 12-month forward returns, along with a 90%+ positive hit rate. Overbought conditions have often reflected sustained momentum rather than immediate risk. pic.twitter.com/Dx3BMas0Ip
— Bluekurtic Market Insights (@Bluekurtic) January 8, 2026
Huge surge in productivity growth in Q3 (+4.9% annualized)
Brings 2025 Q1-Q3 pace to 2.3% (annualized)
2023 – '25 (Q3): 2.5% 💪
Well above the prior 18 yr trend
2020 – '22: 1.5%
2005 – '19: 1.6%1996 – 2004: 3.1%
1983 – '95: 1.8%More 👇@CarsonResearch @RyanDetrick pic.twitter.com/GN9XjGa6vh
— Sonu Varghese (@sonusvarghese) January 8, 2026
Risks to 2026 (Seth-Marcus)
SCOTUS strikes down POTUS tariffs
Government Shutdown, again
New Fed Chairman
Midterm-election year scheduled OUTFLOWS
World Cup-economyFundstrat's Tom Lee sees path for markets bottoming fall of 2026 on similar macro-risks. $SPX $ES_F $SPY $QQQ… pic.twitter.com/gPtu3ZRky4
— Seth Golden (@SethCL) December 16, 2025
Any hint of $SPY Equal-Weighted revival ignites sparks of optimism in active managers’ hearts. An EW run like after Y2K Tech Wreck doesn’t seem farfetched. The downside? A bear market would probably be involved. #MAG7 https://t.co/Xt8OH1WHBG
— The Leuthold Group (@LeutholdGroup) January 8, 2026
Good News: On the surface 12-month forward 93% positivity rate is strong
Bad News: Almost all the negative years where both $SPX and $NDX are up 1st 5-trading days came in a Midterm election year!
Ugly News: With 6 bear markets (1994, 1998, 2002, 2018, 2020, 2025)
Volatility… https://t.co/6QGBuCvY2e
— Seth Golden (@SethCL) January 9, 2026
The only thing that went down and stayed down in 2025 was the President's approval rating, stocks rose within weeks.
The epitome of forgive, but not forget!… and here come #midterms2026 and a bigger #Trump-Put? pic.twitter.com/gORKkzw746
— Seth Golden (@SethCL) January 9, 2026
Down April, then a 7-mnth winning streak, then Down December.
1 DOWN, 7 in a row UP, 1 DOWN again. Only 7th time for this pattern.
Never a down month over the next 6 months, not a one!
Every. Single. Time. higher 1-6 months forward.Average returns speak to 7000+ soon$SPX… pic.twitter.com/Ff1iTxniHs
— Seth Golden (@SethCL) January 4, 2026
2026, 2016, 2006 all trigger years. Something about year 6's….$DJI
2026: ???
2016: +13.42%
2006: +16.29%
1996: +26.01%
1986: +22.58%
1976: +17.86%Quite the streak
— Liam (@L1amBellamy) January 10, 2026
Big Mo Tape is one of the indicators in our Rally Watch Report. It's back to 7/14 bullish signals. The fact that the short-term breadth thrust indicators haven't fired isn't surprising. 3/4 short-term tape + 2/3 long-term tape says the trend is bullish. That 2/3 sentiment are… pic.twitter.com/L7y7SBN9Wi
— Ed Clissold (@edclissold) January 10, 2026
While some focus on trying to catch every rotation, swinging and missing, leaving money on the table, I'm playing the long game… and I don't think this breakout is a passing fad!
I will eat cake!$QQQ $SPY $SPX $NDX $COMPQ pic.twitter.com/cV4NC0hsT9
— Seth Golden (@SethCL) January 10, 2026
Just because a chart like $SMH breaks a trendline doesn't mean the overall uptrend is broken. @FrankCappelleri dropping knowledge at Chart Summit 2026. pic.twitter.com/Two1ra27ea
— Stock Market TV (@StockMktTV) January 10, 2026
Worth noting that despite just two Mag 7 stocks outperforming the S&P 500 in 2025, the cohort still drove a large amount of the S&P 500's return in 2025. https://t.co/BN1SQjvgBc pic.twitter.com/0lfXV9Tb5Z
— Josh Schafer (@_JoshSchafer) January 6, 2026
S&P500 did something only Lakers, Bulls, Comets, and Yankees have done…3-peat
15%+ return for 3 straight years has only happened twice before; more recently from 2019 – 2021.
History suggests to keep an open mind in Year 4. Could be up 20%+ or down -20%$SPX $SPY $ES_F $VOO… pic.twitter.com/AN9ffuSw9H
— Seth Golden (@SethCL) January 11, 2026
Really, you're really fading Small-caps? Really?
"And you want to be my latex salesman?"
Buy the dips George, buy the dips…$SPX $RUT $IWM $RTY $TNA $SPY $QQQ $NYA $DIA pic.twitter.com/COcQOQ28V6
— Seth Golden (@SethCL) January 11, 2026
Up 15%+ prior year
Down final week of year
Up 1st 5 days New Year$SPX Jan 12th – Jan 19thn = 7
_________
1986 = +3.4%
1988 = +1.3%
1996 = +2.2%
2009 = +1.2%
2012 = +.9%
2017 = +.9%
2024 = +2.9%Higher. EVERY. SINGLE. TIME.$ES_F $SPY $QQQ $IWM $NDX $VOO $NYA
(Wayne Whaley…— Seth Golden (@SethCL) January 11, 2026
I did this for fun this week since we had @andrewrsorkin on @TheCompoundNews.
It was an amazing episode (linking below).
A 1929-like crash today would take the Dow from 49k to 5k.
Again, this is for fun. Don't come at me. Thank you. pic.twitter.com/bteUE2hMur
— Matt Cerminaro (@mattcerminaro) January 10, 2026
Restaurant stocks up big YTD BofA $EATZ pic.twitter.com/ifYIsW4Rwm
— Mike Zaccardi, CFA, CMT 🍖 (@MikeZaccardi) January 12, 2026
Quick and Dirty Recession Indicator Never Been Wrong
1) S&P 500 $SPX $SPY in downtrend of > than -10%
2) Initial Jobless Claims up +10% Y/YNeither is in place! And that's how distant from recession U.S. #economy pic.twitter.com/Tv8G2DJQ0r
— Seth Golden (@SethCL) January 12, 2026
Household Checkable Deposits over last 25 years.
Perspective matters! https://t.co/UHIrMiogx0 pic.twitter.com/K9Z0FH2mkf
— Seth Golden (@SethCL) January 12, 2026
The S&P 500 has surged past a crucial 100-year long trendline resistance.
Could this signal a true breakout, or is it a bull trap?
The upcoming market action will be critical in shaping the stock's direction for the rest of the year. If the S&P 500 falls decisively below… pic.twitter.com/tTG7SpACkH
— BraVoCycles Newsletter (@BraVoCycles) January 12, 2026
Apple’s smartphone market share jumped to a world-leading 20% in 2025, overtaking Samsung for the top spot globally per Counterpoint.
It was a huge year for $AAPL.. and 2026 could be even BIGGER if the company executes on a few key fronts, per Dan Ives @DivesTech of Wedbush 👇 pic.twitter.com/bYxwKjVEqu
— Schaeffer's Investment Research (@schaeffers) January 12, 2026
Add in fundamental momentum.
Fundamentals are starting to inflect.
Small caps are seeing the strongest upward revisions to growth estimates heading into 2026. That’s why our view on small and mid caps isn’t only about what’s cheap. It’s about what’s improving. That rate of… pic.twitter.com/tql51NKzzz
— Sean D. Emory (@_SeanDavid) January 13, 2026
New research from the @stlouisfed shows that AI investments comprised 39% of US GDP growth through the first 3 quarters of 2025. At the height of the Dot Com boom in 2000, Tech-related investments were 28% of GDP. The US economy, like its stock market, is heavily levered to AI.
— Nick Colas & Jessica Rabe (DataTrek) (@DataTrekMB) January 13, 2026
Want to build long-term wealth?
Be an owner, not a lender.
Stocks are far more likely to double your money in any given decade than bonds or cash. pic.twitter.com/9Iz88aQqsa
— Peter Mallouk (@PeterMallouk) January 13, 2026
Early strength Midterm year is typical. It can lure investors/traders into sense of false confidence. $SPX typically peaks early Q2 and before a protracted correction.
Volatility $VIX rising w/SPX in early part of Midterm is signal of pullback/correction to come, on average.… pic.twitter.com/drIfMubaHV
— Seth Golden (@SethCL) January 14, 2026
BofA's Savita Subramanian:
"Boom earnings years have seen LOWER price returns than normal, as equities ANTICIPATE rather than react."
FY2026 consensus EPS +15% growth, in the highest Quintile, which sees LOWEST annual returns on average. pic.twitter.com/iIjvFgS9xs
— Seth Golden (@SethCL) January 13, 2026
Individual performance of the S&P 500 $SPX and Russell 2000 $IWM)following periods when the Russell 2000 outperforms the S&P 500 for 8 consecutive days. pic.twitter.com/He9oMWfVqa
— Bluekurtic Market Insights (@Bluekurtic) January 13, 2026
3-month Implied Correlation at 8-month lows, although ticked up recently.
The urge to hedge against mkt uptrend and mkt all-time highs has been a foolish exercise 8 months and counting.
Hedging is not a discipline outside of cash, its a necessary self-reflection signal.$SPX… pic.twitter.com/S9z4xyNxiS
— Seth Golden (@SethCL) January 14, 2026
Consumer Staples $XLP aren't sexy?
Tell that to Walmart $WMT which found itself in the Nasdaq100 $QQQ $NDX
Since 2011 whenever XLP finished a year in bottom 3 of $SPX sectors, next year saw strong gains. This occurred 2013, 2017, 2025, with XLP delivering 10%+ gains each time.… pic.twitter.com/GoaN7axZJt
— Seth Golden (@SethCL) January 13, 2026
JOIN THE FINOM GROUP FAMILY – CLICK HERE TO UPGRADE NOW!
Master the markets with Seth Golden and our “Finominals” community! For just $29.99/month, unlock weekly 5000+ word macro research reports packed with charts and actionable insights. Go Premium at $84.99/month for daily Telegram Traders Corner, myth-busting Zoom sessions, and live 1%+ scalp/swing trading with Seth. Don’t let market noise win—join our Contributor or Premium Membership to build confidence and achieve your financial goals.
[Click here for a free Morning Market Setup sample from January 12th 2025!]
FINOM GROUP – RECENT REPORTS
November 30, 2025 – 2026 FULL YEAR MACRO-MARKET OUTLOOK RESEARCH REPORT
December 14, 2025
December 21, 2025
December 28, 2025
January 11, 2026
Sniffing 7,000 With the Bulls… And Then Some?
YOU’RE ALL CAUGHT UP NOW. THANKS FOR READING!
If you have any questions, feel free to message Seth Golden or contact us support@finomgroup.com
Comment below or tag us on X (@FinXWeekly) with your thoughts—your feedback drives our innovation.


