
"You only get paid to take risk, not to know there’s always risk about the markets."

 "This dollar-cost-averaging exercise is why I often suggest there is no such thing as a bad market, only lost opportunity. It’s the lost opportunity that investors often accrue and compound, with great misfortune."

"I’m not competing for World’s Smallest Drawdown. I’ve never seen such a trophy ceremony; have you?"

– SETH GOLDEN, CHIEF MARKET STRATEGIST AT FINOMGROUP.COM

(CONTRIBUTOR/PREMIUM MEMBERS ONLY)

MID-WEEK SUMMARY
FRIDAY, FEBRUARY 6, 2026
Welcome to Market Mania #26! – Is DCA dead? ☠️
The Death of DCA has been Greatly Exaggerated
Welcome back, folks.
If I had a nickel for every time the market pulled back 2% and my inbox flooded with questions asking if “the process is broken,” I’d have enough liquidity to buy this dip all by myself. 🤣‼️
As we close out the first week of February, with the S&P 500 and Nasdaq down for the year and the Magnificent 7 (save for Apple) coming under pressure, the narrative machine is in overdrive. The headlines are screaming, the “Yea-But-ers” are out in force, and the question of the hour seems to be: “Is Dollar Cost Averaging (DCA) Dead?”
Let me answer that with the same black-and-white candor you expect from Finom Group: DCA isn’t dead; your behavior is just being tested.
We warned you. In our January 18, 2026 Research Report: Quickly Going Nowhere, With A Dirty Market Dynamic, we explicitly discussed the “structural impairment” taking shape in parabolic assets like Silver and Crypto. We told you that when a parabolic move collapses, as Silver did with a 30%+ downward spiral, it forces a liquidity event. Broker-dealers hunt for cash to satisfy margin, and where do they find that liquidity? They pull it from the equity markets.
That is exactly what you are seeing right now. This volatility isn’t about the economy imploding. It isn’t about earnings collapsing. It is a structural liquidity event rippling through asset classes.
So, why does DCA feel “dead” to the average retail trader right now? Because most people do mental gymnastics instead of math. They come into the year over-leveraged, with no cash on the sidelines, and then freeze when the opportunity they claimed they wanted actually arrives.
At Finom Group, we came into this week with roughly 55% cash, explicitly willing and able to take advantage of asset classes consolidating under the guise of improving corporate fundamentals. While others are panic-selling because the Nasdaq is down ~3% this week, we are leveraging 2% to 3% of that cash to buy cheaper valuations. Dribs and drabs!
Here is the reality the “doom and gloom” crowd is ignoring:
1. Stop the Mental Gymnastics: The Fed is Not Hiking
Let’s cut through the noise. The most dangerous form of mental gymnastics investors are engaging in right now is conflating this volatility with the Midterm-election years of 2018 or 2022. In both of those instances, the Federal Reserve was an adversary, hiking rates throughout the calendar year. Today? The Fed is not hiking. We are in an expansion cycle with positive GDP and double-digit earnings growth,. History shows that when the Fed is friendly during a Midterm-election year, the market performs significantly better than when they are hostile,. Everything else is just noise filling airtime, or else financial media would cease to exist!
2. The Quants Have Failed—And That is the Signal
We deal in facts, not feelings. And the facts are that as of this week, key quants (specifically the Technology quant and the NYSE breadth quant) have failed. When high-probability quants fail, it doesn’t mean the world is ending; it explicitly identifies that we are in the midst of an endogenous/exogenous VAR (Volatility Adjusted Risk) shock,. These structural liquidity events move fast and break things, causing technicals and short-term signals to fail. But recognizing this as a volatility shock rather than an economic collapse is how you avoid panic selling near the lows.
3. Fundamentals Rule All
While endogeny and exogeny can break technicals and quants in the short term, they cannot alter the long-term correlation between price and earnings (circa 98%). Markets follow earnings over time. Q4 2025 earnings are tracking toward nearly 12% growth, up from the 8.3% estimate, and 2026 estimates remain robust at roughly $311 per share,. If earnings are going up and price is going down due to a liquidity event, that is the definition of value. All else proves inconsequential when the earnings yield is trending higher ie expanding.
If you are not yet a Finom Group member, we invite you to upgrade to contributor/premium membership (starting at $1/day) as we dissect the anatomy of this ongoing liquidity event, review the “1% for 1%+” trading strategy that continues to generate alpha even in a flat market, and explain to members why we are buying/selling the dips and rips in everything from Consumer Staples to Bitcoin.
You can listen to the noise, or you can respect the process. DCA is only dead if you lack the discipline to execute it.
Let’s dive in.
CHART(S) OF THE WEEK
🏆 TODAY’S CHART(S) OF THE WEEK WAS SHARED BY NED DAVIS RESEARCH via SETH GOLDEN (@NDR_Research & @SethCL):
Be Careful What You Wish For & The Midterm Fund Flow Reality
Only 1 other period in history, did 62% or more stocks in S&P500 outperform the index, Dotcom (2000-2002)$SPX is cap-weighted index, it's a math equation; be careful what you wish for (broadening mkt)
*1-month into 2026;put the knife down*$ES_F $SPY $QQQ $DIA $IWM $SOXX… pic.twitter.com/rLamh6wQxQ
— Seth Golden (@SethCL) February 4, 2026
January Barometer was positive. Sigh of relief, but…
Even when January is positive, Midterm year hit rate is only 66%, far worse than any other year
And…Max Drawdown in Midterm w/January Barometer is -12.2%Not reason enough to be a bear, but reason to anticipate… pic.twitter.com/hT5lk0DCO3
— Seth Golden (@SethCL) February 5, 2026
If you’ve been in the trading room or reading our daily notes on X and or Telegram, you know we don’t rely on feelings. We rely on process. We rely on the weight of the statistical evidence and stacking the deck in our favor so we are more right then wrong, regardless of how much we make when were right or wrong! Small wins compound folks, as long as you can allow yourself the time which most investors cannot. As you will see in this chart shared by @BrianFeroldi. Impatience is prevalent among investors/traders.
This week, amidst the noise of a liquidity event and the media’s breathless attempts to explain normal volatility, we dropped two critical charts that define exactly where we are in 2026. One explains the “math equation” of the index, and the other sets the roadmap for your emotions.
Let’s break down the black-and-white data.
1. The Math Equation: Be Careful What You Wish For (Broadening)
For two years, the bears and the “Yea-But-ers” screamed that the market was too concentrated. “It’s only the Mag 7!” they cried. “We need the market to broaden out!”
Well, you got your wish. And as Seth Golden, Chief Market Strategist at Finom Group noted in our Chart of the Week update:
“Only 1 other period in history, did 62% or more stocks in S&P 500 outperform the index, Dotcom (2000-2002).”
Here is the reality of a cap-weighted index like the S&P 500: It is a math equation.
When the vast majority of constituents (the smaller weights) outperform the index, it mathematically implies that the heavyweights (Mag 7) are underperforming or resting. Since the heavyweights drive the bulk of the index’s point-movement, a “broadening market” often results in the index itself churning or trading sideways.
We are seeing a massive rotation where the average stock is doing well, but the index looks “dirty.” This isn’t a crash; it is a rotation. The data suggests we are 1-month into 2026, and the internal participation is robust.
The takeaway: Put the knife down. Do not mistake an index consolidation for a bear market. This is the math of a broadening rally playing out in real-time and our 6800 by Q1 target so far playing out to a tee…
2. The Midterm Year Reality Check
We came into 2026 with a positive January. The January Barometer triggered bullish. In a normal year, that signals an 87% probability of the market being higher than 6,976.44 by the end of the year.
However, we are not in a normal year. We are in a Midterm Election Year.
As we detailed in our second chart this week, derived from Ned Davis Research data:
“Even when January is positive, Midterm year hit rate is only 66%, far worse than any other year. And… Max Drawdown in Midterm w/ a positive January Barometer is -12.2%.”
***NOT to confuse with Whaley’s famous JAN TOY barometer, which fired a positive +3% bullish signal this year, refer to @Bluekurtic quant below***
Let that sink in. A positive January usually creates a smooth ride. But in a Midterm year, even with a positive start, you typically endure a double-digit drawdown (-12.2% on average) before the year is out, notably 5.3ppts less than the typical midterm election year drawdown.
Why does this matter? It validates the volatility we are seeing right now. There is NEVER “reason enough to be a bear,” but it is “reason to anticipate” volatility and prepare to engage your dip-buying, “aggresive disciplines” and SAVVY investor cash management skills with a relentless fashion.
This data tells us that the liquidity event and the current chop are scheduled features, not bugs. The probabilities still favor a positive year (66% hit rate), but the path there is historically designed to shake you out. Remember that 2009-2015 analogue chart we conveniently highlighted 2 reports ago? Luck is when preparation meets success. 😉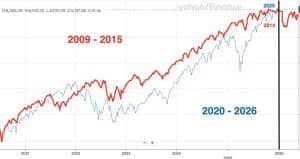
Bottom Line
You have a market that is broadening out (historically bullish for the cycle, even if the index stalls) and a calendar year that historically demands a double-digit drawdown despite a positive start.
Combine these two charts, and the strategy writes itself:
- Stop chasing tops/bottoms. Utilize ETF’s to your advantage! Stock picking beyond US Large-Caps and Growth have historically NEVER been disciplines which sustainably lend themselves to outperformance! Yes I’m talking to all my commodity/international/small-cap stock-picking gurus out there! Your time surely is coming. And it too shall pass, almost as quickly as these volatility spikes have been sustainable. TIME. TIME. TIME. Make it your friend. Avoid those bad habits as if it were cancer!
- Expect the drawdown. It’s historically scheduled.
- Manage cash wisely. Use that -12% historical average as a guide to deploy capital when the crowd is panicking.
DCA isn’t dead; it’s just being tested by the Midterm cycle. Stick to the process and silence the noise ie OPPORTUNITY COST. The only way you consistently get paid is thru time by buying cheaper prices. No other way around that math regardless of how many puts/calls you think you can sell.
BONUS:
Nasdaq $COMPQ Outperformance History explained
Investors have a hard time accurately forecasting future of disruptive Tech, predicting profitability of that disruptive Tech, and assigning a valuation of disruptive Tech profitability.
Investors Usually = too conservative!$NDX…
— Seth Golden (@SethCL) January 30, 2026
BofA Hartnett: Gold getting bubbly
History of asset class bubbles since 1977 pic.twitter.com/us0sjugu9F— Mike Zaccardi, CFA, CMT 🍖 (@MikeZaccardi) January 30, 2026
🚨December down⬇️January up⬆️
Split years lower the hit rate and return for the 12-months.“Anytime” hit rate is 74% and return is 9.2% (unconditional average); the split years (69%; 7.4%) slightly UNDERPERFORM.
Deeper quantitative analysis than superficial January Barometer.… pic.twitter.com/WSxrdV3ngc
— Seth Golden (@SethCL) February 1, 2026
Information Technology $XLK FY2026 EPS estimate now raised to nearly 31%.
If you think the sector P/E compression from 2025 will persist for 2 consecutive years with 31% EPS growth..
In honor of the Super Bowl…I'll take the over on this one!$SPX $QQQ $NDX $AAPL $NVDA $SMH… pic.twitter.com/059GChiFvW
— Seth Golden (@SethCL) February 1, 2026
Semis positioning 100th percentile.https://t.co/NWfACkjJPO
— The Market Ear (@themarketear) January 31, 2026
QUOTE(S) OF THE WEEK
The best investors I know don't care what their annual SHARP RATIO is; they only care what their annual investment returns realize. Volatility is an intrinsic component of investing. It's not capital competition, it's capital appreciation!
~Seth-Marcus $SPY $ES_F $SPX $QQQ…
— Seth Golden (@SethCL) February 2, 2026
We may disagree on what Bitcoin is, but we should agree on what it isn’t. It’s not an inflation hedge, not a safe haven, and not protection during geopolitical or market stress.
— Z (@ZeeContrarian1) January 29, 2026
Big returns don’t come from being early.
They come from being right and staying patient long enough for the story to play out.
Time is the moat most investors refuse to build.
— Austin Lieberman (@LiebermanAustin) January 30, 2026
Some very promising edges play out over time horizons longer than traders typically look, creating significant missed opportunities: https://t.co/8UJ4X3FDIm @MarketCharts pic.twitter.com/HyvnPYUcD7
— Brett Steenbarger (@steenbab) January 21, 2026
The market does a sound job of escorting lone wolf investors out the door.
Don’t be that investor, be like Mike! Resource yourself to develop your skill! pic.twitter.com/9LUecCxCe1
— Seth Golden (@SethCL) December 19, 2023
So many lessons about investing in this quote from @JamesClear
"The ultimate form of preparation is not planning for a specific scenario, but a mindset that can handle uncertainty."
— Michael Antonelli (@BullandBaird) January 31, 2026
Bull markets in any asset class are so interesting because all-time highs bring such significant psychological forces.
Psychology usually drives us to think:
– it’s too expensive
– the sell off just started (this dip isn’t big enough… yet)
— Cliff Cornell (@cliffcornell_) February 2, 2026
Fintwit archive, 2016. pic.twitter.com/UPKOdTunvL
— Ed Borgato (@EdBorgato) February 2, 2026
I'm a permabull, because "Down is good, up is simply better." ™️
And if being a permabull means I'm on the right side of the market 75% of all years, I'm okay with that too!$SPX $SPY $QQQ $NYA $ES_F $VIX $VOO $UVXY pic.twitter.com/ybwiqAi6I2
— Seth Golden (@SethCL) December 26, 2025
Quote of the Day –
“The way we do things is to begin.” – Horace Greeley— Bespoke (@bespokeinvest) February 3, 2026
I’m increasingly convinced that anxiety feeds on idleness. You’re anxious because you’re not doing anything. When you take action, you starve anxiety of the oxygen it needs to survive. The answer is found in the action.
— Sahil Bloom (@SahilBloom) February 4, 2026
Fintwit archive, 2018. pic.twitter.com/OFi510wznK
— Ed Borgato (@EdBorgato) February 4, 2026
Jensen Huang: "There's this notion that the software industry is in decline and will be replaced by AI. Would you use a hammer or invent a new hammer? There's a whole bunch of software companies whose stock prices are under a lot of pressure because somehow AI is going to replace…
— Julian Klymochko (@JulianKlymochko) February 4, 2026
Did Sundar just give the green light for software to rally?
“We have very, very good SaaS customers who are leaders in their respective categories.”
“The successful companies are incorporating Gemini deeply into critical workflows.”
“Companies seizing the moment have the same…
— Sean D. Emory (@_SeanDavid) February 5, 2026
Apply this to your trading. pic.twitter.com/U56HE3jqjW
— HTL-NL 🇳🇱 (@htltimor) December 16, 2024
https://twitter.com/livetradepro/status/2016929026934206754?s=46
Sometimes what may appear to be your worst nightmare in the market, can turn out to be more profitable than you could have imagined; if you take advantage of the opportunities, when most won't.
— Scott (@livetradepro) February 5, 2026
As my friend @OMillionaires once said..
"You can make a lot with a little
and you can lose a lot with a lot"— Scott (@livetradepro) February 6, 2026
TOP 10 TWEETS OF THE WEEK
So far, so good. When the S&P 500 experiences a positive three-month change in earnings per share (EPS), market performance has been meaningfully stronger. In these periods, the index has delivered an 11.4% annualized return, with positive returns on 54.6% of trading days. By… pic.twitter.com/9GlhiypKwi
— Day Hagan Asset Management (@DayHagan_Invest) January 30, 2026
S&P 500 up 1.4% in January.
Rest of year up 87% of the time when January is higher.
But when it up between 0-2%? Lower only once. Small clues 2026 should be an above average year for investors. pic.twitter.com/UhPA8sXxjN
— Ryan Detrick, CMT (@RyanDetrick) January 31, 2026
MS: Our US economics team expects individual tax refunds issued to be $40-70bn higher than those in 2025. Using the midpoint of their estimated range, individual tax refunds issued would amount to $350bn by the end of May, or +20% y/y.
In Exhibit 1 , we show individual tax… pic.twitter.com/CTvGuZxLcl
— Neil Sethi (@neilksethi) January 31, 2026
Revenue per employee up 75% for the top decile of AI/software companies in 2025. Probably doesn’t slow down in 2026 given the December revolution in AI coding agents.
Nothing to see here, move along.
No evidence of AI productivity anywhere. pic.twitter.com/KDMmMYcoLj
— Gavin Baker (@GavinSBaker) January 30, 2026
S&P 500 gained 4.5% during Turn-of-Year (TOY) Barometer window (Nov 19–Jan 19). Since 1950, when the TOY gain exceeded 3%, full year finished positive 36/38 times, with an average gain 18% and average max drawdown 11%. Constructive $SPY setup for 2026.
h/t: @WayneWhaley1136 pic.twitter.com/Aj3UeTsFos— Bluekurtic Market Insights (@Bluekurtic) January 17, 2026
Insider selling just hit a five-year high, with 1K executives selling this month versus 207 buyers across U.S.-listed firms. 👇 pic.twitter.com/zo8uHxtYnj
— Schaeffer's Investment Research (@schaeffers) January 31, 2026
the top 🙂 https://t.co/wGyL0HJhcJ
— Howard Lindzon (@howardlindzon) February 1, 2026
The De-dollarization myth busted!
The de-dollarization theory suggests that foreign nations and investors are diversifying away from the dollar to avoid geopolitical risk and U.S. sanctions. However, this chart shows that Foreign-Held U.S. Equities as a percentage of their total… pic.twitter.com/UtOugIRbjZ
— Adam Khoo (@adamkhootrader) February 1, 2026
It has begun… pic.twitter.com/dWAlJzXzX6
— Turning Point Market Research (@TPMRSignals) January 31, 2026
Our CIO wrote this over the weekend on how agentic AI is good thing for software platforms.
A good casual read…
Especially if you are in software land.$CRM $TEAM $NOW $IGV pic.twitter.com/prJTC1qEQl
— Avory & Co. (@AvoryCo) February 1, 2026
Here's an update to the comparison of $SPX since Sept 2023 vs Feb 1997: https://t.co/eZhPpYan1U pic.twitter.com/CxoNbsGGdD
— Optuma (@Optuma) February 2, 2026
Here's what we shared on 4/4/25 when the VIX moved above 50.
Doesn't feel like it in the moment, but this is a great buying opportunity usually.
We'll have another VIX 50 eventually and no one will want to buy when it happens, just wait. pic.twitter.com/A6pOAsLkGa
— Ryan Detrick, CMT (@RyanDetrick) February 2, 2026
Boom 🔥
And yet, Kevin Warsh thinks its the Fed's balance sheet driving stock market gains.
Going to rename the Fed Balance Sheet-S&P 500 chart the "Warsh Chart" https://t.co/rv6Woqv36b pic.twitter.com/7cOHtbtR5i
— Sonu Varghese (@sonusvarghese) February 1, 2026
DB: Positioning in Materials and Energy has surged to elevated levels, while that in Industrials has also risen to
overweight, that in Financials has remained close to neutral but for Consumer stocks it has fallen to underweights. https://t.co/lwDi0ORug3 pic.twitter.com/7twuPNSugz— Neil Sethi (@neilksethi) February 2, 2026
Gold volatility is now among the highest since the COVID peak driven by record gold prices, weak dollar and safe haven demand amid geopolitical macro uncertainty. By contrast, bond, S&P 500 and tech stock volatility remain subdued. $SPY $VIX pic.twitter.com/mr8EHQ46oZ
— Bluekurtic Market Insights (@Bluekurtic) January 29, 2026
Short interest (in $ terms) is rising again even as $SPX grinds higher. Positioning shows more hedging and skepticism creeping in.. potential fuel if markets keep squeezing higher. pic.twitter.com/fRgAkHPsfk
— Schaeffer's Investment Research (@schaeffers) February 2, 2026
Financial sector relative strength is now just above the low from October, but the average financial stock has been seeing a rise in sentiment, currently at the highest since July. $XLF pic.twitter.com/Hhb087FKr8
— Andrew Thrasher, CMT (@AndrewThrasher) February 2, 2026
UBS: The Adobe Digital Price Index, which covers prices of items sold online, rose in January by the most in its 12-year history. pic.twitter.com/PMRapFBipR
— Nick Timiraos (@NickTimiraos) February 2, 2026
S&P 500 Drawdowns Under New Fed Chairs, via @alexandraandnyc https://t.co/af2GZFudic pic.twitter.com/dLPqaCjcTl
— Sam Ro 📈 (@SamRo) February 3, 2026
Corporate Insider Buys – NDX 20-week average crosses average crosses above 28 for the first time in three months.
A bull market “guarantee?” Nope.
Favorable “weight of the evidence?” Yep (IMO)@sentimentrader pic.twitter.com/eTANFCuqeG— Jay Kaeppel (@jaykaeppel) February 3, 2026
Positive January Barometer Rules: No Other Month Comes Close
* 89.1% of positive January years end higher, 16.9% average gain
* Next 11 mos 10.6% outperformance vs down
* Next 12 mos 11.5% outperformance
Join Me for a Free January Barometer Webinarhttps://t.co/yLYttEGdaa pic.twitter.com/TZ8i9QfLWi— Jeffrey A. Hirsch (@AlmanacTrader) February 2, 2026
Got to 19.50 premarket Monday.
History of $SPX returns can often be determined by whether or not $VIX is above 19.50.
Vast majority of S&P gains occur when VIX is below this magic level. Not all, but the vast majority.
We are going to get there, know what to do when we do!… pic.twitter.com/MmXxCInjpi
— Seth Golden (@SethCL) February 3, 2026
Cyclical leadership is usually a positive for stock market returns; however, Energy leadership has been the exception. The S&P 500 has fallen at a greater than 7% annualize pace when Energy has been the top-performing sector, on average. pic.twitter.com/SbxwLsod0E
— Rob Anderson, CFA (@_rob_anderson) February 3, 2026
Just sayin' $VIX rose nearly 17% in the month of January, with S&P500 producing a positive return. That's a pretty large amount of hedging activity where nothing happened. If nothing macro comes to pass soon, that gamma unwind sends $SPX $NDX $SPY $QQQ higher, VOL sharply lower.
— Seth Golden (@SethCL) January 31, 2026
As of yesterday, new record highs for:
Energy
Materials
Industrials pic.twitter.com/eU5OaB8tLQ— Kevin Gordon (@KevRGordon) February 4, 2026
Small-caps are killing MAG-7 in early 2026
Just a reminder, same time 1-yr ago, when DeepSeek bankrupted NVDA (lol), and what came next.
History repeats, quite often in fact, just a different melody!$SPX $MAGS $RUT $IWM $SPY $QQQ $META $AAPL $NVDA $MSFT $TSLA $AMZN $GOOGL… pic.twitter.com/gEWEJ4nPFC
— Seth Golden (@SethCL) February 4, 2026
Good News: On the surface 12-month forward 93% positivity rate is strong
Bad News: Almost all the negative years where both $SPX and $NDX are up 1st 5-trading days came in a Midterm election year!
Ugly News: With 6 bear markets (1994, 1998, 2002, 2018, 2020, 2025)
Volatility… https://t.co/6QGBuCvY2e
— Seth Golden (@SethCL) January 9, 2026
Friday the 13th marks February's seasonal peak… Citadel Rubner pic.twitter.com/xupOqUhKXQ
— Mike Zaccardi, CFA, CMT 🍖 (@MikeZaccardi) February 4, 2026
Until the current software debacle, there has never been an instance where:
-An S&P 500 industry that was so large (>8% of total mkt cap)
-Has sold off so hard (>25% selloff)
-And, the market remained at highs (w/i 3% of ATHs).+Index still making higher lows… pic.twitter.com/pjnh3nPV0m
— Warren Pies (@WarrenPies) February 4, 2026
Great take by Ricardo.
So far this year, the market has been rewarding short-duration (value) stocks over long-duration (growth) stocks.
That’s why we’re seeing more value-tilted sectors come to life, like $XLB and $XLE.
But even within growth sectors, like tech, the… https://t.co/ExRo6rsZvX pic.twitter.com/9AwWIpQqvv
— Randy Dunham (@itmrandy) February 4, 2026
The Consumer Staples sector is outperforming the Tech sector by 17 percentage points so far this year. Easily the biggest outperformance to start a year since at least 1990. Next closest was 8.4 ppts of outperformance to start 2022 (23 trading days). $XLP $XLK
— Bespoke (@bespokeinvest) February 4, 2026
The rush into Consumer Staples has been just as dramatic as the exit from Software.
Staples now has a 14-day RSI of 84.2, something not seen since 1995.
The sector is also 4.2 standard deviations above its 200-DMA. It hasn't been this overbought since the end of 1991. $XLP pic.twitter.com/PinkMyDHqQ
— Bespoke (@bespokeinvest) February 4, 2026
SP500:
2023 +26%
2024 +25%
2025 +17%2026: Guys the market is ready to crash. See I told you.
— Michael Antonelli (@BullandBaird) February 4, 2026
IGV is near its 200-week moving average. Let's see if that holds. pic.twitter.com/aqE3gYzTKh
— Liz Thomas (@LizThomasStrat) February 4, 2026
Nasdaq-100 just lost its 100DMA, its trend support for most of this rally. pic.twitter.com/4BWMH1JLRI
— Schaeffer's Investment Research (@schaeffers) February 4, 2026
Google showing that while the AI narrative was that "search is dead"…
Google Search +18% growth, highest growth rate SINCE 2022.
Maybe just maybe…
Like we saw from Meta, that Ai enhances great businesses with massive distribution…
Cough Cough been in class software…… pic.twitter.com/AFHTVVZ1tl
— Sean D. Emory (@_SeanDavid) February 4, 2026
The last three Fed Days have been kryptonite for the bulls.
The 10/29, 12/10, and now 1/28 FOMC meetings marked short-term peaks for the Nasdaq 100 $QQQ.
All three stopped rallies in their tracks. pic.twitter.com/DetUZhjco1
— Bespoke (@bespokeinvest) February 4, 2026
Software stock charts look like Exxon did when oil traded negative during COVID and now Exxon chart looks like a software chart of 2021
You know what to do …
— Howard Lindzon (@howardlindzon) February 5, 2026
Major oversold condition for Nasdaq 100 $NDX $QQQ
Historically, this is a profound buying opportunity when in a bull market.
Highest reading since April 2025, marking a bottoming point. $TQQQ $COMPQ $SPX $SPY $AAPL $IGV $XLK pic.twitter.com/wQQH1Wmdlu
— Seth Golden (@SethCL) February 4, 2026
Market is Cap-weighted, it's a MATH equation.
When > 60% of stocks Outperform, Small-caps outperform Large-caps, and Staples outperform $SPX, that's a problem for bulls… 3/4 occurrences SPX produced negative annual return… read more!$IWM $RUT $SPY $QQQ $NYA $DIA $XLP $XLE… pic.twitter.com/eD8emqoY8e
— Seth Golden (@SethCL) February 5, 2026
Tech has been weak lately, but looking at what happened after the Netscape IPO, this is perfectly normal for year 3.
History repeating? pic.twitter.com/1kBzIlgX28
— Ryan Detrick, CMT (@RyanDetrick) February 5, 2026
Software sector ETF $IGV is now down for 8 consecutive days. A 9 day losing streak hasn’t happened in 20 years. Another red day tomorrow would mark the longest stretch of weakness in software stocks since 2006. pic.twitter.com/lf9Viy52ui
— Bluekurtic Market Insights (@Bluekurtic) February 5, 2026
Backwardation in the front two months of the $VIX futures does not necessarily signal an and to a selloff in equities, but it is often a necessary precondition. And backwardation is strengthening into today’s close.
— Bill Luby (@VIXandMore) February 5, 2026
Mag 7 ETF $MAGS closed below the prior two lows today, a break of support. pic.twitter.com/DBypkDpO2p
— Bespoke (@bespokeinvest) February 5, 2026
Time will tell if the tech selloff is the start of a long-term rotation from Growth or a blip. But for perspective, Technology has averaged six declines per year greater than 5%, two greater than 10%, and one greater than 15%. Declines of 20%+ occur about once every two years. pic.twitter.com/BKj0RkyOsE
— Rob Anderson, CFA (@_rob_anderson) February 5, 2026
99th percentile outperformance for value over growth over the last six days: pic.twitter.com/E6zcpPbtmp
— Bespoke (@bespokeinvest) February 6, 2026
I'm seeing recession calls.
Yet, Mag7 is spending 2.1% of GDP on capex and U.S. govt running +6% deficit (expanding in H1).
— Warren Pies (@WarrenPies) February 6, 2026
JOIN THE FINOM GROUP FAMILY – CLICK HERE TO UPGRADE NOW!
Master the markets with Seth Golden and our “Finominals” community! For just $29.99/month, unlock weekly 5000+ word macro research reports packed with charts and actionable insights. Go Premium at $84.99/month for daily Telegram Traders Corner, myth-busting Zoom sessions, and live 1%+ scalp/swing trading with Seth. Don’t let market noise win—join our Contributor or Premium Membership to build confidence and achieve your financial goals.
[Click here to REPLAY a free Morning Market Setup sample from February 4th 2026!]
FINOM GROUP – RECENT REPORTS
November 30, 2025 – 2026 FULL YEAR MACRO-MARKET OUTLOOK RESEARCH REPORT
January 11, 2026
January 18, 2026
January 25, 2026
February 1, 2026
A Parabolic Move Collapses and Forces A Liquidity Event
YOU’RE ALL CAUGHT UP NOW. THANKS FOR READING!
If you have any questions, feel free to message Seth Golden or contact us support@finomgroup.com
Comment below or tag us on X (@FinXWeekly) with your thoughts—your feedback drives our innovation.


