
by Matthew Famiglietti and Carlos Garriga
Since the mid-1990s, the Federal Reserve System has either implicitly or explicitly had an annual inflation target (IT) of around 2 percent. The Federal Reserve Open Market Committee’s (FOMC’s) preferred inflation measure to meet this target is core personal consumption expenditures (PCE), which explicitly excludes the prices on food and fuel to mitigate short-term volatility in the index. There has been a debate about using the core measure of inflation instead of the headline measure, which includes all PCE categories, but for the purpose of this analysis we focus primarily on the core measure. In addition to its target inflation rate, the Fed seeks to achieve “full employment” or the lowest level of unemployment possible. The combination of its inflation and employment mandates is known as the Fed’s “dual mandate.”
In August 2020 at the Jackson Hole conference, Fed Chair Jerome Powell announced a revision to the Fed’s monetary policy framework by stating the Fed would seek an average inflation target (AIT) of 2 percent over the long run. Under this new approach to monetary policy, the FOMC is communicating that it will begin to tolerate short-run inflation exceeding the target rate if it means the long-run inflation rate will average 2 percent. This is a very notable revision to monetary policy as it implies that recent rate hikes, such as those of 2018, are less likely to happen under the new framework. The rationale for the revision, as indicated by senior Fed officials, included concerns that inflation shortfalls in recent years were economically sub-optimal and damaged Fed credibility.
The revision of the framework provides the opportunity to ask how successful the Fed has been at achieving its dual mandate during the era of pure inflation targeting. To provide a simple illustration of the Fed’s success rate concerning monetary policy, the figure depicts the bivariate distribution of core PCE inflation and the unemployment rate using monthly data from January 1995 to August 2020.

The left panel of the figure plots in 3D the bivariate distribution of these two measures, whereas the right panel plots a bird’s eye view of the distribution. The bright colors represent pairs of outcomes that have been realized more frequently in the data, whereas darker colors represent less likely outcomes. The z-axis or vertical axis in the left panel represents the probability density of a given unemployment and inflation combination—in other words, the amount of time the U.S. was in that state of the economy. We also give this information in tabular form in Table 1, where we indicate the cumulative amount of time in our sample spent in a given range of inflation and unemployment rate measures.
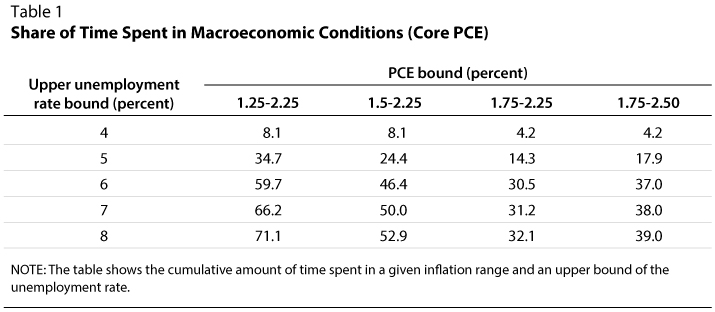
So how has the Fed performed over the past 25 years? Judging by these baseline metrics, it appears to have done a reasonably good job maintaining its dual mandate. The concept of an “optimal” level of full employment is not well defined, so we abstract away from this definition and simply consider periods where the unemployment rate was under 6 percent as periods with high levels of employment. For 30.5 percent of the time, core PCE inflation has been between the narrow range around its target of 1.75 to 2.25 percent, and unemployment has been under 6 percent.
One might think that these bounds are too narrow and that during recessions or crises, one expects to observe inflation and unemployment outcomes outside the bounds. Expanding the range for inflation by reducing the lower bound to 1.5 percent increases the amount of time in that range to 46.4 percent. Surprisingly, increasing the unemployment rate bound to 8 percent to include periods of economic recovery or moderate recessionary periods only increases the share of time to 52.9 percent. In light of this evidence, one can argue that for approximately half the time in this recent era of monetary policy, the FOMC has been well within a reasonable range of its dual mandate.
The remainder of time unaccounted for in Table 1 and the analysis is concentrated in periods of high unemployment. Inflation for over two-thirds of this period moves in the range of 1.5 to 2.25 percent. However, this period has also been characterized by extremely large shocks to employment, including the Great Recession and the COVID-19 pandemic, causing the dual mandate to fail for periods of time.
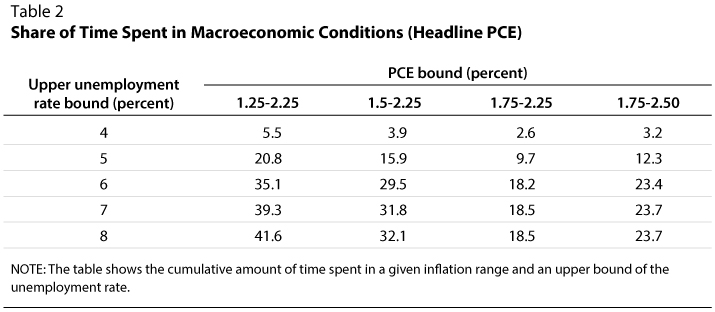
An alternative version of this analysis is presented in Table 2, where we substitute the headline PCE measure for core inflation. Using the more volatile measure unsurprisingly implies that the Fed was significantly less effective in anchoring inflation during this period. In the case of using headline inflation, the economy was in a state with less than 8 percent unemployment and with inflation between 1.5 and 2.25 percent only 32 percent of the time. As referenced earlier, there are pros and cons to selecting a less-volatile measure such as core PCE, and this can have large implications for evaluating the effectiveness of Fed policy during this period.
One has to bear in mind that the nature of this analysis is simple in execution, as it only evaluated the connection of the statistical properties of these two economic variables. To some extent, the high concentration in certain areas might be interpreted as a connection between both variables; but in order to move from a statistical relationship to a causal connection, it is necessary to bring economic theory into the picture.
Under the view of traditional monetarists, inflation is caused by a continuous increase in the supply of money with limited effects in labor markets and unemployment. The view of Keynesians is that inflation is generated in part by the relative strength of the labor market and that prices rise together with some lag caused by higher wages. Under this view, the central bank has the ability to exploit this connection, often referred to as the Phillips Curve, and influence the real economy through the trade-off between inflation and unemployment. Both of these views, in terms of the FOMC’s ability to affect the variables, face some challenges. Recent work by Stock and Watson (2019) decomposes inflation rates into separate components. They find that the FOMC does not have the ability to influence all components of inflation and that many of the more unresponsive factors to monetary policy are weighted prominently in the Fed’s preferred core measure of PCE. Related works by McLeay and Tenreyro (2020), Hazell et al. (2020), and Bharadwaj and Dvorkin (2020) document the flat Phillips phenomena and provide empirical and theoretical reasons for the recent flatness, calling into question the relative trade-off between the Fed’s two measures in its dual mandate.
So far, the FOMC has done a reasonably good job, in a statistical sense, of keeping unemployment low and prices stable in the era of inflation targeting outside of large recessionary events, including the dot-com bubble, the Great Recession, and the COVID-19 pandemic. To what extent do these empirical distributions and theories about the employment-inflation trade-off matter for the new monetary policy strategy? It could affect the new monetary policy framework as it will seek to shift the bivariate distribution of inflation and unemployment up the y-axis (right panel of figure) to tolerate inflation above the explicit target of 2 percent. The credibility of the target made this a very unlikely outcome in the past, but the new guidance could deliver more inflation outcomes above the current inflation target. To what degree the FOMC can accomplish this remains an open question.


