
It’s often the case that price action can translate and transform into investor sentiment. When the market is going up, things must be getting better and when the market is going down, things must be getting worse. After a roughly ~25% rally off of the bear market, interim low (2,191) as of last week’s close in the S&P 500 (SPX), analysts and strategists turned more bullish. Recall that over the weekend, Goldman Sachs and Morgan Stanley (MS) both tilted more optimistic on equities, as we outlined previously:
Goldman Sach’s chief equity strategist David Kostin’s latest call on markets and after a rally significant 2-week rally.
“U.S. stocks are unlikely to make fresh lows thanks to the “do whatever it takes” approach of policy makers.
A combination of unprecedented policy support and a flattening viral curve has “dramatically” cut risks to both markets and the American economy. If the U.S. doesn’t have a second surge in infections after the economy reopens, equity markets are unlikely to make new lows, they said.
“The Fed and Congress have precluded the prospect of a complete economic collapse. These policy actions mean our previous near-term downside of 2,000 is no longer likely” for the S&P 500 Index.“
Morgan Stanley Chief U.S. Equity Strategist Mike Wilson:
1. Raising year-end S&P 500 targets (Bear / Base / Bull to 2500 / 3000 / 3250)
2. Upgrading small cap stocks.
3. “Pullbacks should be bought”.
4. “The worst stocks will likely have the biggest recoveries”.
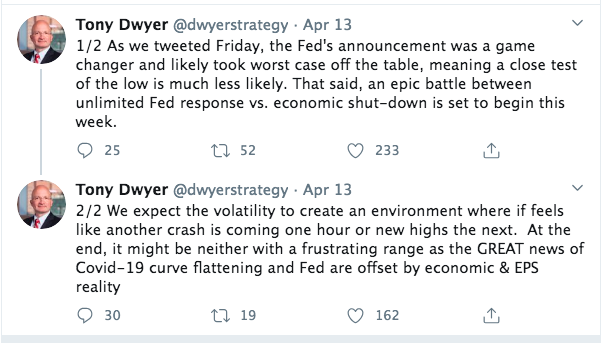
Adding to the more optimistic outlook from the strategist community was Canaccord Genuity’s chief market strategist Tony Dwyer. In his latest notes, Dwyer suggested that the worst case scenario was “off the table”.
It’s pretty clear that the Fed’s various announced programs will serve to build a bridge in the financial markets from the current economic crisis to the other side of the pandemic. The programs announced are numerous, and for which admittedly may demand more from both the Fed’s monetary policy side and government’s fiscal policy side of things, depending on the duration of the economic shutdown.
For its part, here’s a look at action the Fed has taken in just the past six weeks:
- March 3 — An emergency 0.5 percentage point interest rate cut.
- March 15 — Another 1 percentage point rate cut, taking the Fed’s benchmark for short-term lending down to near zero.
- March 15 — At the same time as the second rate cut, the Fed lowered the rate for banks to borrow at the discount window by 1.5 percentage points and cut the reserve requirement ratio for banks to zero.
- March 17 — In the first of a slew of measures aimed at keeping credit flowing through the financial system, the Fed said it would start buying commercial paper, or the short-term unsecured debt that businesses rely on for operational cash.
- March 18 — Another facility providing credit to keep money markets functioning properly.
- March 19 — A new operation focused on currency swaps aimed at other institutions in need of dollar-denominated assets.
- March 20 — An operation headed by the Boston Fed to buy municipal debt.
- March 23 — An expansion of the Fed’s originally announced asset purchases, which were supposed to max out at $700 billion but now are unlimited depending on the need to support markets and the economy. The purchases already have expanded the Fed’s holdings on its balance sheet by more than $2 trillion.
- March 23 — In addition to the next leg of quantitative easing, the Fed also announced a $300 billion credit program for businesses and consumers. The initiatives include two credit facilities for large employers, an expanded Term Asset-Banked Loan Facility for businesses and consumers through the Small Business Administration, and an expanded money market facility that includes municipal debt and certificates of deposits.
- April 6 — An announcement that the Fed will provide support to the Treasury’s Payment Protection Program aimed at incentivizing businesses not to lay off employees during the coronavirus-induced shutdown.
- April 8 — A modification for the asset restriction it has placed on scandal-plagued Wells Fargo to allow the third-biggest U.S. bank to participate in the business lending programs.
- April 9 — The coup de grace, a $2.3 trillion lending programthat will extend credit to banks that issue PPP loans, purchase up to $600 billion in loans issued through the Main Street program to medium-sized firms. The moves also involve secondary corporate credit facilities that will allow the Fed to buy corporate bonds from “fallen angels” that have slid into downgrades, and a $500 billion program to buy bonds from state and municipal governments.
In all, the programs could combine to provide more than $6 trillion of liquidity to the financial and business system. While this is a great many times more the liquidity measures taken by the Federal Reserve than during the 2008 Great Financial Crisis, we would anticipate more programs in the not too distant future. According to Mohamed El-Erian, the Fed’s outsized programs are in recognition of not fully knowing how troubled the economic outlook has become. In his latest op-ed in the Financial Times, El-Erian suggests that the market and it’s many participants have become too optimistic, as equity prices have rebounded ahead of the macro picture surrounding the pandemic.

“Consensus economic forecasts are not alone in failing to appreciate fully the impact of the shock and the reactions of both companies and households. Financial markets are too bullish too, judging by US price-earnings ratios for stocks and spreads for the lowest quality segments of the credit markets. Neither takes sufficient account of a whole host of risks including a more difficult earnings outlook, higher levels of indebtedness, a much bigger dispersion between winners and losers, the growing entanglement of government in private sector activities, lasting risk aversion in the real economy and, most importantly, a huge amount of bankruptcies.
That cognitive gap reflects, in part, an inherent structural bias of markets to treat pullbacks as temporary and fully reversible — a result of multiyear conditioning to try to follow and outpace a super-activist Fed.
The timing of a decisive rebound in markets, and then the economy, will come only with medical progress in identifying and containing the spread of the virus, treating illness more effectively, and increasing immunity.“
Finom Group largely agrees with El-Erian and as such, while we recognize the significant rebound in markets over the last 2 weeks, we still categorize it as a relief rally. Such rallies are typical during a bear market bottoming process. But was this a typical bear market bounce? Remember, this bear market proved the most rapid in history, achieved in just 13 trading days. The table below identifies historical bear markets and subsequent bounces, dated April 6th of this year. Of course, we understand that the bounce has been extended since and to equal greater than 26% off of the lows.
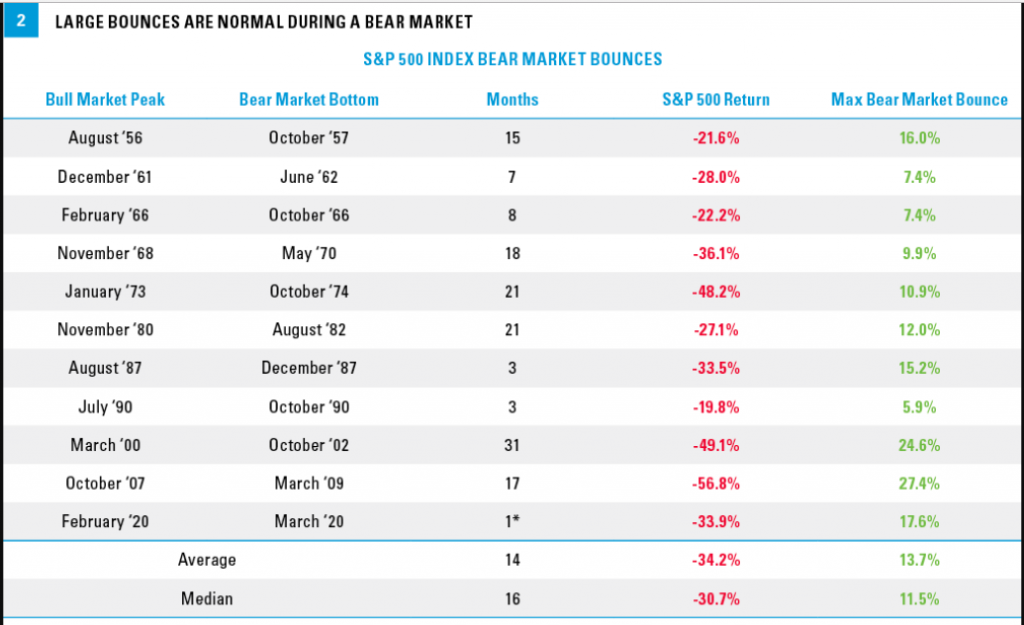
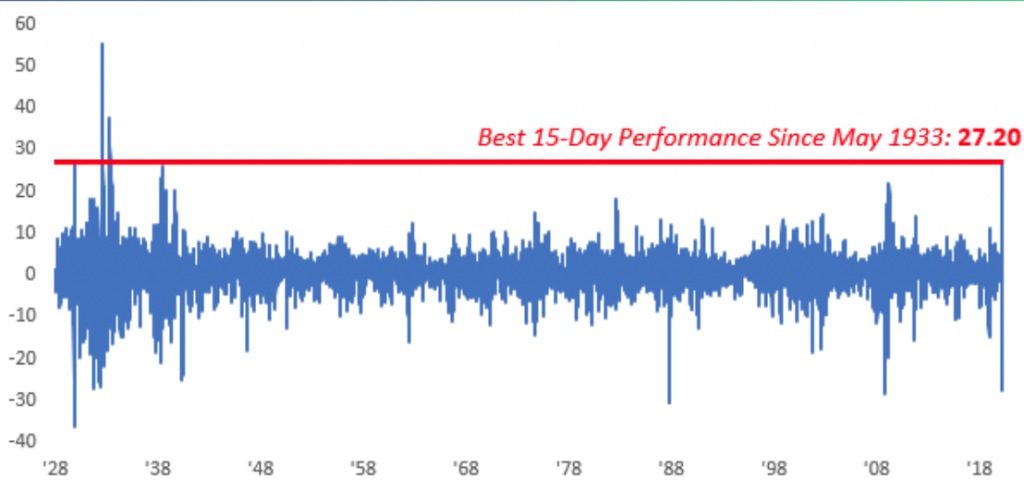
To-date, this is clearly an above average bear market bounce in terms of total returns, but it has also proven record setting in terms of bounce duration. As of April 8th, just a week ago, the S&P 500 retraced nearly 37% of its decline in just 11 days from the bear market low of 2,191. Looking at all historical instances of the S&P clawing back more than 30% of its decline after 11 days, not a single one was “just a bear market rally.” While it’s common knowledge that stocks enjoyed multiple large rallies during prior bear markets, at no point during the rallies in the 1930s or 2008 did stocks manage to claw back as much of the losses as quickly as they’ve done this time. And since this achievement, the S&P 500 has retraced ~50% of its decline as of April 15th. In doing so, it has surpassed the so-called 50% fibonacci retracement level at 2,792.
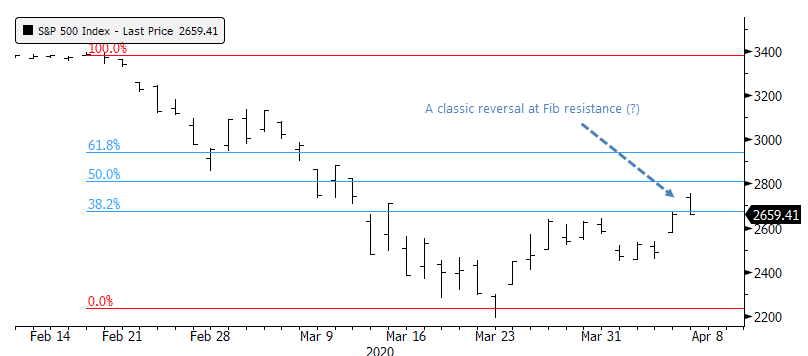
We off “so-called” 50% fibonacci retracement in quotes because there’s really no such thing as 50% in fibonacci ratio percentage definitions, as noted by Investopedia. Simply put, it’s a nice round number that aids in technical software development to round out coding and logic.
“A Fibonacci retracement is a term used in technical analysis that refers to areas of support or resistance. Fibonacci retracement levels use horizontal lines to indicate where possible support and resistance levels are. Each level is associated with a percentage. The percentage is how much of a prior move the price has retraced. The Fibonacci retracement levels are 23.6%, 38.2%, 61.8% and 78.6%. While not officially a Fibonacci ratio, 50% is also used.”
Before moving on, there is another important feature/characteristic to the current bear market that demands emphasis and for which we remain cautiously optimistic. Larry Williams is possibly the most renowned market technician of our time, for which there is even a technical indicator named after him.
Williams %R, or just %R, is a technical analysis oscillator showing the current closing price in relation to the high and low of the past N days (for a given N). Its purpose is to tell whether a stock or commodity market is trading near the high or the low, or somewhere in between, of its recent trading range.{\displaystyle \%R={high_{Ndays}-close_{today} \over high_{Ndays}-low_{Ndays}}\times -100}

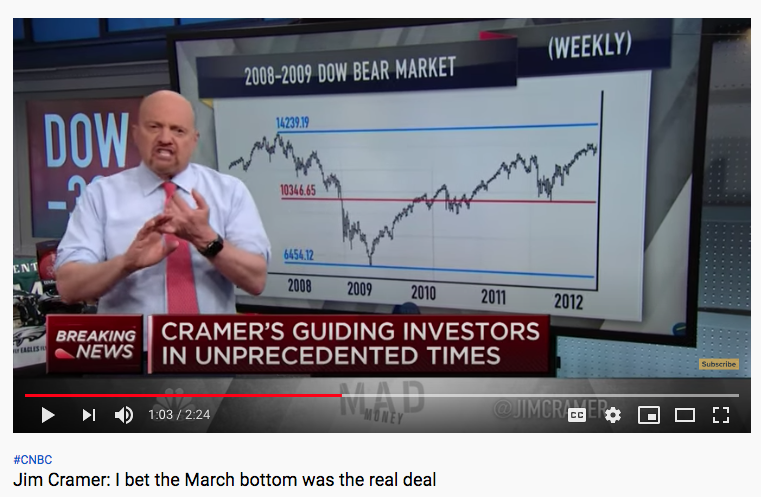
In Williams’ most recent notes, the technician denotes that the major averages have exacted a 50% retracement from the March 23rd lows. As Williams pointed out, “The history of the last nine bear markets going back to 1972 shows that once we have had a 50% rally, back where we are now in the S&P 500, lows are not re-tested. And a rally less than 50% may give way to a re-test. Anything greater than 50%, we just don’t retest.”
Mad Money host Jim Cramer recognized Larry Williams’ latest notes and historic data regarding 50% bear market retracements in his more recent episode.
Based on everything we know about past bear markets and have witnessed in the current bear market, the facts suggest that even as the macro picture remains uncertain, the technical market picture offers strong probabilities. The low may have proven to be the 2,191 level set in March, but a full retest doesn’t seem to be in the cards based on the historic data. This is not to suggest that consolidation of the relief rally won’t take place going through earnings season and an economic shutdown that is likely to last through all of April.
As the saying goes, the market likes to inflict the most amount of pain on the most amount of positioned capital or market participants and of late, the pain has come to those positioned short or heavy in cash. Mind you, the cash position is also useful in many ways and mostly in shoring-up trader psychology. Large cash positions can be used for trading or simply to avoid the perils that come with bear market conditions.
Fund managers have allocated the largest percentage of their portfolio toward cash since the 9/11 terrorist attacks, according to a new survey released on Tuesday. Bank of America’s global fund manager survey finds 5.9% of funds allocated toward cash, up from 5.1% in March.

The Bank of America team say this pessimism in positioning is a positive sign for stocks. When the average cash balance rises above 4.5%, a contrarian buy signal is generated for equities. The 10-year average is 4.6 percent.
The fund managers also are pessimistic in their attitudes toward an economic recovery. Not only do 93% expect a global recession, but only 15% say the economic recovery will be “V-shaped” as opposed to 52% expecting a gradual U-shaped recovery. Another 22% say it will be “W-shaped,” implying a deterioration after an initial recovery.

This week is widely heralded as a very important week for investors, given the week represents the kick-off of earnings season, with big money center banks reporting Q1 results. As Jason Goepfert of SentimenTrader opines about earnings season:
“Investors are forward-looking; earnings are backward-looking. Even forward earnings guidance and Wall Street estimates are heavily weighted by the recent past.
Based on the latest figures tallied by Bloomberg, Wall Street is scrambling to downgrade just about everything in sight to get ahead of these earnings releases.“
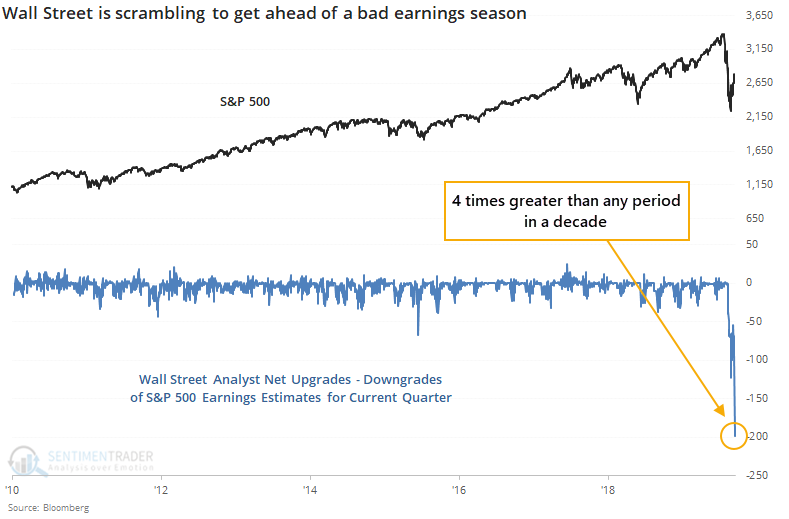
“When we enter an earnings season following a 30% or more decline in the S&P 500 during the immediately prior off-season, stocks rallied consistently over the medium- to long-term. Because stocks had just suffered massive losses, investors had already baked much of the worst of the coincident recessions and bear markets. Surely, the earnings reports were about to be terrible, but investors already knew that and were trying to look around the corner about what the prospects were once the economy recovered.“
It’s been the fastest earnings rating decline in history, as analysts scramble to slash estimates. We should point out, also, that after the latest 26%+ bounce in the market (as of the start of the week) and with next year estimates coming down, the market is back to trading at 18.3x next year’s earnings. Not far from its cycle high of 19x in January of this year.

For the Q1 2020 earnings period, Refinitive suggests that consensus estimates expect S&P 500 revenue growth of 0.7% and EPS growth of -9 percent. Excluding the energy sector, the growth rate improves to -7.5 percent.

As earnings season kicked off in earnest Monday, with both Wells Fargo (WFC) and J.P. Morgan Chase (JPM) reporting results, thus far the market ignored bottom line misses from both big money center banks. Having said that, the financials were a big laggard in the market yesterday as all big money center banks reversed intraday gains to find losses of greater than 1% largely across the board. And it may prove insightful that ahead of earnings season and likely worse than forecast results, investors were in hedging mode.
The so-called “smart money” hedgers were placing hedges as the S&P 500 had its strongest rally since 1974, last week (gain of ~12%). These hedges now total more than $23 billion worth of equity index futures contracts, among the most in a decade.
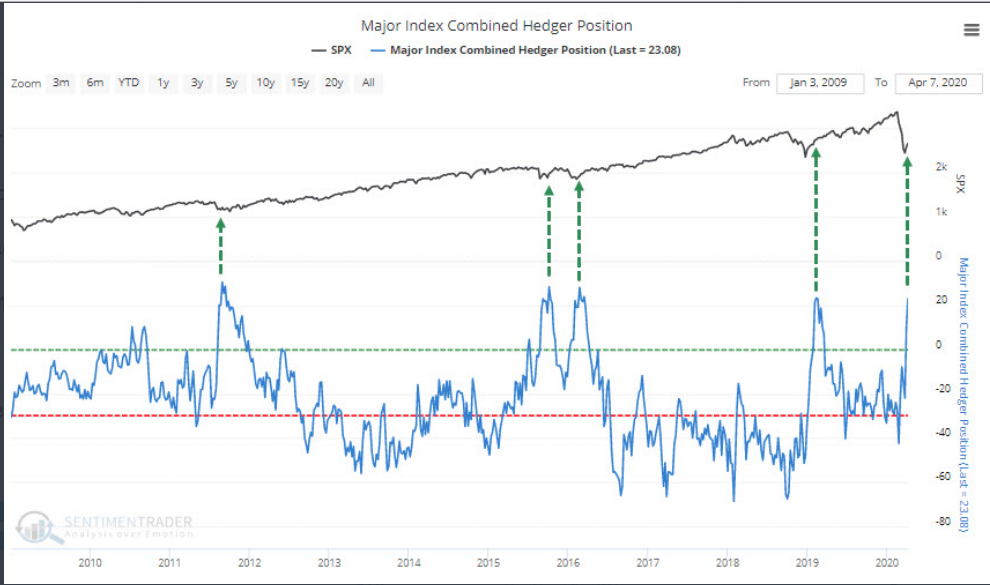
Finom Group recognized such hedges in the outsized E-mini futures report from CoT this past week. Here is a quick review of our research notes sent out to subscribers (Contributor, Premium & MasterMind Option members) over the weekend:
“But with a huge rally in the S&P 500 last week, the biggest weekly gain since 1974, the shorts did not throw in the towel. Non-commercials/hedge funds aggressively added to net shorts in SPX futures. Short interest is now at a 4-year high, that’s “how aggressively” they added.“

The short interest and hedging activity denoted above is one of the several reasons we expect choppy market activity ahead and consolidation of the multi-week relief rally. I think it’s safe to say that the market has indeed inflicted a goodly amount of pain on the shorts and produced some amount of FOMO from those positioned heavily in cash. Nonetheless, while the technical picture has greatly improved during the relief rally portion of the bottoming phase, the macro picture has not materially improved and suggests cautious optimisms remains… the optimal outlook.
Over the last 3 weeks, 30-day implied volatility (VIX) has been greatly reduced, even as the S&P 500’s daily rate-of-change remains extreme. This has supported markets’ moving higher. But with a large gap still remaining between implied volatility and S&P 500’s realized volatility (HV), this still demands resolution before becoming offensively minded as an investor.
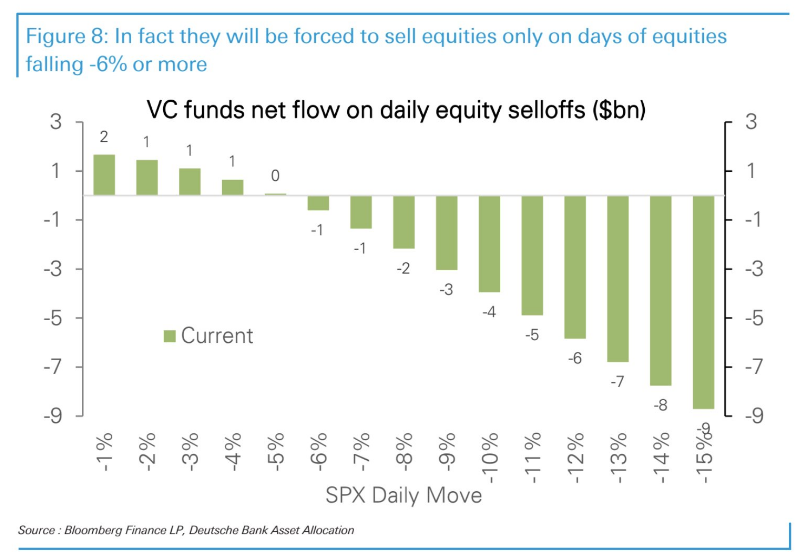
It’s nice to see the VIX tempered, as it breeds greater investor confidence and finds increased positioning, but let’s be clear, the VIX is still above 35. In terms of positioning, here are some great insights from Deutsche Bank:
- Volatility control funds’ exposure to equities is so low that it would take *at least* a 6% selloff for them to sell stocks.
- So if stocks fall just 3% in a day, they’re buyers.
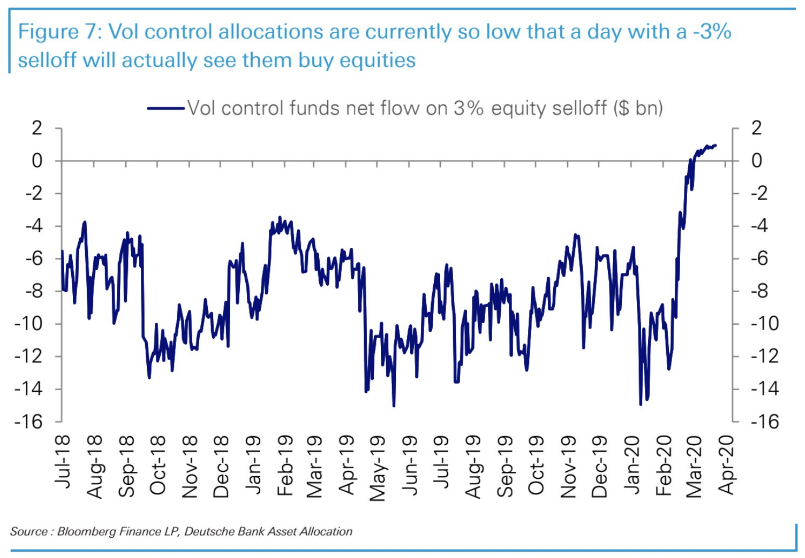
- As of Monday, the VIX broke its streak of closes above 40 at 27 straight days. This is shy of the record of 62 straight days back in Q4 2008.
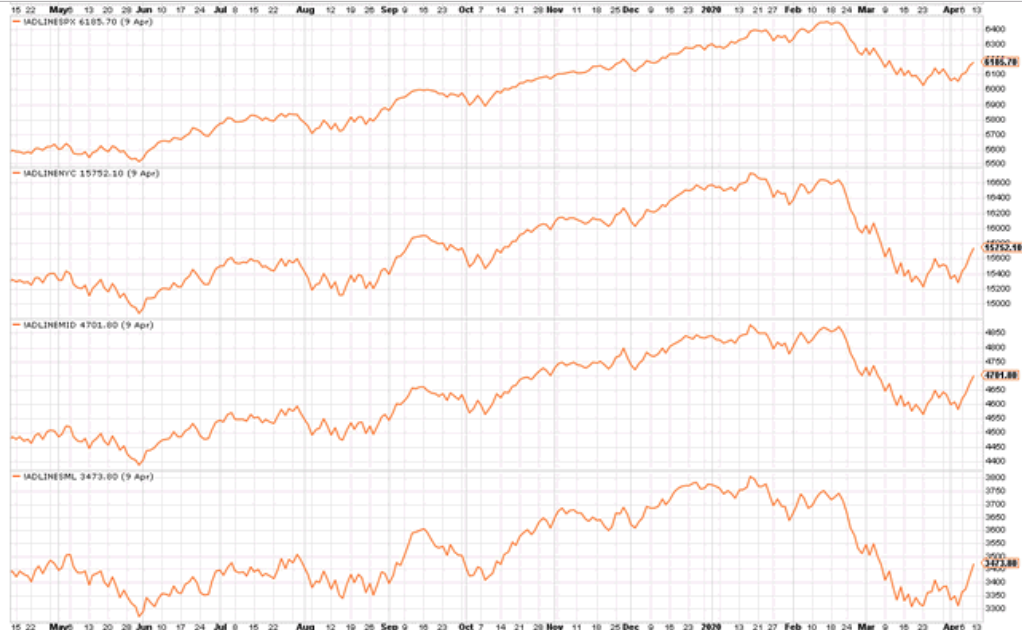
Again, the technical picture has greatly improved with the VIX descending from a record closing high of 82+ just a few weeks ago. When we look at the various indices, we’ve witnessed their respective A/D lines create higher highs, an important feature of near-term market strength. A/D lines were confirmed positive last week, with all making higher lows and higher highs in fact. This confirms the short-term uptrend and it is also worth noting that there were no divergence among smaller companies as was the case in February of this year. (Charts of small caps-large caps & NYSE A/Ds)
While this is a positive sign of breadth… there is always a but, right? Volume has been relatively weak in stocks that are advancing both last week and on Monday, when the S&P 500 gained more than 3% on the day. The Arms Index (aka TRIN) is spiking to a degree never before seen with such a big day in the S&P 500. We had seen a pretty good spike in TRIN last week. Once again, this was another reason that Finom Group was of the opinion that while the market rally proved “price strong”, it was relatively weak in other aspects. Again, our research notes concerning TRIN delivered over the past weekend to subscribers:
- If AD Volume creates a higher ratio than the AD Ratio, TRIN will be below one.
- If AD Volume has a lower ratio than AD Ratio, TRIN will be above one.
- A TRIN reading below one typically accompanies a strong price advance, since the strong volume in the rising stocks helps fuel the rally.
- A TRIN reading above one typically accompanies a strong price decline, since the strong volume in the decliners helps fuel the selloff.
- The Arms Index moves opposite the price trajectory of the Index. As discussed above, a strong price rally will see TRIN move to lower levels. A falling index will see TRIN push higher.
“Ok, so now that we know what TRIN is and what to look for we reiterate… If AD Volume has a lower ratio than AD Ratio, TRIN will be above one! A TRIN reading above one typically accompanies a strong price decline, since the strong volume in the decliners helps fuel a selloff. Now here is the latest look at TRIN from this past trading week
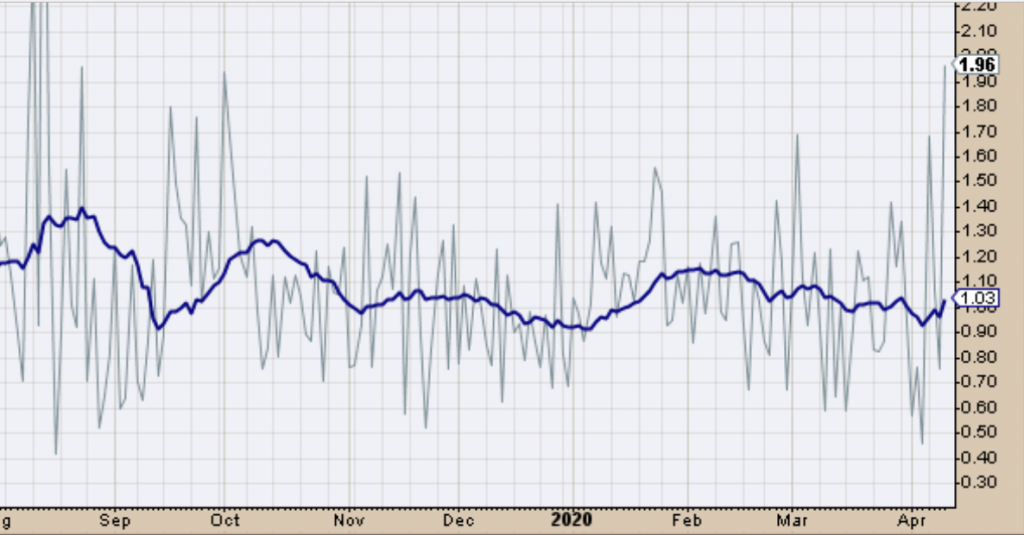
TRIN finished the week at it’s highest level since late August of 2019, at 1.96. Investors were clearly selling into the markets’ rally this past week. It seems odd that such selling pressure could still result in higher prices, right? Here is how it works though, if you are long and aiming to rebalance in favor of cash. Volume is lower because sellers don’t want to kill the bid, for as long as they possibly can. They want prices higher so they can sell at the best possible price. Unfortunately for the bulls, this game can only last for so long as the buyers are few and far between and eventually it would seem, based on TRIN this past week, sellers might overwhelm the bid.“
Thus far, TRIN has not produced a more material sellers bid, so to speak. Nope, the S&P 500 is up ~1 in the first two, choppy, trading sessions. And as SentimenTrader points out, even with a spike in TRIN, this doesn’t necessarily result in negative returns over most time frames going forward.
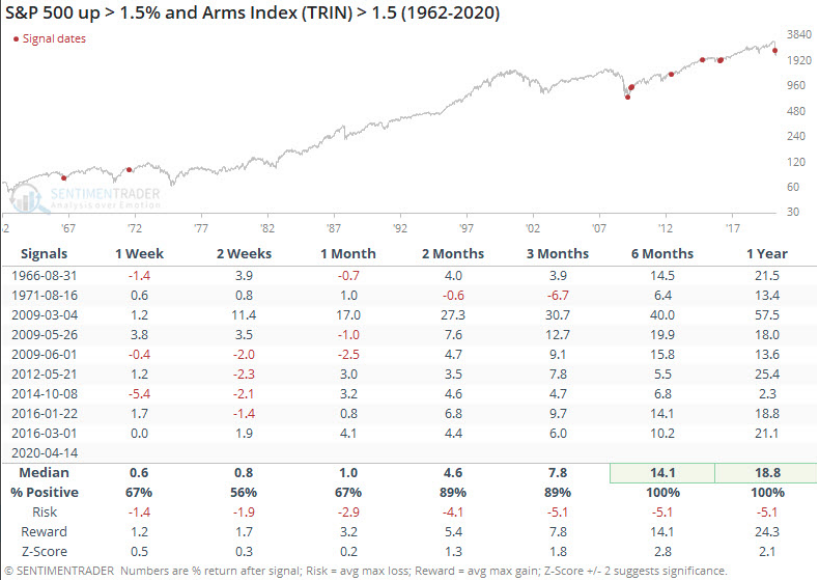
The reality is there is a modest gain after such spikes in TRIN over the following month, but 2 months to 1-year later, the market returns are pretty significant using the spike in TRIN as an indicator of future returns. This study helps us to remain open minded and optimistic about the future prospects for the market and returns. Near-term may prove choppy, but we encourage investors to keep an eye on long-term objectives whereby the market trends higher over time.
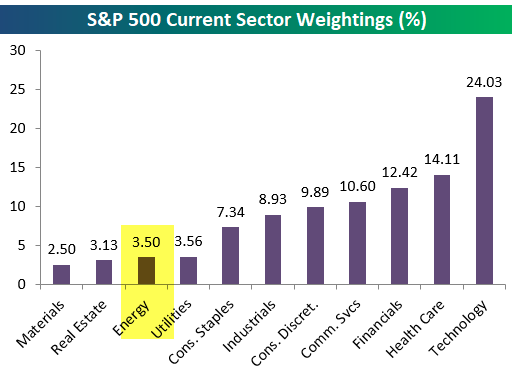
Last, but certainly not least, Finom Group has said that we need to see tech leadership in order for the market to maintain above the bear market low. The technology sector remains the most heavily weighted sector in the S&P 500 and obviously it drives the Nasdaq (NDX) and Nasdaq 100 Index (QQQ).
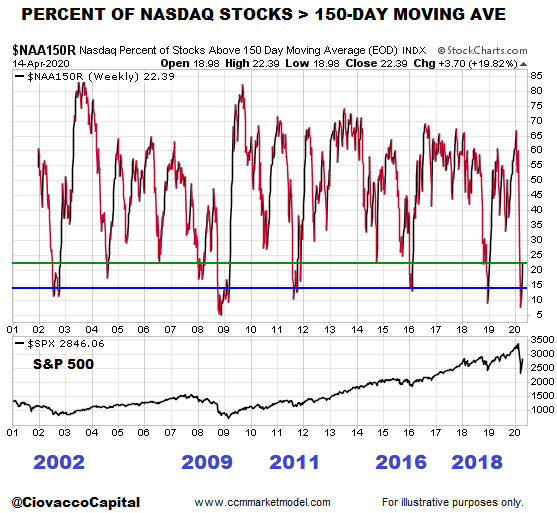
So while financials are currently reporting Q1 results, they shouldn’t be the rally killer, if tech continues to lead as it has over the course of the bear market and subsequent relief rally. In fact, let’s take a look at the Nasdaq, under the hood and through a recent study from Chris Ciovacco.
“As shown in the chart below, it is relatively rare for the percent of NASDAQ stocks above their 150-day moving average to move from the blue line to the green line. The blue line represents a rare oversold level and a move back to the green line can be thought of as a breath thrust setup. Breadth thrusts typically occur when market participants are becoming more constructive on the long-term outlook for stocks and the economy. Notice how past oversold readings have occurred near favorable long-term risk-reward levels for the S&P 500 (bottom of chart).
The table below shows the S&P 500 performance after similar breath thrust setups in the percent of NASDAQ stocks greater than their 150-day moving average. The data below, based on something that occurred over the past 15 trading days, helps us keep an open mind about much better than expected long-term outcomes in the stock market. If you know market history, 2002, 2009, 2011, 2016, and 2018 all fall into the “major low” category. 2020 is a unique case and will follow a unique path.“
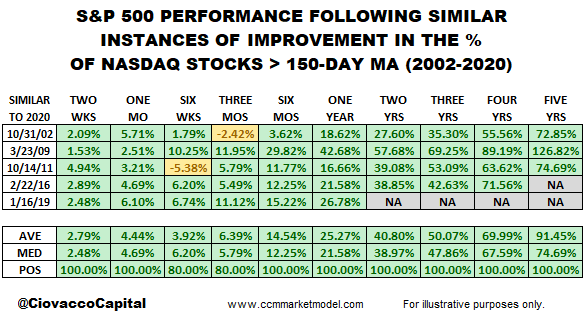
As it was with the TRIN study, the recent Nasdaq study from Chris Ciovacco begs of investors to remain patient and cautiously optimistic. History is not a guarantee of future returns, but it always outlines the probabilities and hence assists with risk definition and capital management. There’s one last key point we want to develop before closing out our daily market dispatch, as it refers to the technology sector weighting and how times have changed, therefore changing the forecast for market performance.
At its peak in June 2008, the last bear market, the Energy sector was the 2nd largest in the S&P 500 and less than 70 basis points away from Technology in first. Below is a pie chart showing sector weightings back then. Energy in mid-2008 was one of the three most impactful sectors on performance along with Tech and Financials.
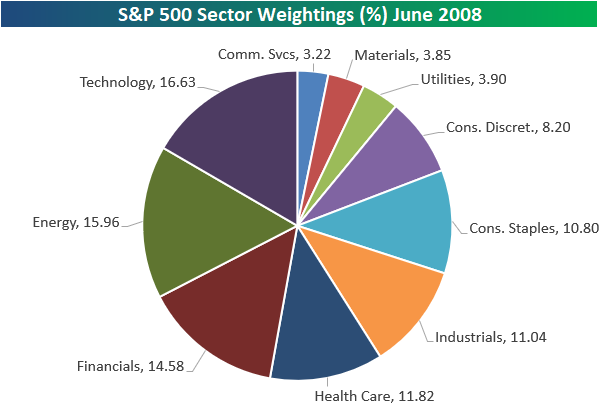
Obviously, Energy is a lesser weighting today and Technology is a much larger sector than it was in 2008. No two bears are alike folks, so remain open minded and prepared to trade the opportunities the market delivers. Finom Group has re-engaged the market with a series of trade alerts delivered over the last few weeks to our subscribers. All trades proved profitable and in accordance with what the market has been delivering, rising prices and declining volatility.
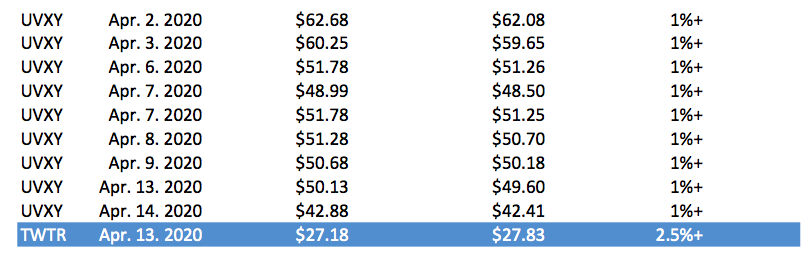
After taking the month of from trading activities in March, largely focusing on hedging and rebalancing exposure, Finom Group has re-engaged trading activities. (Trade alerts & executions for subscribers below)
Our patient discipline is managing this bear market well and what lay ahead may find patience in high demand once again. Bear market conditions are fluid and ask investors to follow the headlines for informational purposes while exercising strong discipline and flexibility. Cash is your friend, but time is your greatest asset during bear markets that ultimately lead to new bull markets. Trade safely!


