
Welcome to this week’s State of the Markets with Wayne Nelson and Seth Golden. Please click the following link to review the SOTM video. The password for the SOTM is: B9+09uk! (Must use password) We have achieved the turning point in the COVID-19 saga as the peak of the epidemic curve has been expressed this past week and governments are considering when and how to go about reopening commerce and industries. The market has been consolidating this week for time and rather sideways in price, with choppy market conditions. Tech is leading markets as Apple, Amazon, Microsoft, Alphabet and Facebook continue to capture market cap in the S&P 500. Breadth is so-so, with equal weighted S&P 500 faltering more so than the cap-weighted S&P 500 index itself.
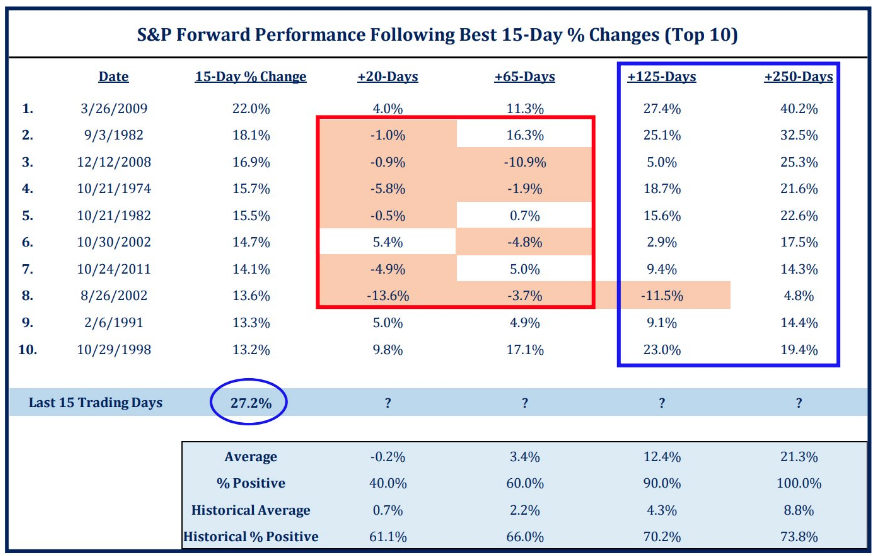
- Came into the week off of having the strongest week for the S&P 500 since 1974. (12.10%)
- Best 15-day % change at just over 27%.
- The table above identifies the average returns 20dy, 65dy, 125dy, and 250 days out.
- Historical cases are positive in increasing fashion go further out in time.
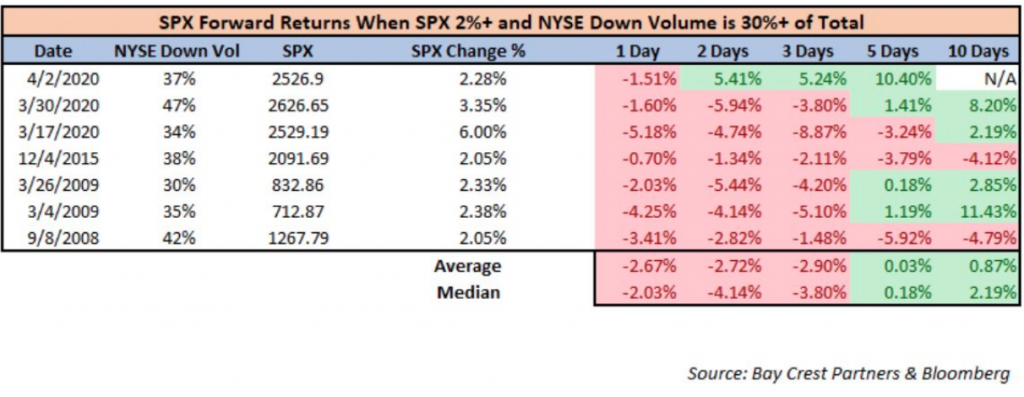
- Tuesday the S&P 500 rose more than 2% while more than 30% of NYSE volume was in declining issues.
- The table above identifies how rare this is. Only happened 7 times previously and 3 times this year.
- The forward looking returns are largely negative in the following 3 trading sessions on average, but positive 5 and 10 days out.
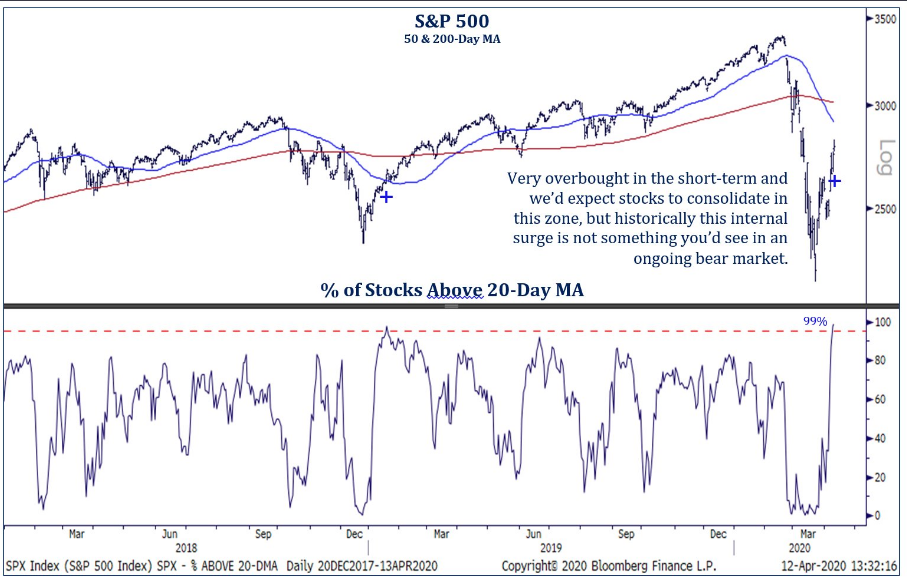
- Number of stocks trading above their 20-DMA has spiked, as the S&P 500 currently trades above the 20-DMA by roughly 200 points.
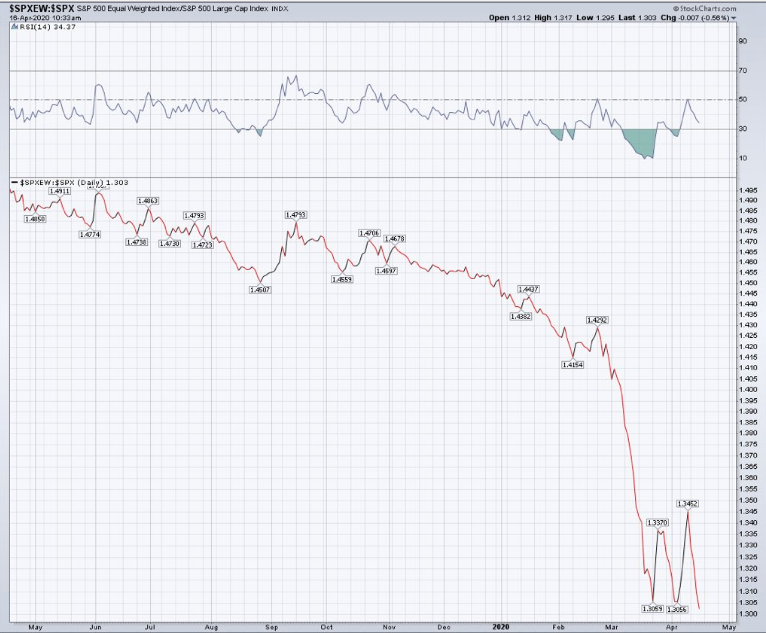
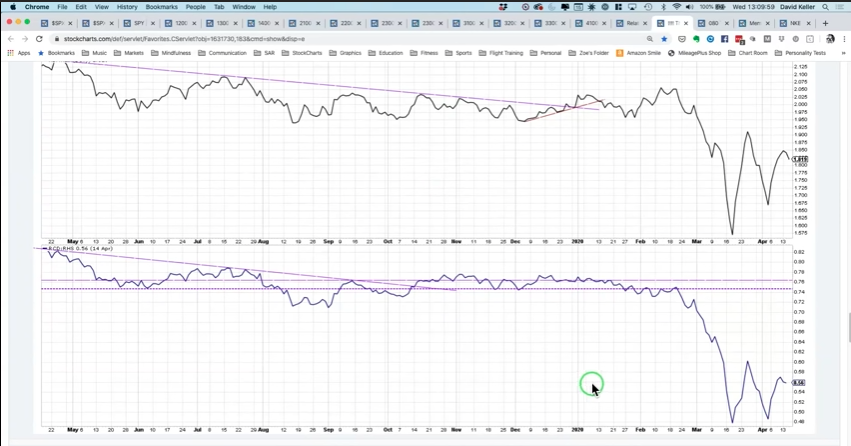
- Breadth: equal-weight vs market cap weight S&P 500. Relatively fewer/larger companies have driven this rally so far (lower panel)
- Generally, meaningful underperformance in Equal Weight leads Cap Weight lower over time.
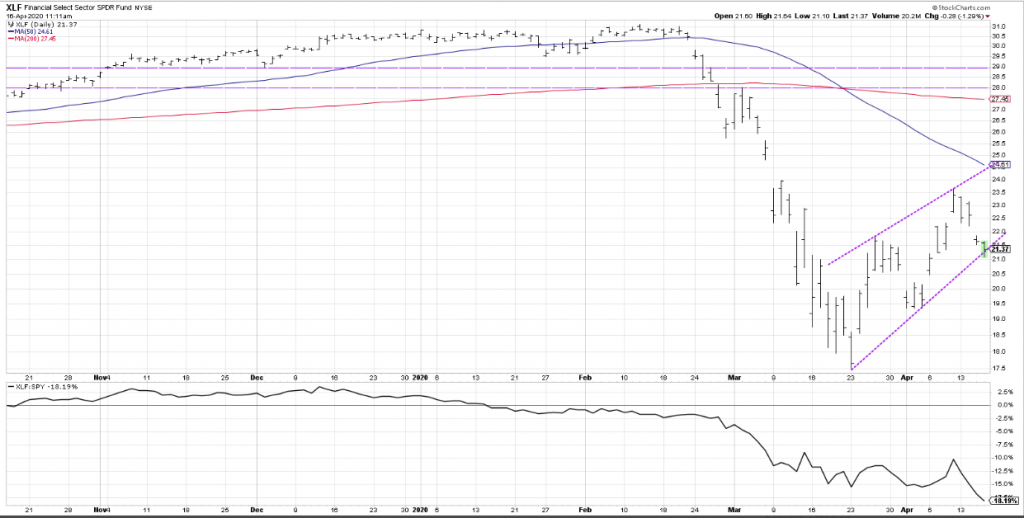
- If you’re looking for a great example chart to illustrate the next leg down, this may be the chart.
- XLF with a bear flag pattern and a break below trendline support suggests much further lows.
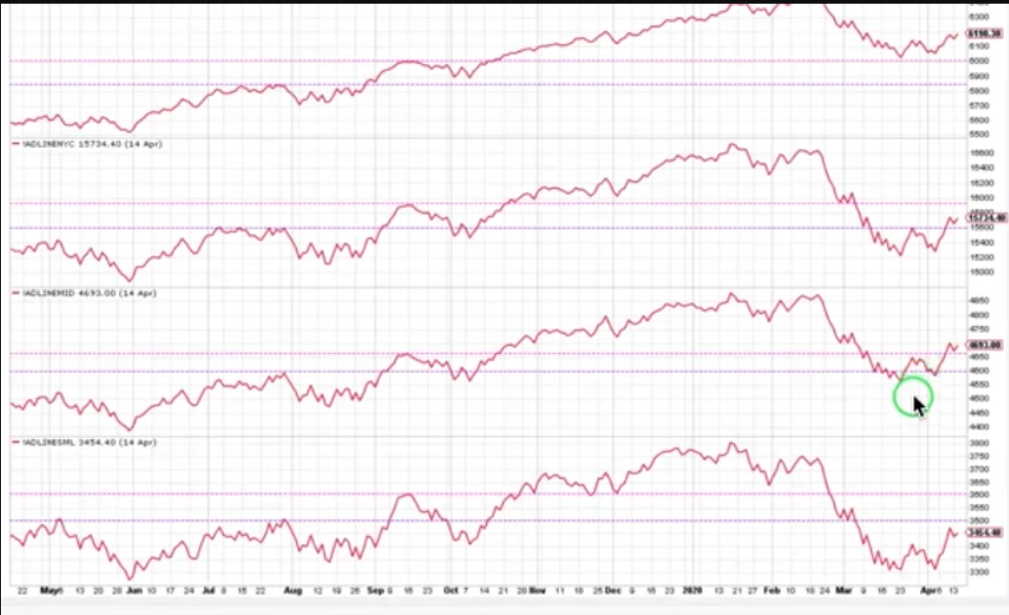
- Charts above are of the cap-weighted advance/decliners
- All cap weight advance/decline lines are showing higher lows and higher highs lately.
- This is positive overall breadth performance, still yet at weak levels overall.
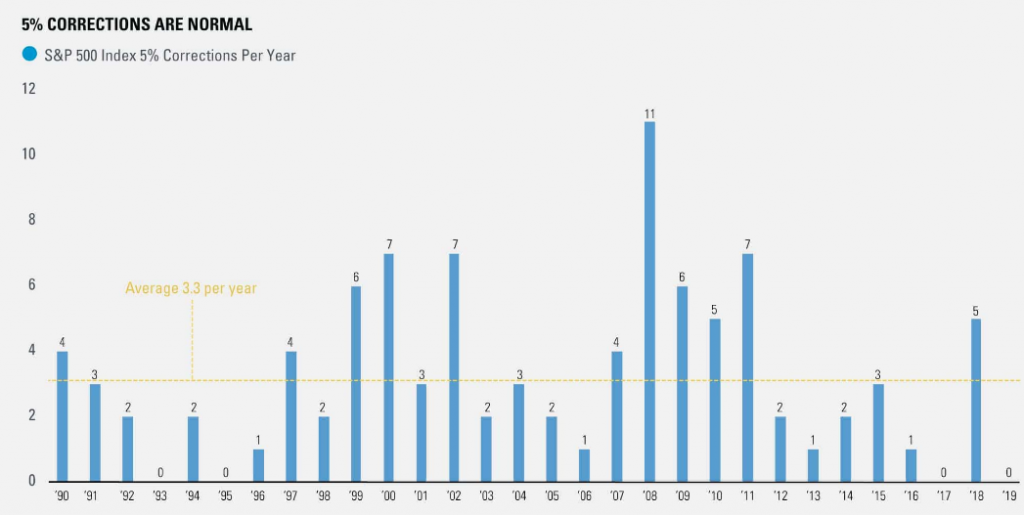
- 5% drops are normal.
- The S&P 500 averages 3.3, 5% drops a year.
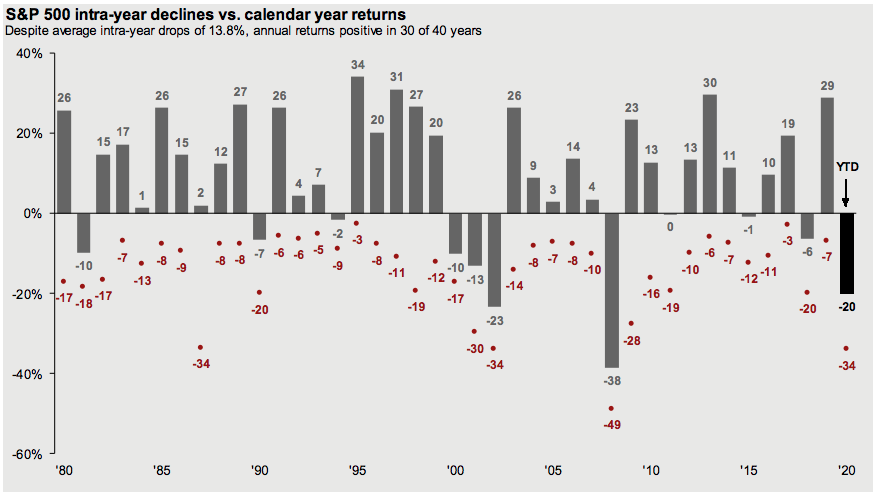
- Don’t let FOMO pervade your capital allocation and decision making.
- Least we also forget that the average intra-year drop is 13.8%. FOMO is very unnecessary.
- The relief rally from the 2,191 lows was 27.2%, second strongest bear market bounce in history and fastest in history at just 15 days.
- Only preceded by the fastest bear market in history at 16 days.
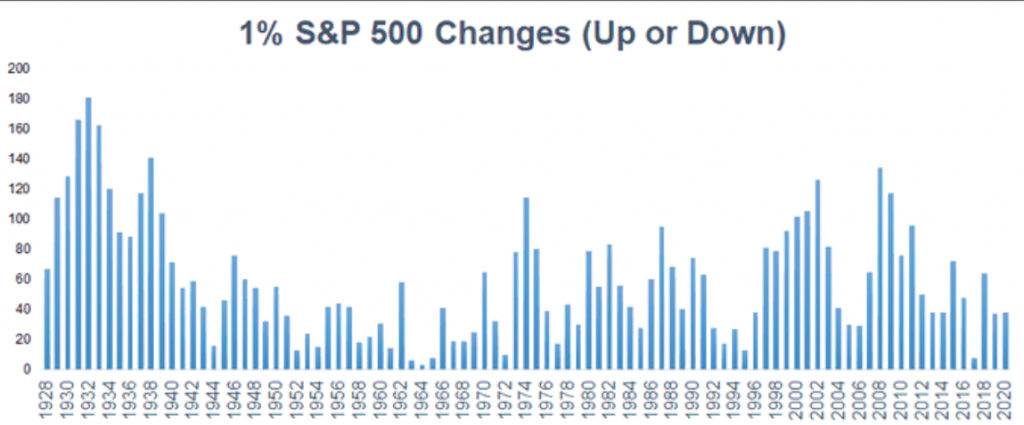
- So far in 2020, there have been 38, 1% changes (up or down).
- This tops the 37 we saw all of last year.
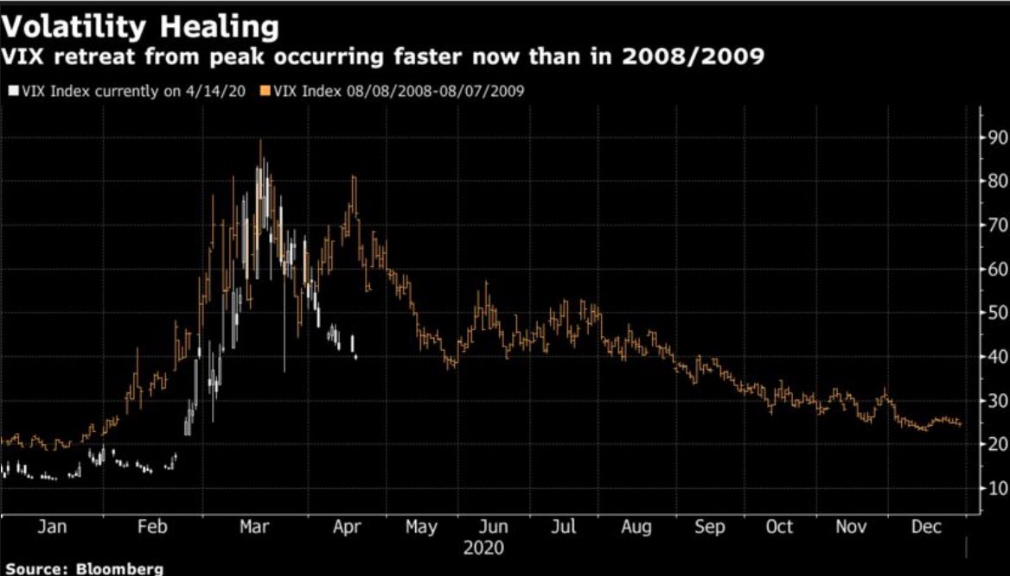
- It’s taken 18 sessions for VIX to move below 50-day moving average, compared to 23 during GFC.
- At least for now, we’ve avoided same pattern of a second spike as there was in 2008.
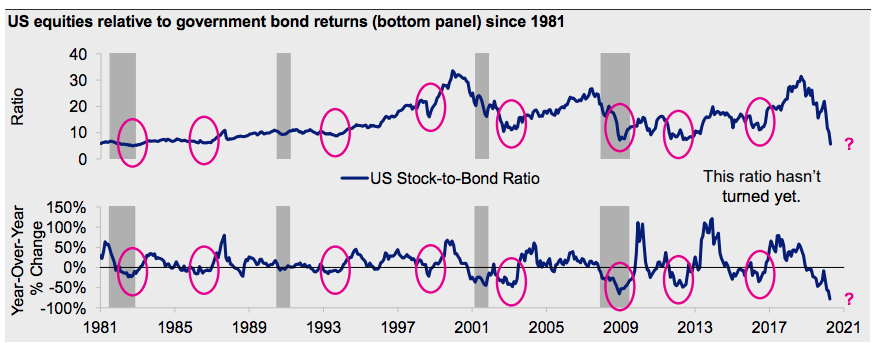
- Equities continue to underperfom bonds.
- S&P 500 relative to 10-year Treasury just reached a low not seen since 1983.
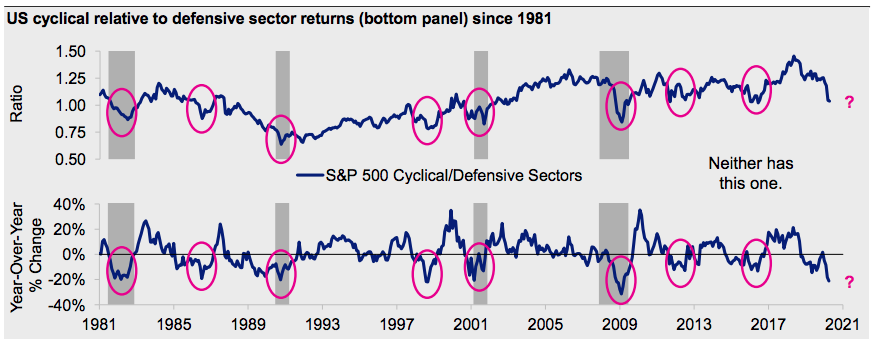
- Cyclicals continue to underperform defensive sectors.
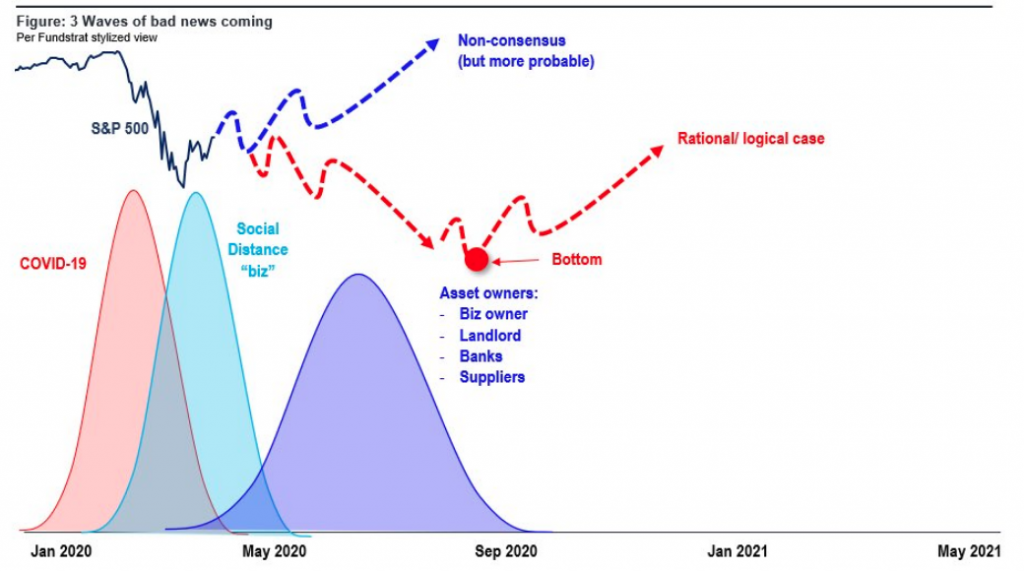
- 1. COVID-19 peak 2. 1st wave of the economic shutdown 3. The hit taken by “asset owners”: business owners, landlords, banks, etc
- Stocks bottoming now “suggests the stock market is looking past this September 2020 period.”
- FundStrat’s Tom Lee.
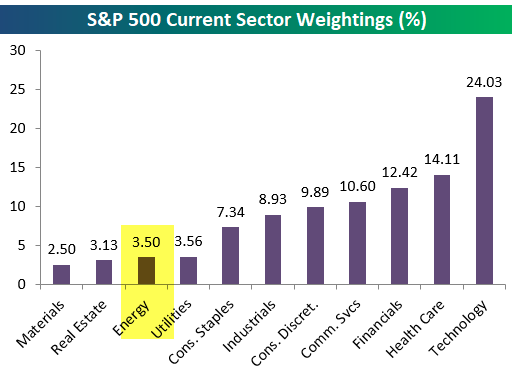
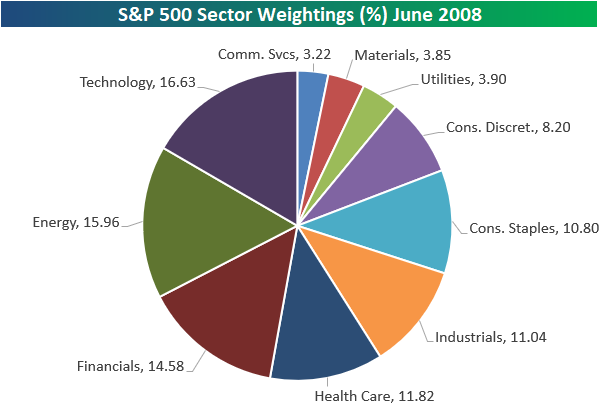
- At its peak in June 2008, the last bear market, the Energy sector was the 2nd largest in the S&P 500 and less than 70 basis points away from Technology in first.
- Below is a pie chart showing sector weightings back then.
- Energy in mid-2008 was one of the three most impactful sectors on performance along with Tech and Financials.
- The five largest names in the S&P 500: Microsoft, Apple, Amazon, Google and Facebook, “Big Tech”, but they sit in 3 different sectors and meaningfully skew returns as well as investor perceptions of “what’s working”.
Example #1: Microsoft, Apple and Technology:
- The Tech sector is down 5.1% YTD; the S&P 500 is down 13.8% on the year.
- Microsoft (22% weight) is up 9.0% YTD.
- Apple (20%) is down 3.1% YTD.
- Conclusion: take away MSFT and AAPL, and Tech is actually down 7.1% YTD. Still better than the S&P, yes, but remove the 2 stocks and returns are clearly worse.
Example #2: Google, Facebook and Communications:
- Comm Services is down 11.3% YTD.
- Google (23% weight) is down less, -5.6% YTD.
- Facebook (19%) is actually down slightly more, -13.8% YTD.
- Conclusion: Comm Services ex-GOOG/FB is down 13.1% YTD and therefore much closer to the market return.
Example #3: Amazon and Consumer Discretionary:
- Consumer Disc is down 13.6% YTD.
- Amazon (25% weight) is up 24.9% YTD.
- Conclusion: without Amazon the Consumer Discretionary sector would be down 19.3% on the year, a result that feels much more consistent with the current state of the U.S. consumer.
- The chart above (lower panel) is the equal weighted consumer staples vs. consumer discretionary.
- Better identifies state of the consumer.
- Making lower highs.
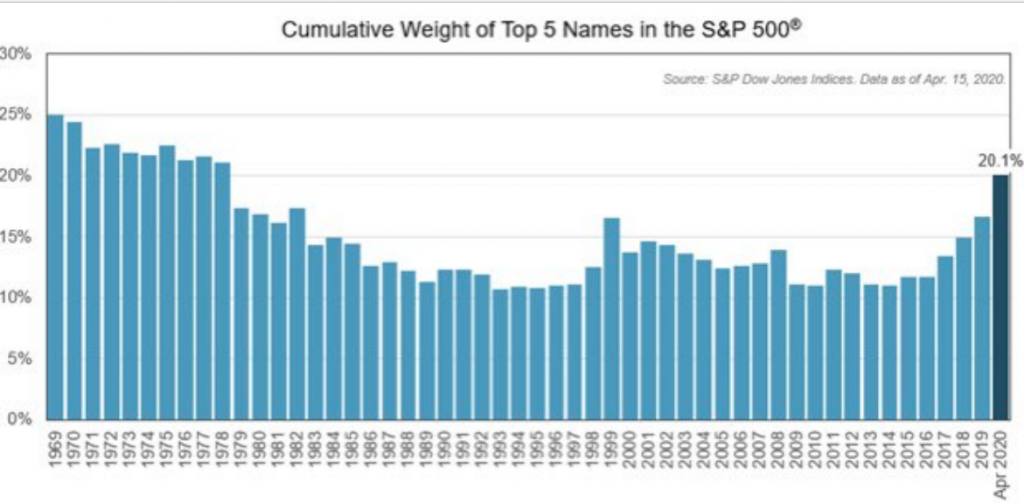
- Largest U.S. stocks have weathered storm better than most, increasing their representation in broader S&P 500.
- Largest 5 companies now represent 20% of index (haven’t seen this level of concentration since 1970s).
- Finom Group has said that we need to see tech leadership in order for the market to maintain above the bear market low.
- The technology sector remains the most heavily weighted sector in the S&P 500 and obviously it drives the Nasdaq (NDX) and Nasdaq 100 Index (QQQ).
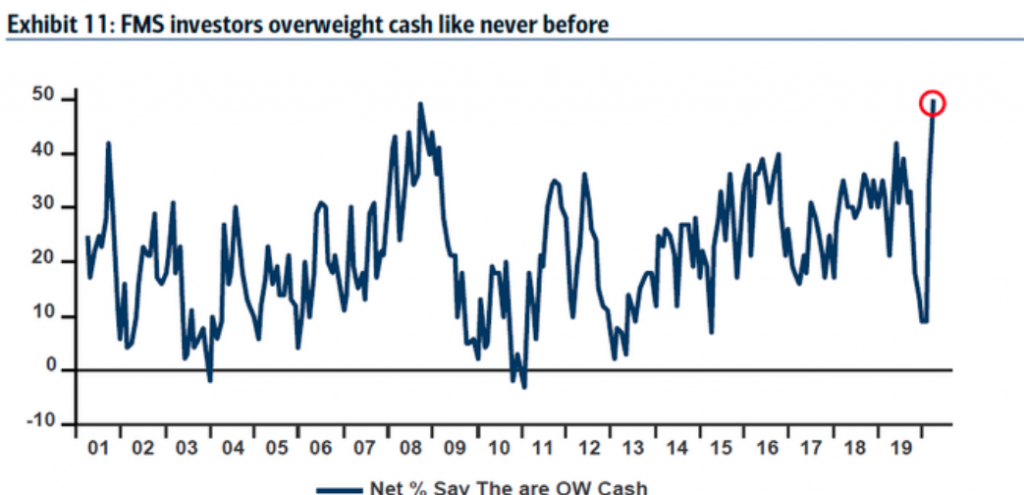
- Fund managers have allocated the largest percentage of their portfolio toward cash since the 9/11 terrorist attacks, according to a new survey released on Tuesday.
- Bank of America’s global fund manager survey finds 5.9% of funds allocated toward cash, up from 5.1% in March.
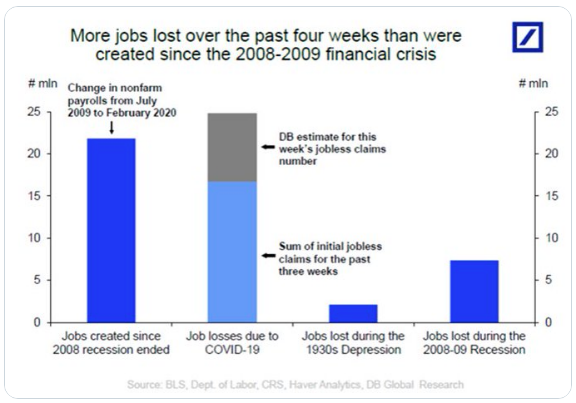
- Since the 2008-2009 recession ended, the U.S. economy created 22 million jobs.
- Including the forecast for this week’s jobless claims shows that the U.S. economy over the past four weeks lost 25 million jobs.
- A decade of job gains undone in just four weeks.
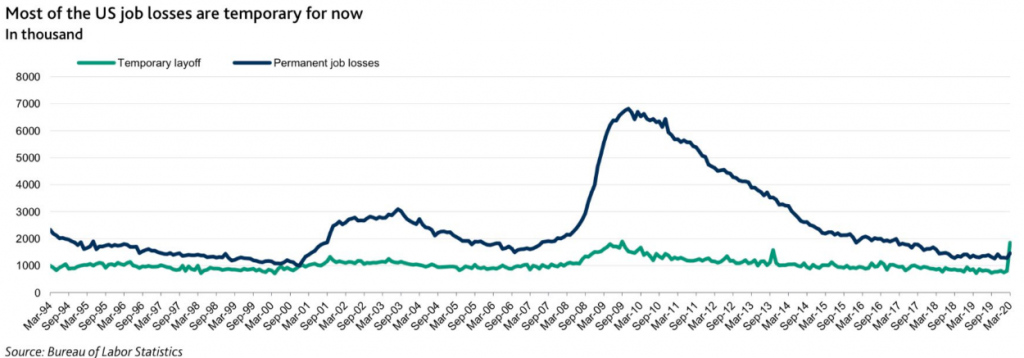
- Majority of layoffs remain temporary, & expectations are still relatively high that, once economy starts to reopen, most of these temporary losses will be reversed.
- Extended lockdowns would pose serious economic & labor threats.
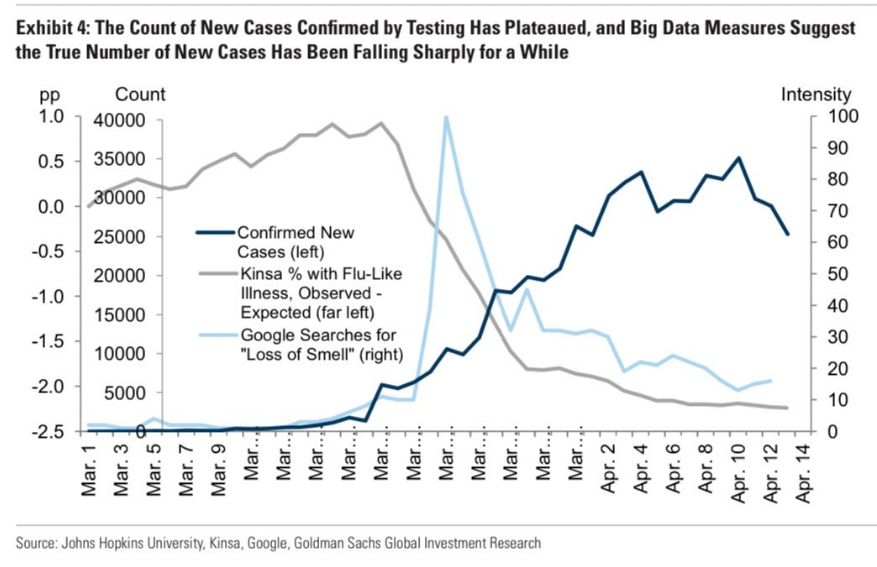
- GOLDMAN: “The latest data on the pace of virus spread are encouraging, suggesting that lockdowns have paid large dividends.
- Measures of virus spread based on big data are even more encouraging and suggest that the true number of new cases actually peaked a while ago ..”
- “If the U.S. does not experience a second surge in infections after the economy reopens, the ‘do whatever it takes’ stance of policy makers means the equity market is unlikely to make new lows,” said Kostin.
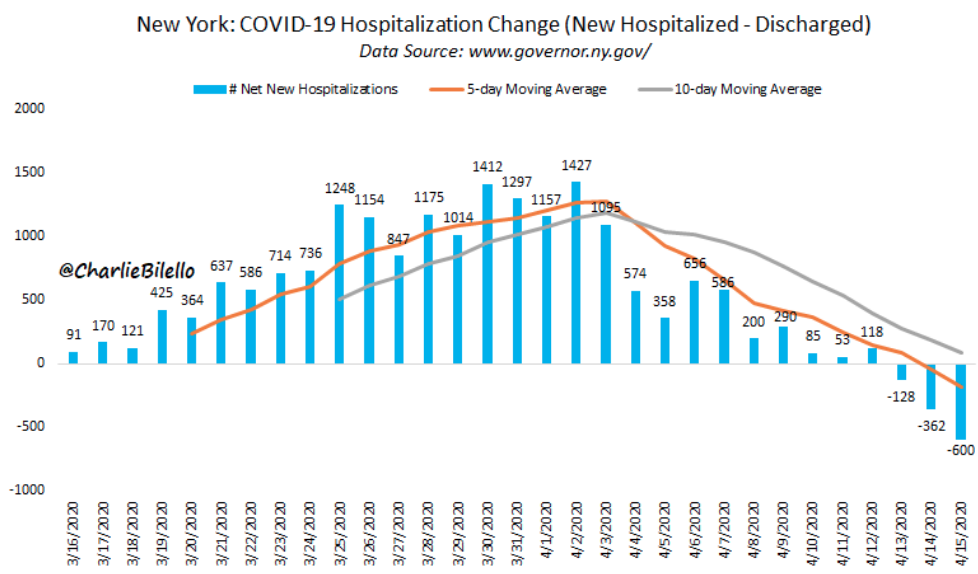
- New York just reported a decline in COVID-19 hospitalizations for the 3rd day in a row.
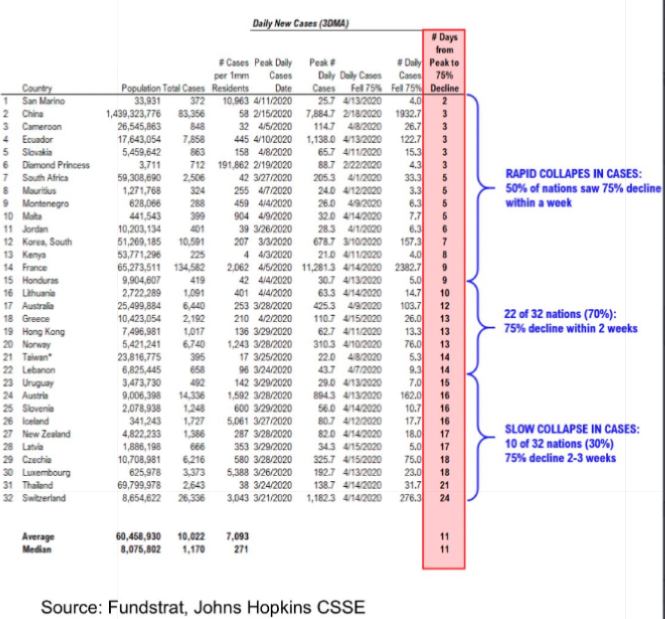
- FUNDSTRAT: “we look at how quickly other nations moved from ‘peak cases’ to ‘75% off peak’ .. and it turns out it takes about 2 weeks .. That is pretty quick. If we move this quickly to a collapse in cases, and it means NY-state really, this is a positive outcome.“
Lights at the end of the tunnel. With all the negative news out there, I think it’s important to highlight information about economies that are beginning to recover.
- Last week, Germany released its draft plan to reopen the country after April 19. This includes a requirement to wear face masks in public, limits on public gathering, and a process to rapidly trace infection trains.
- Denmark is on track to reopen day care centers and schools for children age 11 and under if the number of coronavirus cases remains stable.
- Norway is on track to reopen kindergartens on April 20, followed by older children a week later.
- Some stores will reopen in Austria on April 14, while Bulgaria is reopening farmers markets.
- Auto sales in China improved significantly in March after a pandemic-induced plunge. Sales last month were down 43% from a year earlier, which was a marked improvement over February, when sales were down 79% from a year earlier.2 China’s economic activity has slowly started to improve, but it is clearly improving.


