
If you are bullish on markets near-term, Monday’s market action likely increased your bullishness. The major indices all rose more than 3%, led by the tech-heavy Nasdaq (NDX), which is something we desired to see in order to aid in our belief in the 10% rally in the benchmark S&P 500 (SPX) from the previous week. Unfortunately, last week’s rally found tech lagging behind its peer sectors and indexes. We discussed the need for tech to lead us out of this bear market in our weekly Research Report as follows:
“As noted in the bullet points above, one of the variables we need to see in order to lend credibility to a market bottom, as we remain within a bottoming process, is tech has to outperform and lead. That did not take place last week as the tech-heavy Nasdaq (NDX) actually lagged the S&P 500 Dow Jones Industrial Average (DJIA) and even the Russell 2000 (RUT). Remember, offensive sectors rolled over in the latter trading days of the week, in favor of defensive positioning.
For over a decade now, the Nasdaq has led its peer indices and it needs to do so going forward based on sector weighting within the S&P 500, at least.
- Technology: 30.3% (adding back Google and Facebook, currently in Communication Services).
- Health Care: 15.2%
- Financials: 13.8% (adding back Real Estate current 3.0% weight)
- Consumer Discretionary: 11.9% (adding back Disney, Comcast and Netflix, currently in Comm Services)
- Consumer Staples: 8.2%
- Industrials: 8.0%
- Telecomm: 4.3% (Comm Services minus adjustments noted above)
- Utilities: 3.5%
- Materials: 2.4%
- Energy: 2.4%
This idea of tech needing to lead is also outlined by J.C. Parets of Allstar Charts and as it relates more closely to the tech-heavy Nasdaq.
“One of the strongest relative trends we’ve been pounding the table on for years is the outperformance of the technology sector (XLK) and the tech-heavy Nasdaq relative to other major U.S. indexes.”
As we also offered in our weekly Research Report, “Bear markets are never easy; they are not supposed to be fun, but rather arduous and taxing on emotions, especially if you’re not prepared and overly indulge in headlines. These market conditions beg of resolve and a strong constitution in order to recognize and benefit from what all bear markets eventually produce… maximum opportunity!“
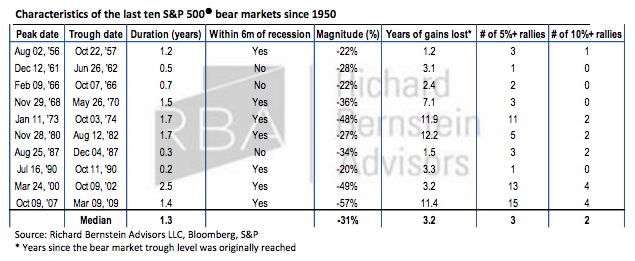
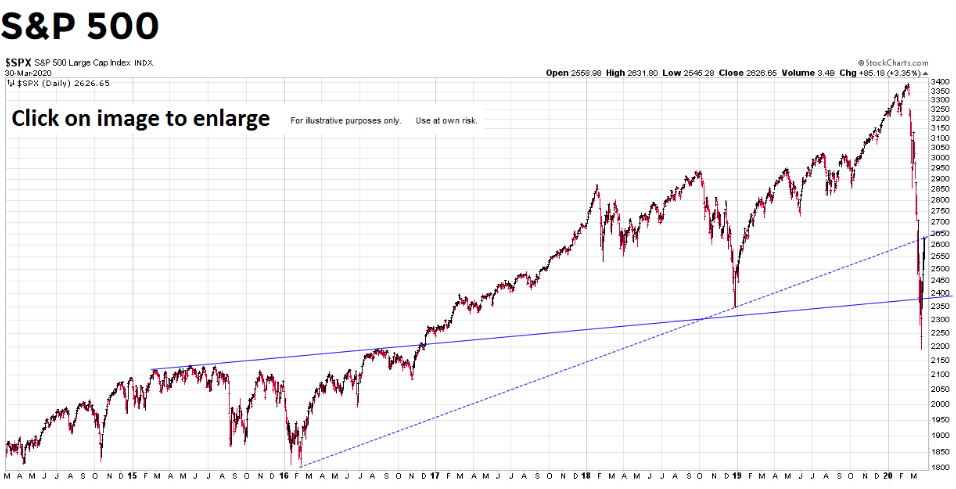
- A typical bear market lasts more than a year (particularly those coinciding with economic recessions), wiping out over 3 years of market returns, which in this case would put the S&P 500 back at December 2016 levels around 2,200-2,300.
- Markets do not move in straight lines. Every bear market that has occurred since the 1970s — with the exception of the 1990 bear market, which technically did not actually cross the 20% bear market threshold — has been accompanied by significant rallies on the way down.
- Each bear market is unique, but there does seem to be a decent relationship with the starting valuation and the magnitude of the subsequent drawdown. The abnormally high starting valuations this time would suggest nearly 40% downside from the peak (S&P 500 <2,100) vs. the typical 30%. (Richard Bernstein Advisors)
Due to the extraordinary macro forces pushing on markets, each trading day becomes an exercise in discipline for traders and investors. We’ve never had a pandemic shutter the economy and produce a bear market with such rapidity. As such, the market rally that began last week and which has filtered through to Tuesday equity futures begs of investors to remain flexible, cautiously optimistic and patient. These types of “bear market rallies” have often been reversed in the past.
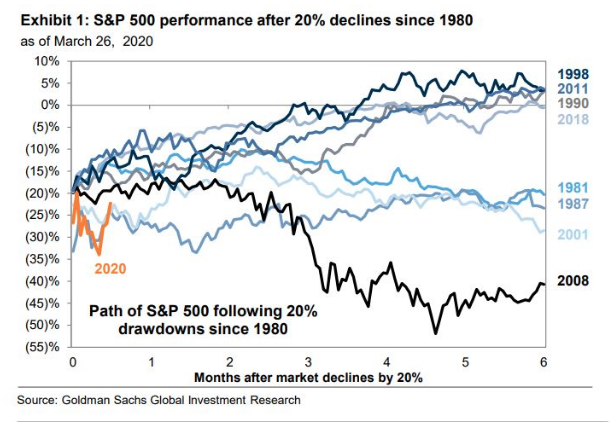
As we can see from the Goldman Sachs chart above, the most recent recession and bear market of 2008 had a substantial bear market rally and ultimately retested and achieved new lows months later. Most bear markets have these types of rallies and demand leadership and strong breadth to signal an absolute bottom, otherwise, these rallies are understood to be a part of the bottoming process. Wells Fargo view the bottoming process and its gyrations as falling into one of three phases:
- The Breakdown
- The Consolidation
- The Bullish Breakout
Below, we take a look at some of the tendencies each of these phases displays, based on price action during previous periods of turbulence.
Phase 1: The Breakdown
Markets in uptrends tend to look at new developments, especially negative ones, through a glass-half-full lens and are initially quick to dismiss those developments as insignificant, with the most recent example being the first signs of COVID-19 cropping up in China. Over time, the damaging impacts of the new development continue to nag at market participants and lead to negative surprises on the economic and fundamental data fronts, making it harder and harder to ignore them. Of course, we don’t typically value the new developments or their impacts without hindsight. Eventually, there is an acceptance that the investing environment has changed, as investors re-engage their outlooks and reposition by selling risk assets.
Unfortunately, when the trend changes from higher to lower, the herd must reposition portfolios simultaneously, and that can lead to bouts of illiquidity, which in turn can lead markets to overshoot their fair value. During this phase, we typically witness extreme correlations amongst asset classes which also defines the onset of the bottom process.
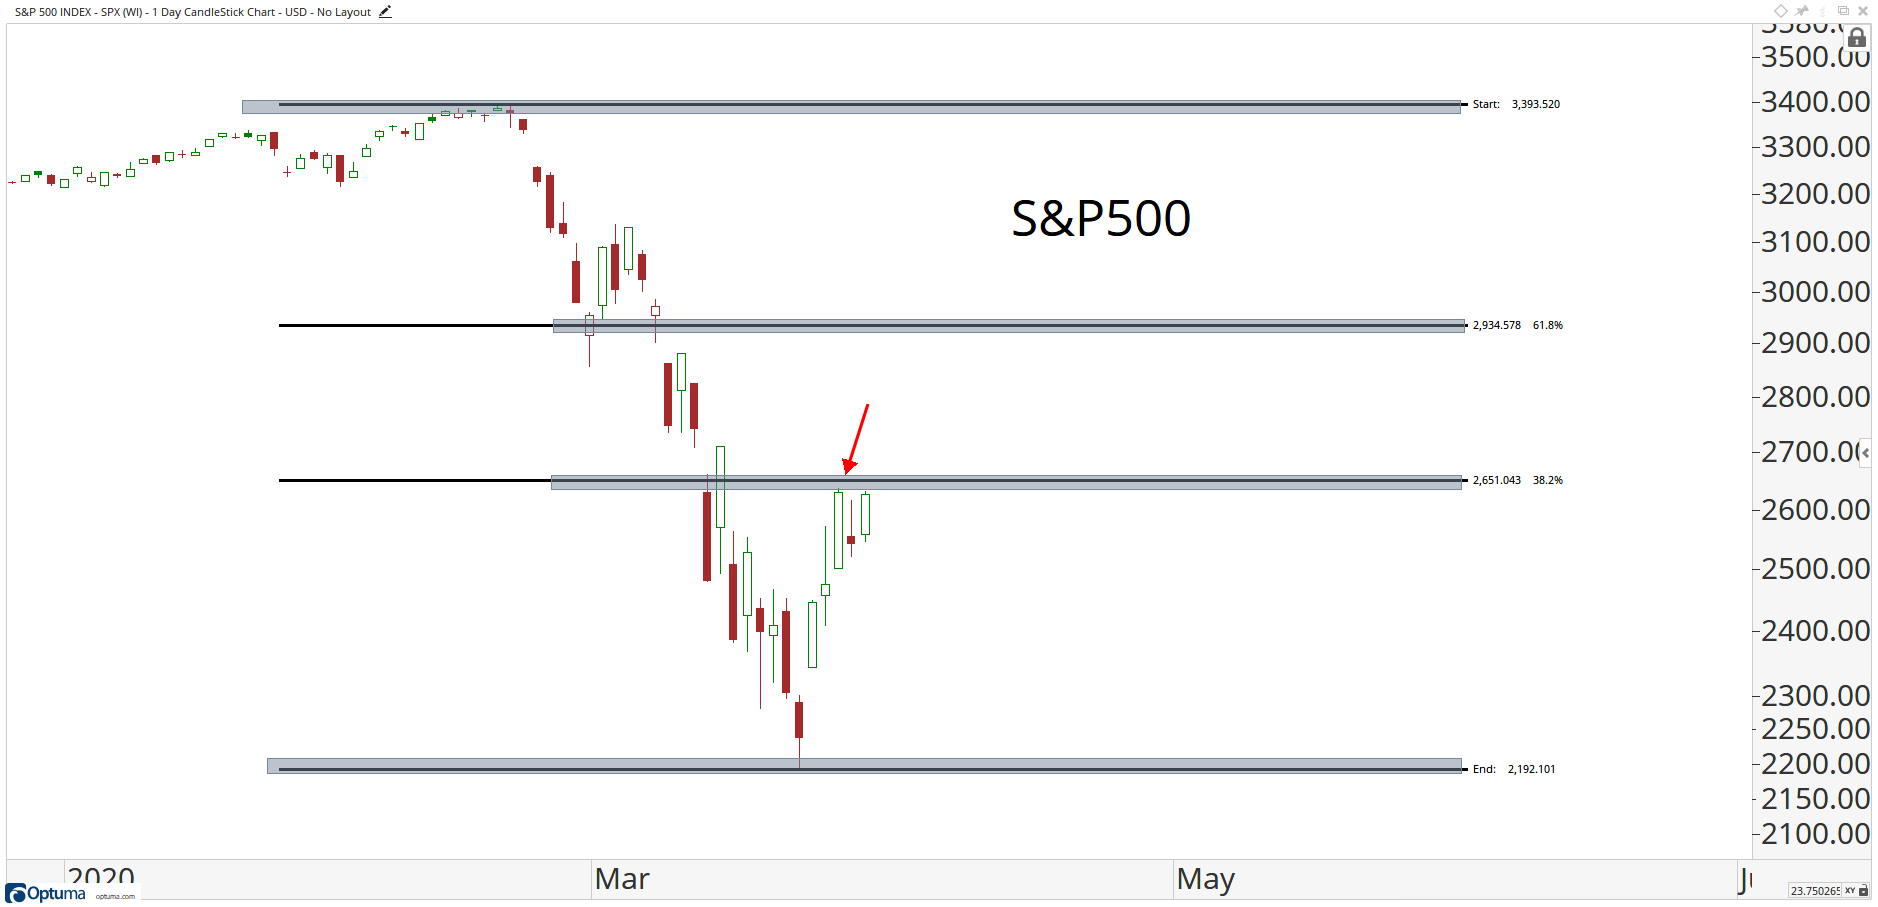
Defining characteristics of this phase tend to be spikes in volatility, oversold markets, and washed-out market internals (for example, very few stocks at 52-week highs or deteriorating cumulative advance-decline lines). It is worth noting that the Breakdown Phase tends to be the shortest of the three phases in the bottoming process. Based on what we see in Chart 1, which overlays the trajectory of the current S&P 500 Index price (orange line) against the bear market of 2008-2009 (purple line), we believe that we are currently in the latter stages of Phase 2.
Chart 1. Bottoming of equity market is a process, not a price

Phase 2: The Consolidation
Once the selling exhausts itself, markets historically have tended to jump sharply off the lows and retrace a good chunk of the price decline. Unfortunately for investors’ frayed nerves, this is the very beginning of the Consolidation Phase, which is often the longest of the three phases in the bottoming process. After the initial retracement is over, and investors realize that a V-shaped bottom is highly unlikely and that they are going to be living in the new regime for the foreseeable future, markets often retest the previous lows.
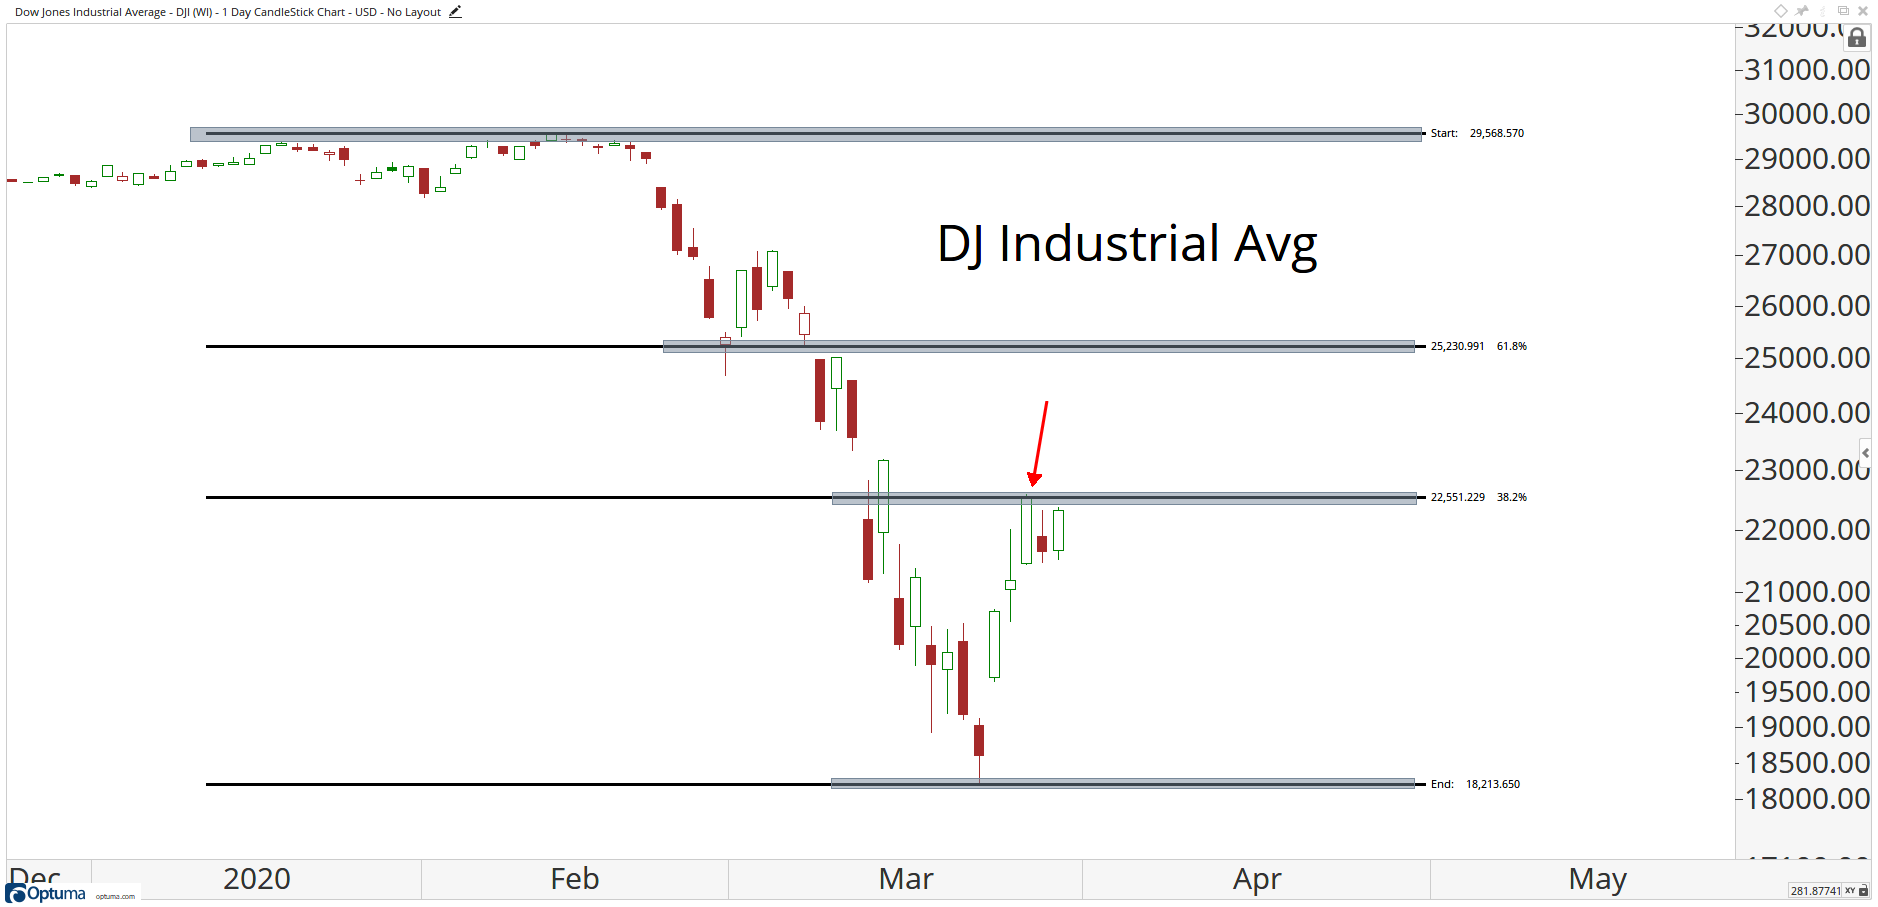
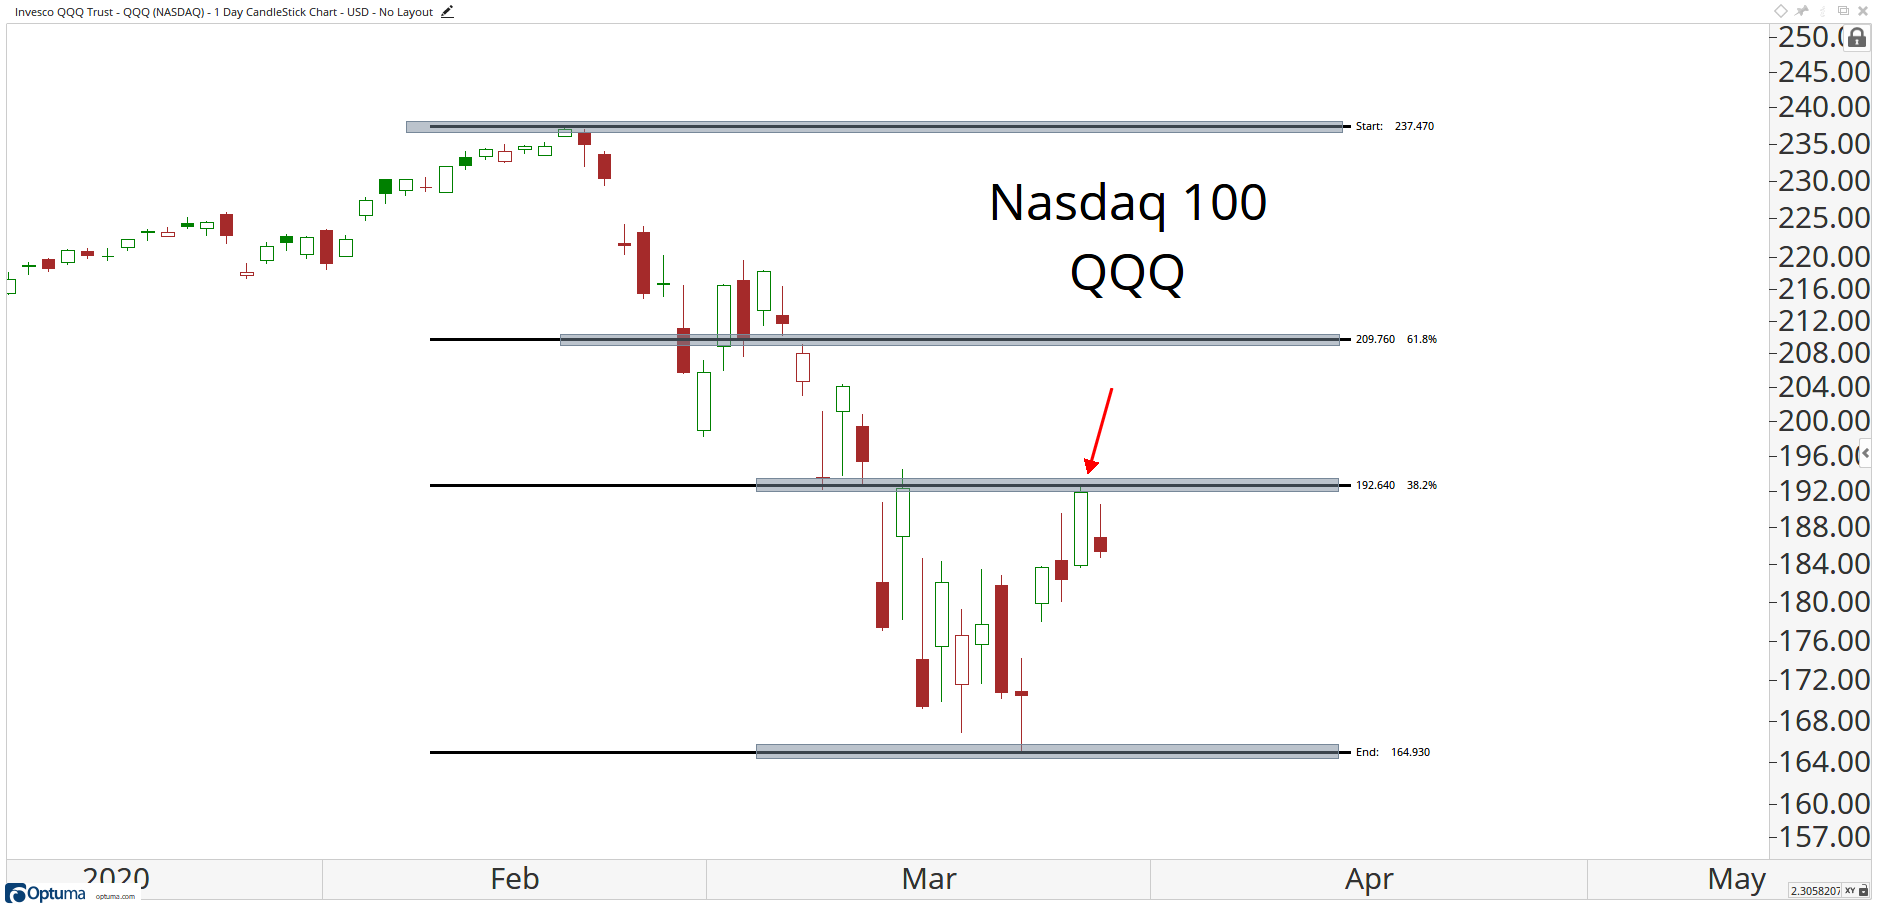
The S&P500, Dow Jones Industrial Average (DJIA) and Nasdaq all retraced 38.2% of their entire declines: (Allstar Charts)
During the retest, markets also can reach new lows from time to time. Once a well-defined trading range has been established, markets wait as long as needed for the underlying issue to resolve itself and for the economic impact to become clearer.
The Consolidation Phase historically has presented the biggest test of emotional fortitude and investment discipline. Sharp rallies can present a siren song of opportunity that will try to entice investors back to the lowest quality areas, with promises of quick gains, only to be dashed quickly by disappointments that lead us back to the lower end of the trading range.
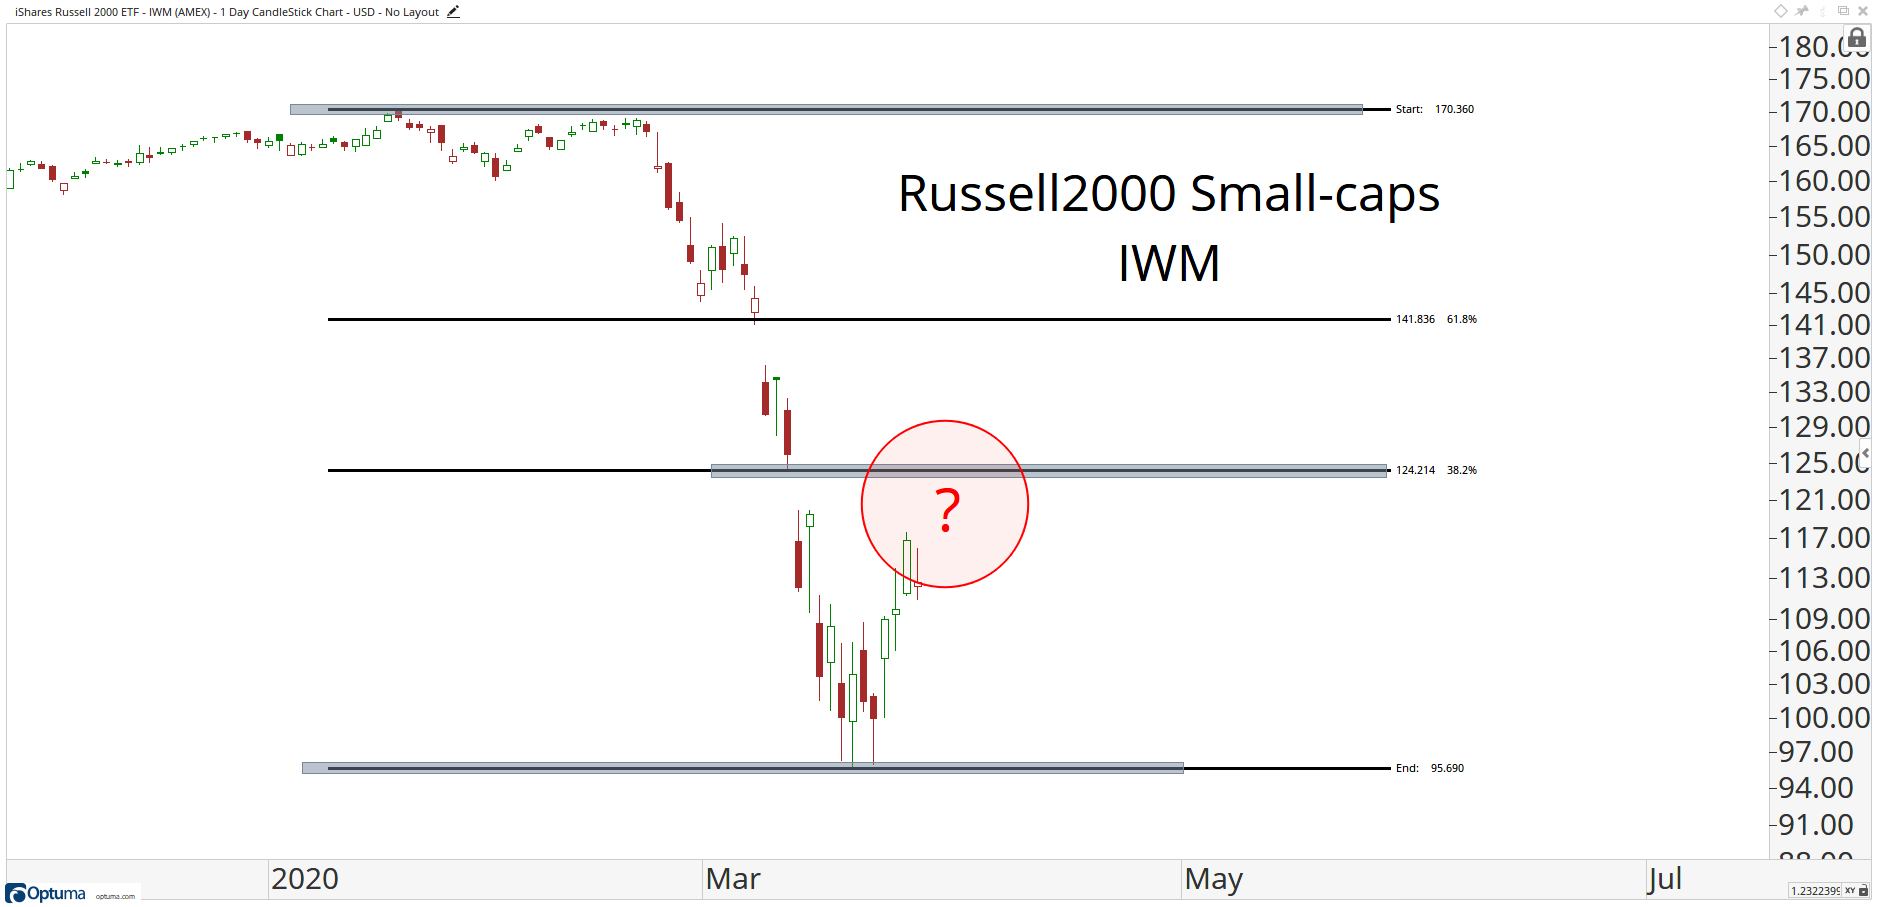
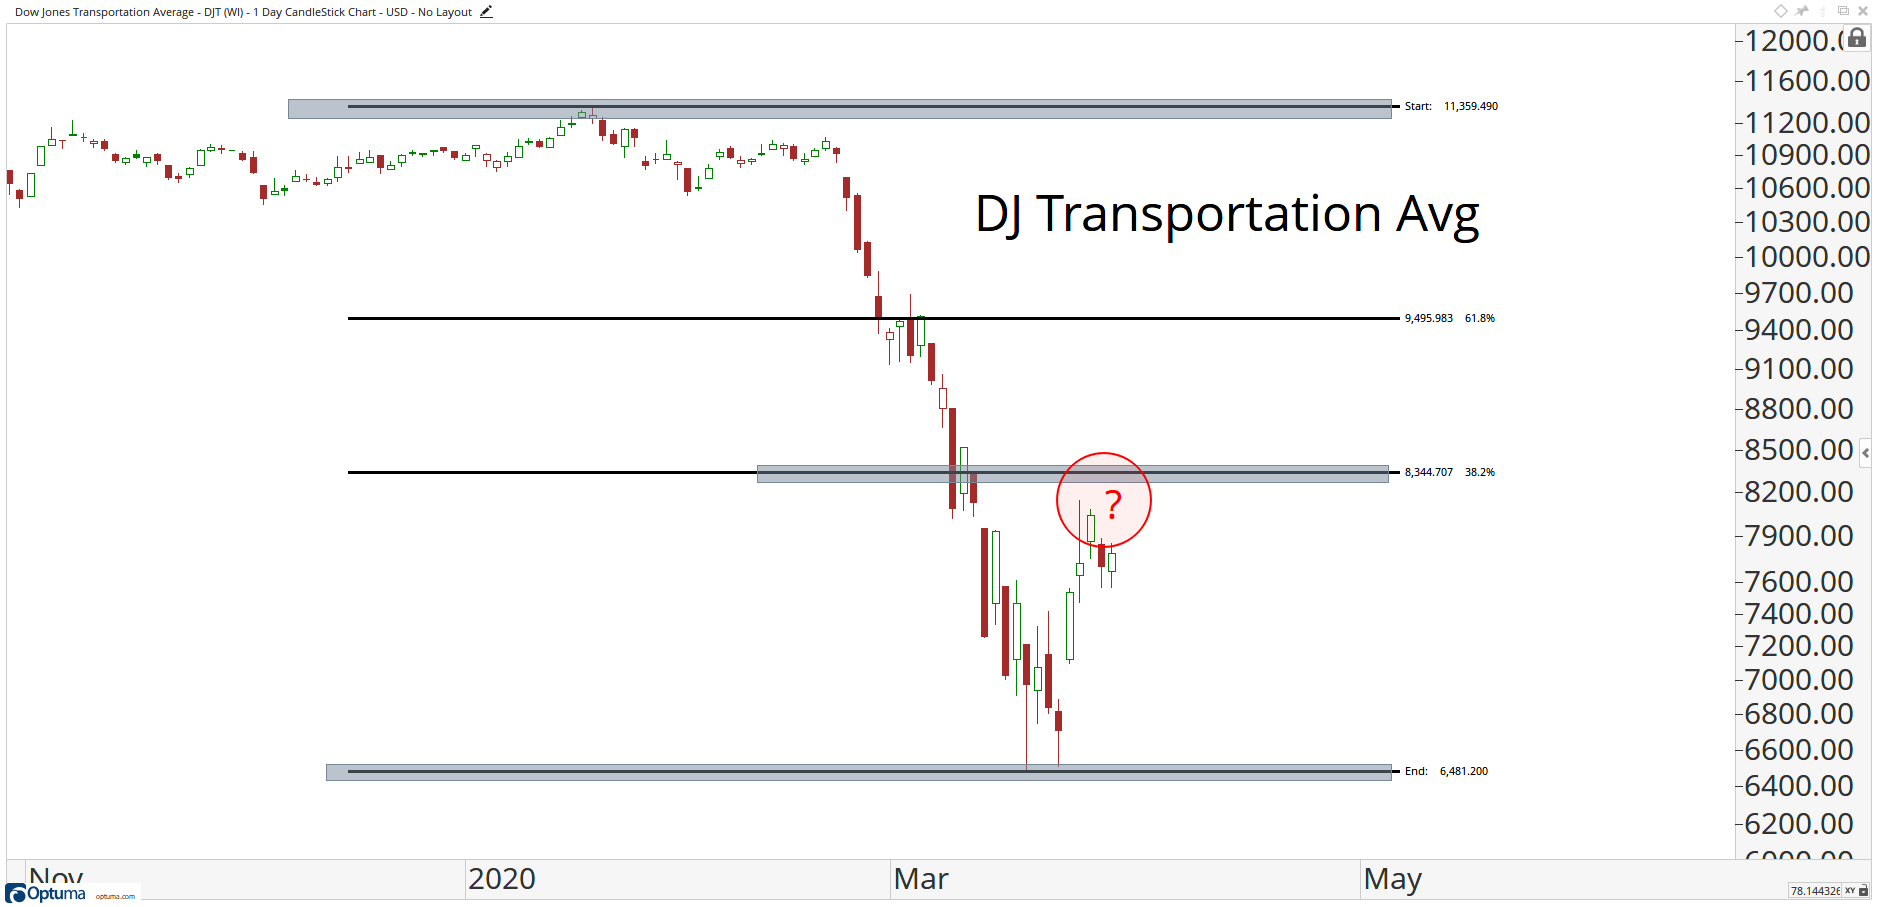
We believe investors would be well-served if they use rallies to continue to rebalance market exposure. Our least favored areas of the market are U.S. Small Caps, Emerging Market Equities, and Developed Market ex-U.S. Equities, as well as the Energy, Materials, and Industrials sectors. These areas/sectors of the market typically underperform during bear markets and continue to do so in the current bear market.
Small-caps have not reached their 38.2% retracement.
Same with the Dow Jones Transportation Average. Weak Bounce:
Investors should focus new acquisitions/buys in areas with better risk-reward outlooks, in our view. Finom Group favors information technology, FANG stocks and certain consumer staples which have relatively outperformed for the better part of the last 18 months.
Phase 3: The Bullish Breakout
Phase 3 is usually signaled by a breakout above the upper end of the trading range. This is an initial signal that the bulls may finally be regaining the upper hand. By this point, the economic and earnings outlook should be coming more clearly into focus, and growth should be turning back toward the positive side. Most active portfolio managers are not found waiting for such clarity as the best prices are usually revealed several months before and the market has already priced in a return to growth. The real debate becomes what valuation multiple investors are willing to pay for those earnings. Any pullbacks in this phase have tended to be short and shallow, frustrating investors who may be looking for one more retest of the lows as a chance to buy equities.
According to Goldman Sachs’ chief market strategist David Kostin, here is what he believes investors need to consider going forward, in order to call a market bottom:
- The viral spread in the United States must begin to slow, so that the ultimate economic impact of the virus and containment efforts can be understood.
- There must be evidence that “extraordinary measures” taken by the Federal Reserve and Congress to support the U.S. economy are sufficient. “While the willingness of policymakers to use all the tools at their disposal is clear, only time will tell to what extent the actions succeed in limiting defaults, [business] closures and layoffs.”
- Investor sentiment and positioning must bottom out. Goldman analysts point to their U.S. Equity Sentiment Indicator, which combines nine measures of equity positioning, noting that it has only declined by 1.4 standard deviations, versus standard deviations of between -2 and -3 in recent corrections.
- The Goldman analysts also warn investors of another headwind for equities going forward: greatly reduced corporate share buybacks. They point out that nearly 50 U.S. corporations have suspended existing share repurchase authorizations in recent weeks, “representing $190 billion in buybacks, or nearly 25% of the 2019 total. “Buybacks have represented the single largest source of U.S. equity demand in each of the last several years, and we believe higher volatility and lower equity valuations are among the likely consequences of reduced buybacks.”
The halt to the economy and buybacks definitively represents a headwind for equities near-term. Without buybacks and with the majority of pension fund rebalancing in the rear view window, Morgan Stanley believes the risk/reward is again tilted away from equities.
“A week and a half ago Morgan Stanley QDS forecast $160bn in month-end equity buying as pensions and asset allocators would need to reallocate portfolios. Since then the S&P 500 is up 10% and is up 17% off the Monday lows. Our models now suggest $50bn still to buy globally (with $25bn in the US) and while that figure is still large, much of the impact may already be in the price. Low liquidity (need to start earlier to spread the flow out over more days) plus an attractive opportunity to monetize the rally in bonds and rotate into equities likely has brought forward some demand (dispersion over the last few days has been in the 8th %ile since 2012 suggesting index led moves), and conversations with clients appear to suggest allocators are looking more favorably on credit than equity now. Equity allocations are likely now less than 1% off of target weights, which may be close enough for many allocators in this uncertain environment.“
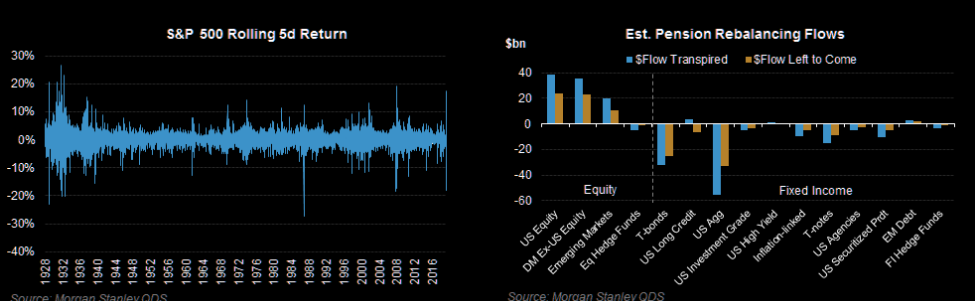
“While markets can certainly keep going higher (QDS still does forecast net equity demand over the next few days), the risk/reward of being long on asset allocation expectations alone is less clear and QDS is no longer as tactically bullish. QDS favors overwriting longs here or buying 1×2 call spreads to position for more modest near-term upside. Looking beyond month-end, QDS is concerned about a) retail MF redemptions and b) risk of L/S HF selling of Tech stocks after a strong rally in crowded longs.“
Post the pension fund rebalancing period, other investor classes will need to step up to the plate in order to sustain market momentum to the upside. The nearly 20% S&P 500 rally off the lows set last Monday also comes on the heels of the most bullish hedge fund sentiment in 18 months, according to Credit Suisse net positioning tracker.
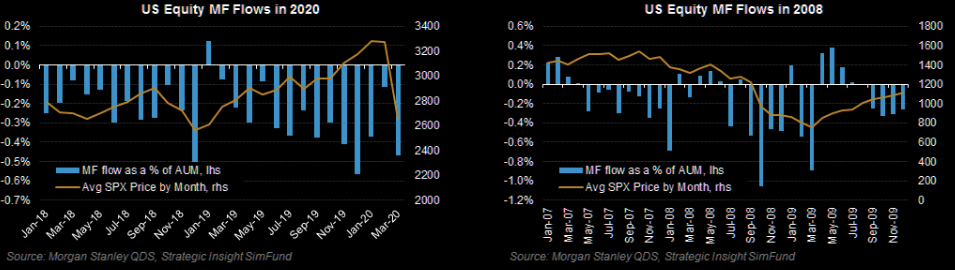
Also according to Morgan Stanley, so far retail investors have been redeeming U.S. Mutual Funds (MFs), but not yet enough to call it “capitulation”. But individuals could start to draw down savings and sell equity MFs quicker if cash is needed over the next few months. This is made easier by the waiver of the 10% penalty on withdrawals of up to $100k from retirement accounts (which hold nearly $6tr in equity MFs) for hardship purposes in the stimulus bill. MF selling will likely come more gradually relative to some of the recent systematic flows, but could be a consistent overhang for the next few months. In late 2008/early 2009 equity MFs (ex-ETFs) saw ~55bps of outflows per month, which on today’s AUM would mean about $40bn of selling per month. But the average monthly outflow since 2019 is already starting from a much higher figure now (-25bps/month) than it was in 2007/2008 (-8bps/month). And remember that the largest two sources of demand for equities over the last decade have been passive inflows and buybacks (which are also set to see sharp declines with over 80 companies now terminating or suspending buybacks). If withdrawals do hit 401ks this could negatively impact more Defensive stocks on the margin, since that is where passive funds have the biggest overweights.
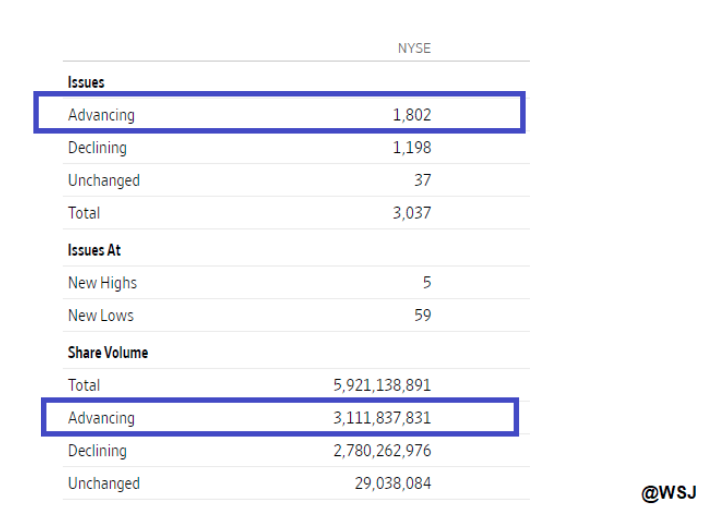
While that which has been presented before investors begs of remaining cautiously optimist, as the human spirit and ingenuity will prevail over COVID-19 eventually, the uncertainty over the near-term outlook remains. As such, the technical picture of markets takes a step forward, given the fundamental shortcomings. During the markets’ rally Monday, breadth was so-so. (53% advancers)
During Monday’s trading session, the S&P 500 narrowly missed closing at or above the 20-DMA, which is at 2,633 presently. The S&P 500 closed the gap that was opened on Friday at 2575, removing a short-term hurdle that threatened to bring an abrupt halt to the rebound rally that started a week ago.
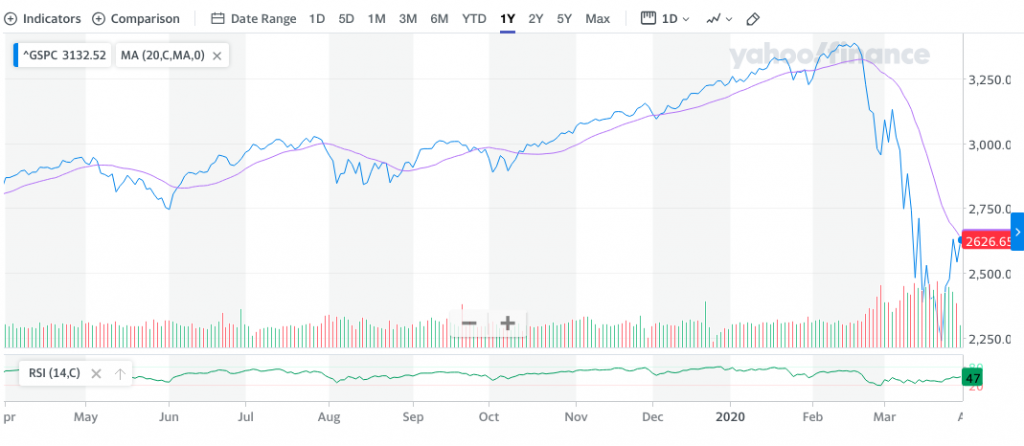
The big hurdle remains the open gap around 2700 that was charted in the middle of the month. This gap has seen a few tests throughout the past couple of weeks, but each attempt has seen prices retreat. Short-term momentum is now behind the benchmark to present a strong attempt to break the level of resistance overhead. On the hourly chart, momentum indicators had been positively diverging from price coming into this rebound rally and they continue to trend higher.

Thus far, the technical strength of the market continues to show improvement, as we would have expected and due to the passage of the fiscal relief passage (Cares Act). Resistance levels remain overhead as noted, but today will be a key test for markets to also see if the S&P 500 can close above its 200-WMA.
The 200-WMA (2,637) has proven support dating back to 2011 and before it was sliced through in the recent bear market. Now, like most moving averages, it provides resistance to the upside and demands of improved market breadth going forward in order to sustain the rally and move that much higher. If we’re comparing 2008’s bear market to that of today, during the countertrend rallies in late-2008/early-2009 the percent of S&P 500 stocks trading above their 200-EMA never exceeded 10 percent. On Monday, it closed with 12% trading above their 200-EMA. Not a bad start!
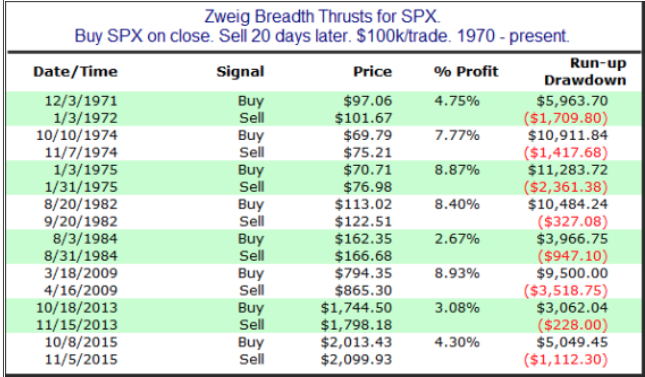
In addition to the number of stocks trading above their 200-EMA, a Zweig breadth thrust is on the verge of firing. What is a Zweig Breadth Thrust might be asking?
Created by Marty Zweig, his eponymous indicator occurs when the 10-day average percentage of advancers swings from less than 40% to over 61% within 10 days. As Tom McClellan says, “It is a sign that a rapid surge of money is trying to push its way through the door to get into the market.” Since 1962, there have only been 11 Zweig breadth thrusts.
The forward results are impressive when this occurs. Since 1970, the S&P 500 has continued to rally every time over the next 20 days by a median of about 6% (table from Quantifiable Edges).
For some of our readers, members/subscribers the aforementioned Zweig Breadth Thrust and table may seem familiar. Before we tell you why…
There are a lot of interesting stats on how the S&P 500 performs going forward after a Zweig Breadth Thrust occurs. As it pertains to what matters most near term we’ll simply outline the occurrence within the context of a double-bottoming process or even a lower low for the S&P 500. (chart below denotes Zweig Breadth Thrust in 2019, right most side).
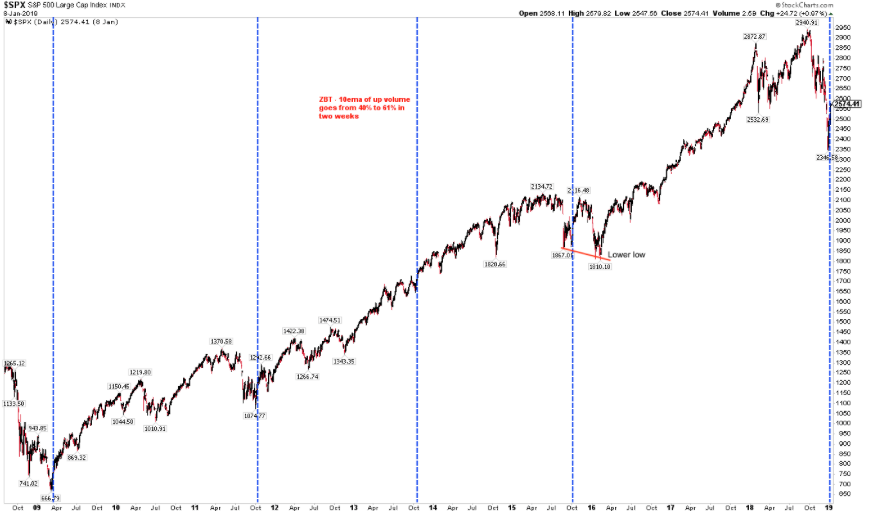
Of the 11 Zweig breadth thrusts in the past 60 years, only one (in 2015) was followed by a lower low before a new high was achieved. In that one instance, the February 2016 low was just 2% below the low on August 2015 (closing basis). Importantly, in between those two dates, the S&P 500 came within 1% of its all-time high from May 2015. Historically, only have 1 lower low after a Zweig breadth thrust helps to define risk near-term and with a good deal of statistical probability.
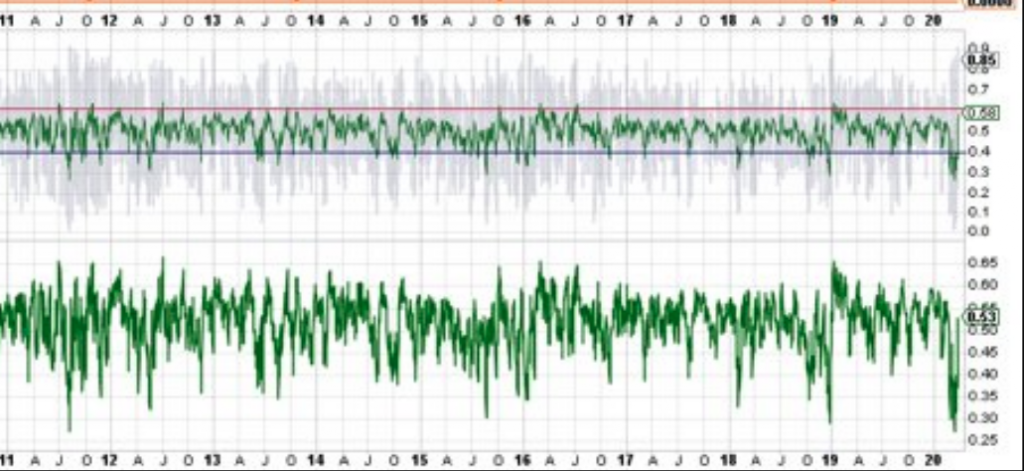
The reason why the aforementioned information on Zweig Breadth Thrust might look familiar is because it comes directly from our January 13, 2019 Research Report titled Fund Flows, Market Breadth & Price Action All Looking Up . We all know what took place from that point forward in 2019. This is not to suggest the same will happen this go around or suggest the “bottom is in”. Keep in mind that the 2019 Zweig Breadth Thrust was also accompanied by a Breakaway Breadth Thrust (this occurs when 10-day advancers are twice 10-day decliners. In order for this to occur, it requires persistent strength without any intervening weakness over a 2-week period) and absent a recession. All we are suggesting is that investors remain flexible, with an open mind, disciplined and patient. The Zweig Breadth Thrust is on the verge of firing, but has not fired just yet based on Monday’s close. Remember, what we need to see is advancers totaling 61% or better within any 10-day period (ROC),presently just shy of that benchmark at 58 percent. (see chart below)
While there are some positive developments in market breadth and the overall technical picture, it comes with its fair share of faults. On Monday, the S&P 500 was up over 3%, but small caps, equal-weight, and high beta all under-performed, a negative sign of risk appetite.
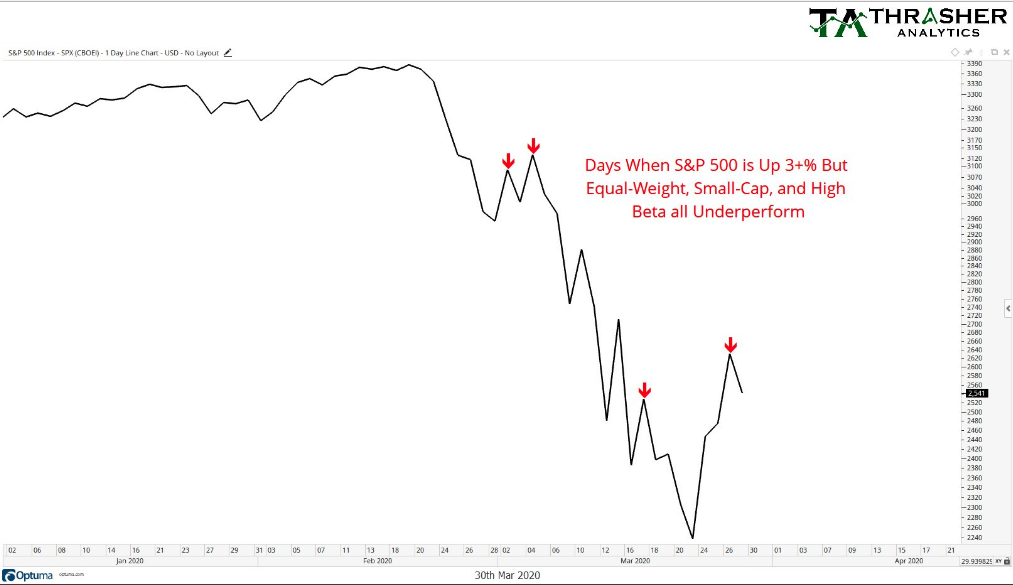
This has been normal on counter-trend bounces over the last month and unfortunately what highlighted the eventual trend lower, as shown in the chart above. Sometimes, even during rallies, we can identify the risk appetite based on what sectors of the market are underperforming and which are outperforming. Nonetheless, the difference this time around may be that the VIX is trending lower, versus trending higher. Monday marked the first day the VIX closed below 60% in the last 11 trading sessions.
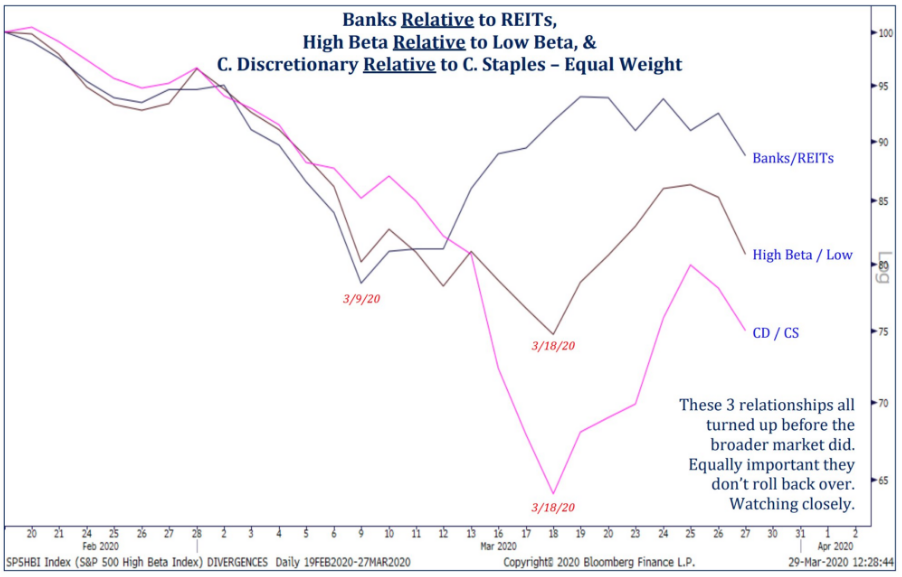
In the chart above from Strategas, we can see that value, high beta and consumer discretionary have been weaker than REITS, low beta and consumer staples, all of which tend to have better dividends and lower volatility. This is prototypical defensive positioning during a rather robust rally off of the former lows, signaling weaker risk appetite under the hood of the robust rally.
We’ve witnessed a strong market move since last week, and whether or not technical resistance can be further breached to the upside remains uncertain. It’s funny how when the market goes down sharply, so many folks seem to know exactly what will happen next. One of my favorite Warren Buffett anecdotes for those who assume they know exactly what will happen next during a big downturn is as follows:
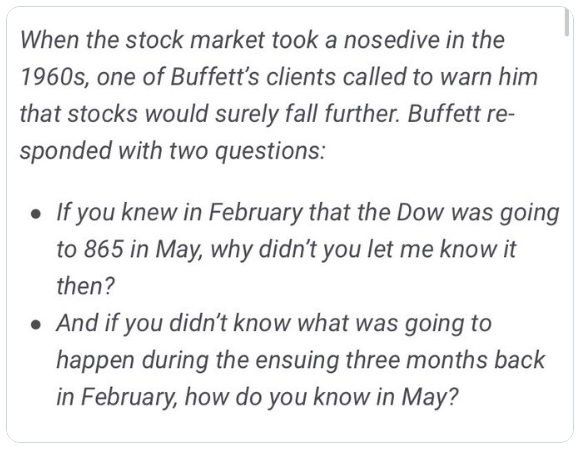
Nobody knows what’s going to happen next folks, least of all Warren Buffett. But Buffett doesn’t need to know what’s going to happen next, he only cares about the value representation of the day, as one thing has been proven historically: America will thrive long-term. As Ben Carlson recently wrote…
“Markets are driven by trends and psychology in the short-term so it’s possible stocks continue their downward trajectory. But the truth is no one knows how far these things will go or what expectations investors have already baked into current prices.
Markets feel more uncertain today than they have in some time. Just know that no investor has ever had complete clarity about the path markets will take over the short-to-intermediate-term. There are far too many variables at play to know what will happen with anything approaching certainty when it comes to market psychology.“
The current bear market is playing tricks on a lot of newer investors who haven’t lived through past crises. But that is why history always proves a useful guide or source of insights. As we have said at Finom Group, in order to realize maximum opportunity, know that bear markets always provide that maximum opportunity!
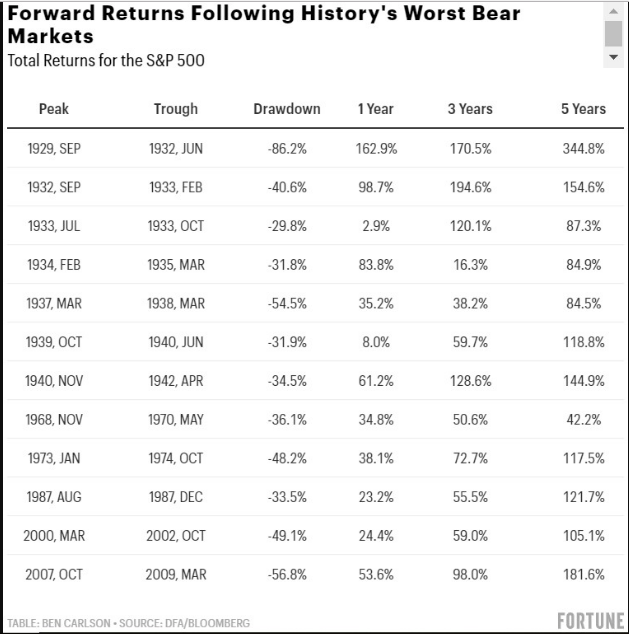
The table of past bear markets depicted above identifies the long-term opportunity, and why the near-term is less relevant. It also suggests that patience is rewarded long-term. Since 2008-2009 was the last bear market we have on record and thinking long-term, let’s take a look at what Warren Buffett was thinking and stating publicly back in 2008-2009.
In mid-October of 2008, Warren Buffett penned an op-ed for the New York Times entitled, “Buy American. I am.” At that point the S&P 500 was nearly 40% off its highs and in the midst of the worst financial crisis since the Great Depression.
Buffett stated:
“The financial world is a mess, both in the United States and abroad. Its problems, moreover, have been leaking into the general economy, and the leaks are now turning into a gusher. In the near term, unemployment will rise, business activity will falter and headlines will continue to be scary. So … I’ve been buying American stocks.
The reason for the worldly financial mess, likely rise in unemployment and faltering of business activity may be different this time, but long-term outcomes are likely to remain the same. After Buffett made the comments above, stocks would fall a further 30% or so from the day Buffett said he was buying stocks. Even the world’s greatest investor cannot nail the bottom in a falling market. We wouldn’t think you should be trying to either!


