
It was a rather volatile day for traders Tuesday, which “turned” out to live up to its “trade name”, Turn Around Tuesday. From Monday’s exuberance to Tuesday’s doldrums, implied volatility rolled lower despite the rather outsized level of intraday, realized volatility in the market as gauged by the total movement in the S&P 500 (SPX). The S&P 500 moved an average of 4.8% a day in March, the most for any month on record.
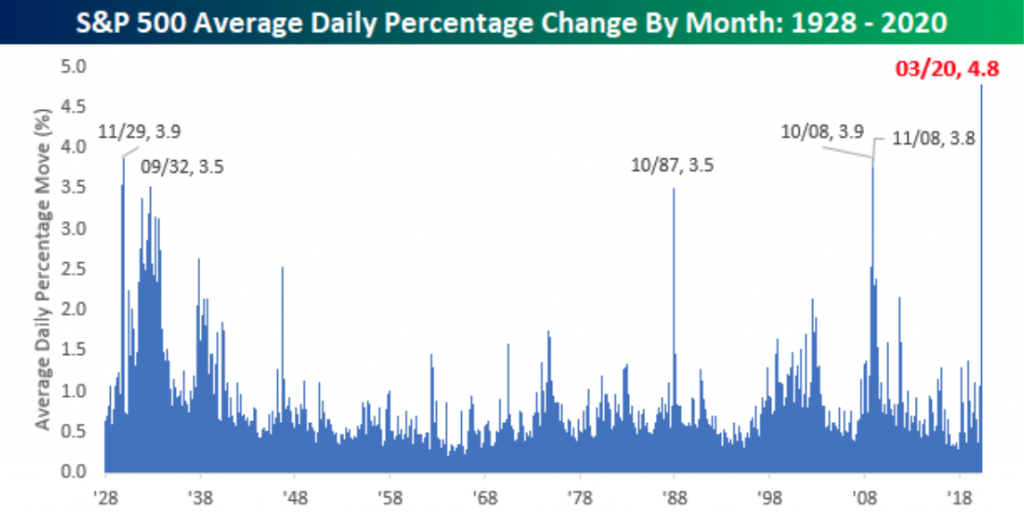
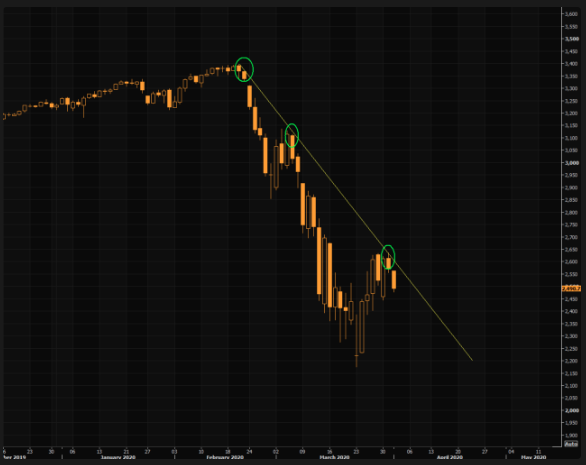
Even through the depths of the Depression or the Global Financial Crisis, the average monthly swing never surpassed 4 percent. As shown in the chart below, the S&P 500 failed to break through and close above upward resistance, which proved to be the 200-WMA at 2,637.
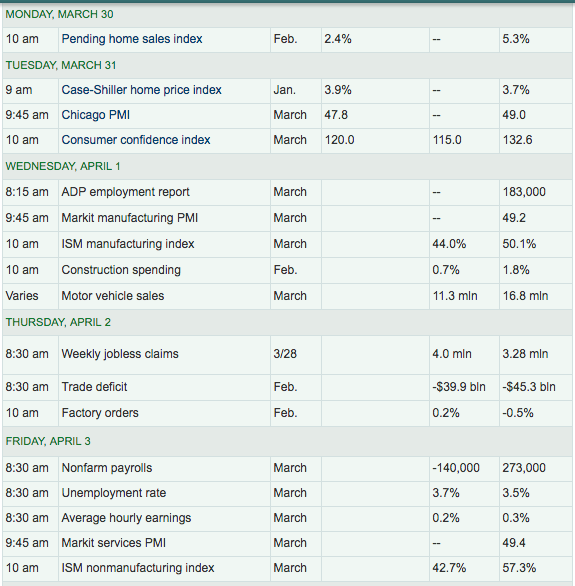
The S&P 500 gave up nearly half of Monday’s gains on Tuesday, falling just over 1.6% on the trading session, as investors prepared for a deluge of bad economic data on the jobs front. With the economy shuttered, investors, economists and analysts alike are looking toward the ADP private sector payroll and ISM Manufacturing index to roll out on Wednesday, with a rather poor depiction of the U.S. economy.
Fortunately, the Q1 2020 period has ended, and not quickly enough. The S&P 500 managed to fall each month during the quarter, something that has only been achieved 8% of the time throughout history. Additionally, when this happens, well, the statistical returns aren’t good for the calendar year.
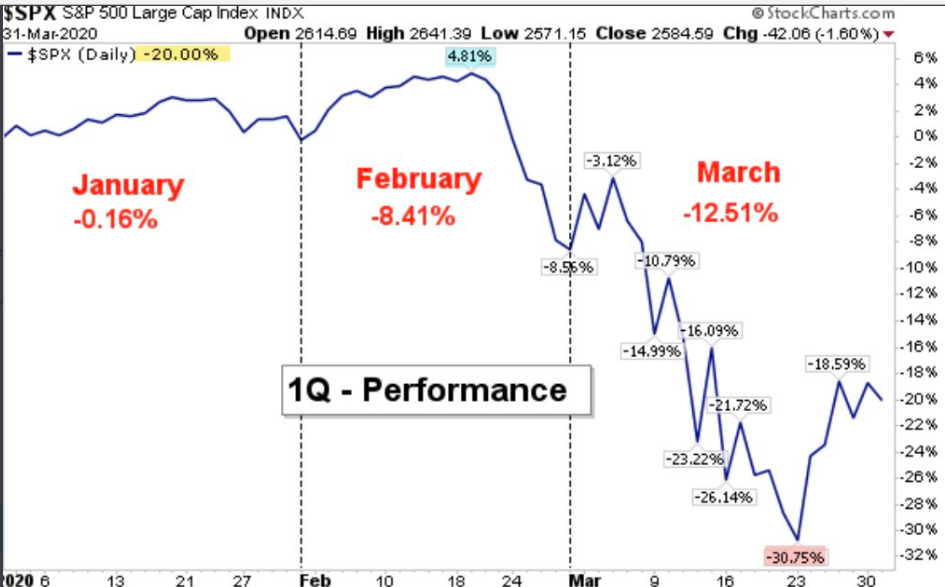
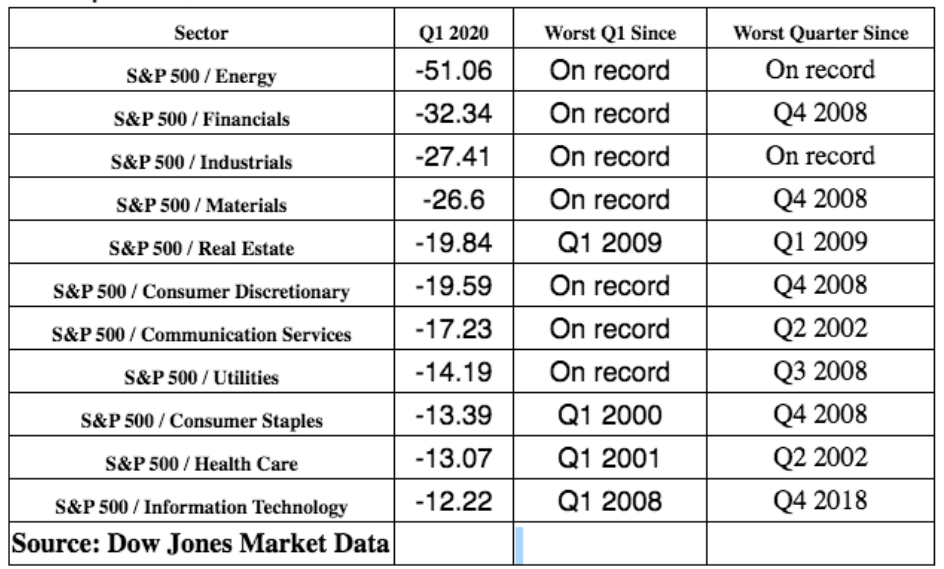
This year, proved to be the worst Q1 in history (-20%), eclipsing 2001’s decline of -12.11% by nearly 80 percent. If you proven to manage through this period in the markets, keep your wits about you, then you’ve accomplished a great deal in our opinion. But onto those statistics…
- The S&P has only fallen in January, then February and again in March in 8% of years since 1958 (first full year of data). It happened in 1973, 1974, 1977, 1982 and 2008.
- During the 5 years when the S&P was down in January, February and March, the S&P finished the year lower in every year except one, or 80% of the time and mostly by double digits. The average return from the close on the last day of March to the end of the year was -9.8%.
- On a total return basis, these years as a whole were also down 80% of the time or negative by an average of 12.7%: 1973 (-14.3%), 1974 (-25.9%), 1977 (-7.0%), 1982 (+20.4%) and 2008 (-36.6%).
According to DataTrek, given how unusual it is for every month in Q1 to finish lower in a given year, what are the odds for a down fourth consecutive month in April? Here are the stats:
- Out of the five years in which the S&P 500 was lower in all 3 months of Q1, only two also saw a down S&P 500 in April. They were in April 1973 and 1974.
- The S&P was not up in a given month until July of 1973 and October of 1974. On the latter year, keep in mind President Nixon resigned in August 1974. Also important: the oil shock caused by the Saudi embargo in Q3 1973.
It’s been a serious, sharp and damaging first 3 months of the calendar year. Some might say it’s overdone, but the unique circumstances lend any characterization about the time period and outlook as purely speculative. We’ve been through tough times, unique times in the past only to overcome.
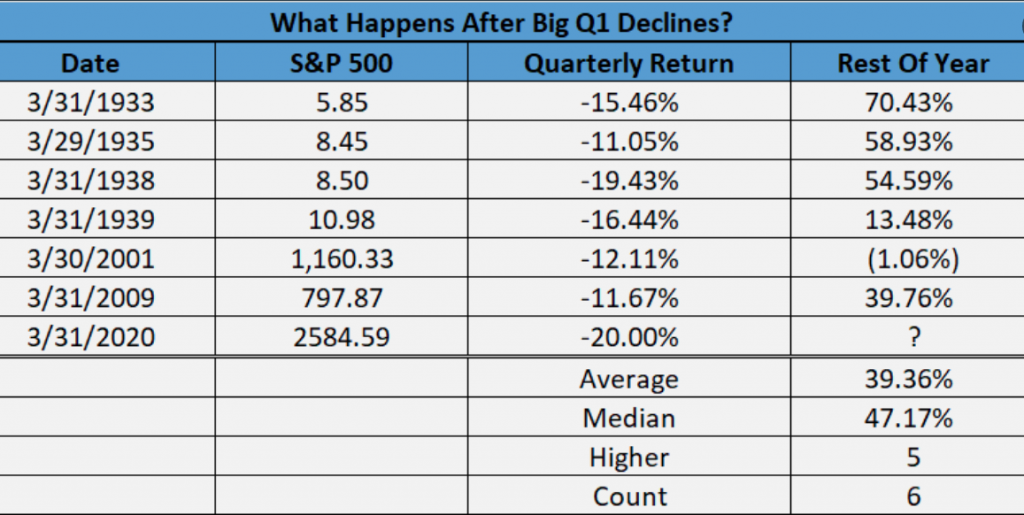
When things have become this bad in the market, sometimes we have to force ourselves to understand that it can only get better with the passage of time. Some fun and positive facts about the passage of time when the 1st quarter of the year is so dire: When the S&P 500 Index is down >10% in Q1, the rest of the year is up nearly 40% on average, according to LPL Financial’s Ryan Detrick.
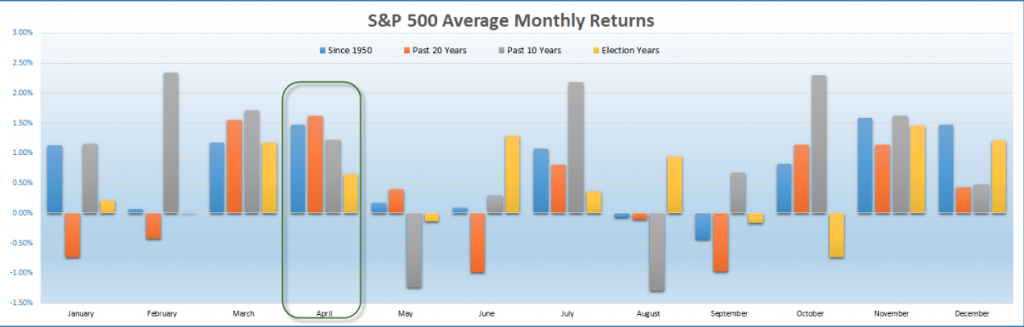
Some more good news for investors is that April IS typically the a good month of the year for returns, typically! Since 1950, April has been the second best month of the year for the S&P 500. The past 20 years it has been the absolute best. When March is lower? Higher 10 of the past 12 times also. When March was lower with a COVID-19 economy shuttered? We’ll know soon enough!
But in a year that starts off with the fastest bear market in history (16 days) and with a shuttered economy, nothing seemed to work for most investors as the worst Q1 period came to an end. Diversification didn’t really lend itself well to the average fund manager and/or investor.
What we’ve been encouraging our members at finomgroup.com to do during this period of high volatility and great uncertainty is to remain patient, discipline and raise cash through rebalancing. Here is what we offered to our members in this past weekend’s Research Report:
“In the week ahead, and I hate to say it, but investors will likely have an opportunity to gather their thoughts, review their disciplines and routines and refer to their bear market game plan once again. Most importantly will be the process of organizing one’s thoughts. Doesn’t seem so bad right, but here’s the catch! Finom Group is of the opinion that the rebound which we anticipated and forecasted for this past week will ultimately lend itself to a retest of the recent lows in the week/s ahead. Instead of watching every potential tick lower in the S&P 500, it will likely prove a greater advantage to organize thoughts and review game plans as part of our updated bear market disciplines.”
For most active portfolio managers and/or traders, patience is a difficult exercise, but prudent and proven profitable long-term. We understand through historic data that markets tend to bounce off of capitulatory lows, and within a bear market. As such, we’ve remained patient through this time period where daily COVID-19 infection rate data continues to highlight the issues in the U.S. and broader Europe. As the macro picture has weakened, with the market bouncing off its lows, this tends to validate the need to remain patient, disciplined and look for opportunities to rebalance. Speaking of “dead cat” bounces within a bear market…
According to Strategas Research Partners, during the 3-year bear market after the tech bubble burst in the early 2000s, the S&P 500 bounced more than 10% different 6 times on the way to falling 49.1%. During the financial crisis when the S&P 500 lost more than 56%, stocks bounced more than 10% three times, with a huge 27% rally in late 2008 eventually faltering. In other words, big bounces are quite normal, even during bear markets.
As shown in the chart below, there have been 9 bear markets that officially lost 20% since 1950, and the average maximum bear market bounce during those bear markets was 14.5 percent.

With the recent 20% bounce in the S&P 500, off of the lows, this is obviously a strong move, but not much different than what we’ve seen in the past. It’s uncertain as to whether or not the market will revisit the prior lows at 2,191, although Double Line Capital’s Jeffrey Gundlach believes April will be a difficult month for equities, as they head back to the former lows and beyond.
The so-called bond king compared the current stock rout to the ones in 1929, 2000 and 2007. He said during 1929 sell-off, the market “went sideways” for almost a year and then the economy worsened again.
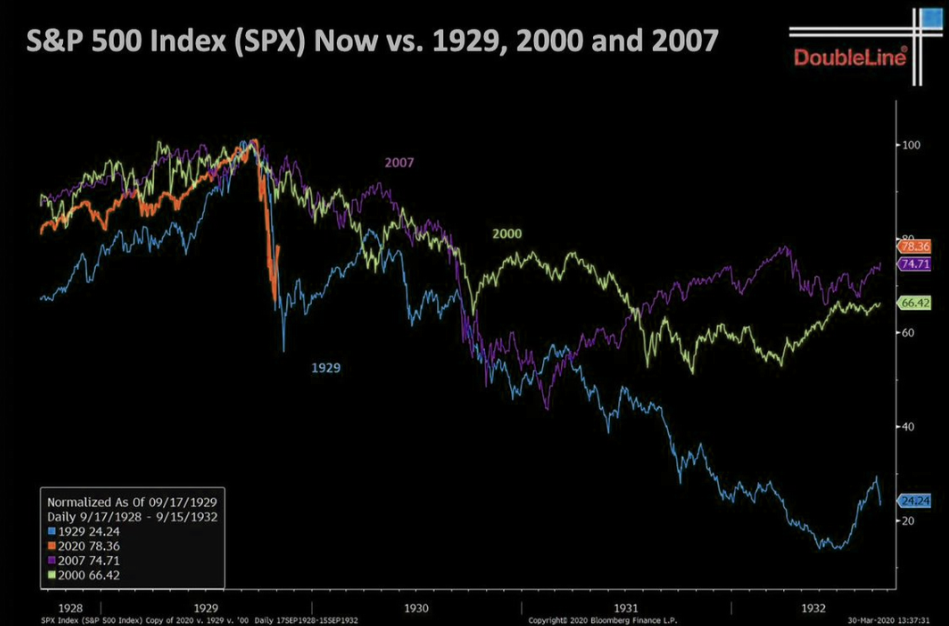
“The low we hit in the middle of March … I would bet that low will get taken out,” Gundlach said in an investor webcast on Tuesday. “The market has really made it back to a resistance zone and the market continues to act somewhat dysfunctionally in my opinion. … Take out the low of March and then we’ll get a more enduring low.”
To be clear, Gundlach’s statements shouldn’t be confused with “making a call”. Most market participants have been of the opinion that a retest of the former lows was inevitable. Many economists and strategist are also found with actual calls for the S&P 500 to travel as low as 2,000, most notably David Kostin of Goldman Sachs.
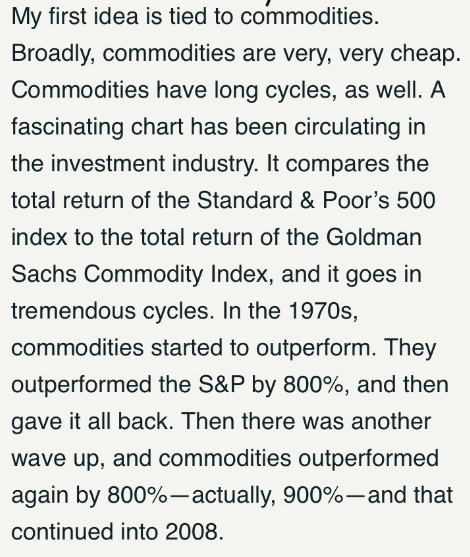
Moreover, Gundlach is a bond fund manager by and large. Tough business right? Which way do bond prices go over time and quite consistently; up! In truth, Gundlach is more of a capital gatherer than a capital manager. Many of his actual calls simply don’t pan out. We can recall his commodities call from early 2018 in a Barron’s article. (excerpt below)

Least we not forget Gundlach’s longstanding call since 2016 on the 10-year yield. The bond fund manager has been calling for the 10-year to hit 6% since 2015 and more recently doubled-down on this call in 2018. Going out on a limb here and suggesting we’re a bit further away since 2018 than ever. At Finom Group, we’ve been tracking the fund managers hyperbole, calls and characterizations of the future market outlook since 2017, not many ever come to fruition as most are not calls, they’re simply permabear rhetoric regurgitated in perpetuity. In short, just be careful on reading too much into these so-called equity market guru characterizations, especially when they come from bond fund managers.

Heading into the Wednesday trading session, the equity futures market is showing signs of stress, with the S&P 500 down nearly 3% in the 6:00 a.m. EST hour. Given the unique issues confronting the market and economy, many analysts and strategists have thrown in the proverbial towel with regards to price targets. Nobody knows with any degree of certainty exactly where the market is going; everybody has ideas and thoughts, but nobody knows.
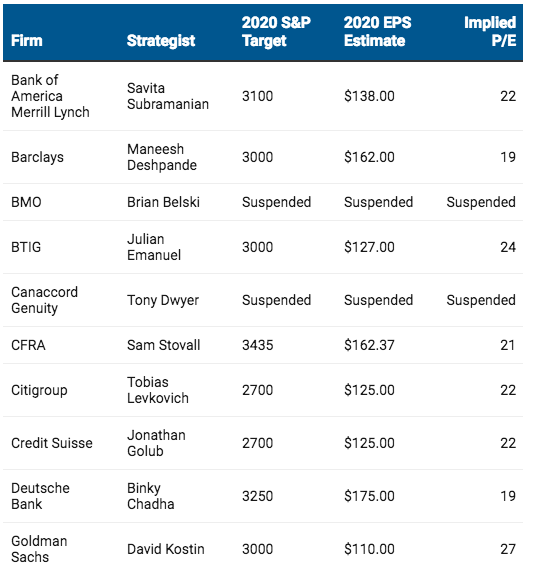
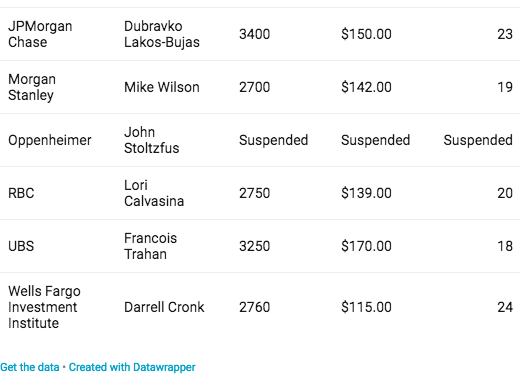
Over the past week or so, chief market strategists at BMO, Oppenheimer and Canaccord Genuity have all suspended their year-end targets on the S&P 500, blaming the unprecedented economic uncertainty that makes projecting the market a fool’s errand.
“For the first time in our collective careers, we have decided to suspend our year-end S&P 500 price and EPS targets in favor of rolling 12-month forecasts,” BMO’s Brian Belski and Nicholas Roccanova said in a note. “We believe there is minimal rational method for predicting the path of US stocks given the rapidity and volatility of data, forecasts, and emotions on a nearly daily basis.”
Tony Dwyer of Canaccord Genuity said it is “impossible” to gauge the economic impact of the health crisis until a peak in coronavirus cases. Oppenheimer’s John Stoltzfus said he will resume his forecast when the length of the “hard stop” of the U.S. economy can be determined.
Here are the current 2020 targets from top strategists, according to CNBC’s analysts’ price target tracker.
The biggest issue with maintaining an S&P 500 price target at this point is modeling the unknowns surrounding corporate profits, which are directly tied to how long the economy remains shuttered both domestically and through much of Europe. EPS estimates have been slashed during the month of March. Analysts now expect the S&P 500 to report a year-over-year decline in earnings in Q1 2020 (-5.2%), Q2 2020 (-10.0%), and Q3 2020 (-1.1%).
During the past week, the aggregate earnings growth rate for CY 2020 changed from slight year-over-year earnings growth on March 24 (+0.6%) to a slight year-over-year earnings decline on March 25 (less than -0.1%).
Expectations for earnings growth for CY 2020 have been falling over the past few months. On September 30, 2019, the estimated earnings growth rate for CY 2020 was 10.4 percent. By December 31, the estimated earnings growth rate had fallen to 9.2 percent. Today, the estimated earnings decline is -1.2%, given the “grey swan” event.
Insight/2020/03.2020/03.30.2020_TOW2/S&P%20500%20Earnings%20Growth%20Rate%20CY%202020.png?width=912&name=S&P%20500%20Earnings%20Growth%20Rate%20CY%202020.png)
Five of the 11 sectors are now projected to report a year-over-year decrease in earnings for CY 2020: Energy (-62.3%), Industrials (-10.2%), Consumer Discretionary (-8.0%), Materials (-3.5%), and Financials (-2.2%).
Insight/2020/03.2020/03.30.2020_TOW2/S&P%20500%20Earnings%20Growth%20CY%202020.png?width=912&name=S&P%20500%20Earnings%20Growth%20CY%202020.png)
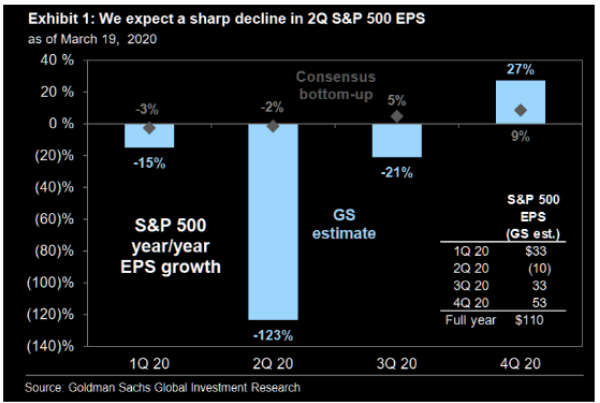
Famed analysts and strategist Ed Yardeni, has a more ominous outlook for S&P 500 earnings in 2020. As he sees it, S&P 500 operating earnings per share will have negative growth rates during Q1, Q2, and Q3 of this year before turning positive next year. We are projecting the following quarterly y/y growth rates for this year: Q1 (-23.4%), Q2 (-51.6), Q3 (-28.8), and Q4 (-4.8). But if you thought Ed Yardeni’s quarterly and FY2020 earnings outlook was dire, Goldman’s Q2 outlook for EPS growth is the most dire.
I think it’s safe to say that analysts are throwing their best guesstimates at a variety of unknowns to surmise EPS forecasts, but nobody knows and everybody is simply doing “work”. The worst thing you can do as an investor/trader, is seek out those individuals, analysts, market participants who share your bias. Bias confirmation is a terrible commonplace amongst investors. The way confirmation bias works is that we seek out information that agrees with our views of the world, or we just interpret all new information as being supportive of these views.
As we await the ADP payroll and ISM Manufacturing data Wednesday, the selling pressure resumes anew and post a remarkable bounce off the recent lows. Technicals worsened on Tuesday and after showing signs of a promising Zweig Breadth Thrust forming, which like the economy has since been shuttered. The S&P 500 Index l continues to show resistance at the declining 20-DMA and 200-WMA.

Now, it remains to be seen if the benchmark index can hold up above the December 2018 lows of 2,346. The economic data, which focuses on labor and employment, are likely to solidify the downward pressure near-term as a strong economy with growing corporate profits demands jobs! We are of the opinion that Tuesday’s market action was a result of the culmination of EOM and EOQ rebalancing coupled with risk-off activity ahead of key jobs data through the end of the week. The market is a discounting, forward-looking mechanism after all.
As we said at the onset of our weekly Research Report and with reflection over the current whipsawing markets:
“Bear markets are never easy; they are not supposed to be fun, but rather arduous and taxing on emotions, especially if you’re not prepared and overly indulge in headlines. These market conditions beg of resolve and a strong constitution in order to recognize and benefit from what all bear markets eventually produce… maximum opportunity! But in order to prepare for “deliverance”, if you will, one must maintain their resolve and strong disciplines. Remember, it is never easy and if it were then we wouldn’t be having this conversation or broaching the subject matter of the day.“
In closing we want investors to consider a couple of key variables in order to achieve the maximum opportunity developed through bear markets and delivered thereafter. We know bear markets find fewer market participants thereafter, and when a new bull market has begun. Hopefully you can avoid the damage of the day by weathering the storm, because all storms pass and bring with them new light. With that being said, the following data concerning bear markets shows the light/sun that shines after the storm and why the storm may prove to be passing presently.
The chart shows the results of our study on bear markets and recessions over the last 50 years:
- In six of the last eight periods, a recession followed a bear market by about 12 months or less.
- During periods when recessions overlapped bear markets, much of the S&P 500 Index decline was absorbed by the bear market preceding the recession.
- Although the potential for a deep recession in 2020 may drive further market deterioration, the S&P 500 Index actually showed positive returns twice during the recessionary phase.
What it may mean for investors
While no two bear markets are the same, research shows that market bottoming during a bear market is a process that can take some time. We would caution investors against using recessions as an indicator for exiting the stock market.
This chart was excerpted from Market Charts: Turning Data into Knowledge (second quarter)

We may have already seen the vast majority of the markets decline ahead of the labeled recession. The market has already achieved a 34% decline from its former highs during the Q1 2020 period. It has largely priced in a recession and is likely to consolidate over the coming weeks and/or months before the bottoming process is complete and a breakout is found.
In addition to “sticking with the market” insiders understand the natural order of bear markets and recessions. Insiders went on the 2nd largest buying spree in two decades, last quarter, bigger than March’09, Aug’11 and December 2018.
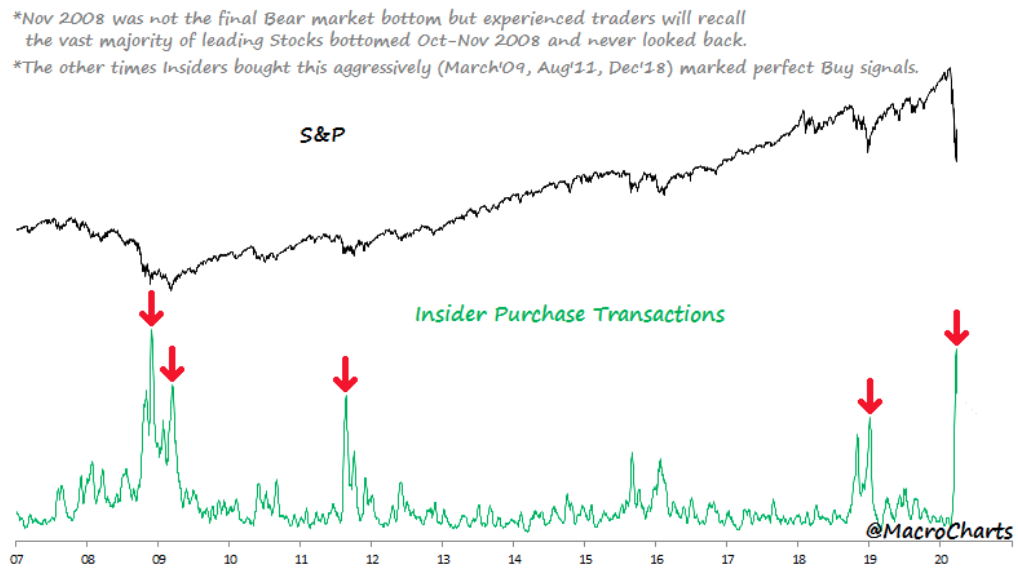
This is not to suggest the insiders know more than you or I, but they are the deemed smart money.


