Going into Tuesday’s trading session, the S&P 500 had some momentum to continue its run at the 2,998 level, representing the benchmark indexes 200-DMA. Achieving this level with some 85% of stocks trading above their 50-DMA would likely herald a new bull market and certify the bottom of the bear market was made on March 23rd.
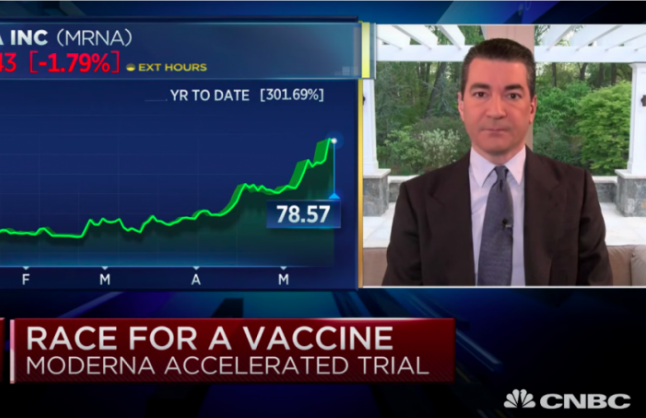
The S&P 500 was going for it’s 4th straight gain Tuesday, which hasn’t happened since the first four sessions of February. Unfortunately, despite an uneven performing session through much of the day and finding the highs of the day in the 2:00 p.m. EST hour, around 2:50 p.m. headlines surfaced that cast doubt over the former Moderna vaccine disseminations from the company and analysts alike. Those headlines came from the STAT News and basically suggested that Moderna said, “much to do about nothing” and didn’t actually publish any results that could be discerned or validated.

“Several vaccine experts asked by STAT concluded that, based on the information made available by the Cambridge, Mass.-based company, there’s really no way to know how impressive — or not — the vaccine may be.
While Moderna blitzed the media, it revealed very little information — and most of what it did disclose were words, not data. That’s important: If you ask scientists to read a journal article, they will scour data tables, not corporate statements. With science, numbers speak much louder than words.”
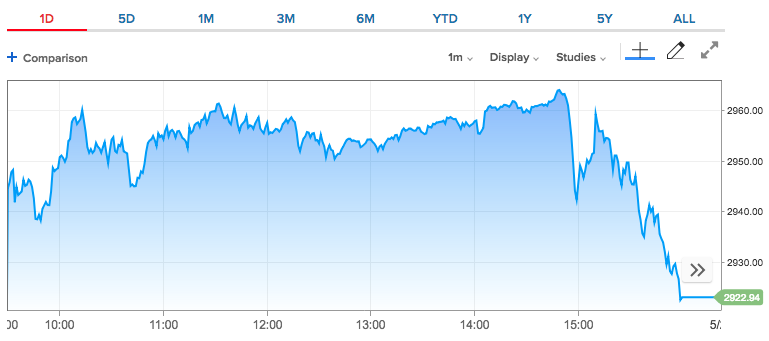
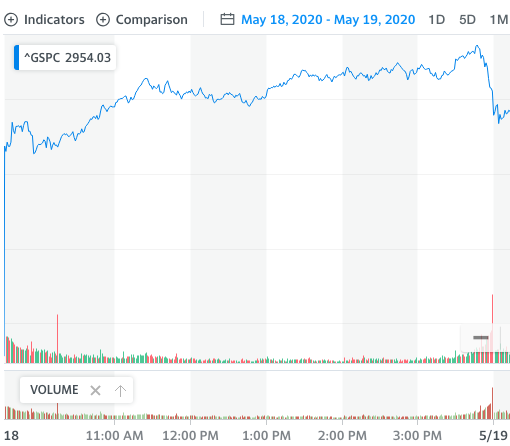
Minutes after STAT News released their critique of Moderna’s disseminations and previous headline on Monday, the major averages sold off into the closing bell. The momentum that the S&P 500 had been building over the previous 3 trading sessions now comes into question on Wednesday and ahead of the Thursday’s jobless claims data. (S&P 500 1-day chart)
In my opinion, the STAT News narrative, did nothing but plague on equity market algorithms with a timely piece. I can understand the skepticism aimed at the Moderna disseminations from phase 1 trials, but it would seem as though the scrutiny comes after a daily dose of positive, confirming optimism over the company’s findings. Some of the most reputable infectious disease experts were found and finally with a sense of optimism given what Moderna offered in a live CNBC interview.
Scott Gottlieb, former Food and Drug Administration commissioner, in an interview on CNBC Tuesday agreed this was a “positive development,” since it suggests the vaccine “can produce an immune response.” He noted, though, that since Moderna only tested the first eight patients of 45 for neutralizing antibodies, “we need to know the data on the other patients, and whether in fact those are neutralizing antibodies, the kinds of antibodies that target the virus and destroy the virus.“
“They need to figure out what the right dose is for this vaccine, so they’re going to need to do a lot of phase two work before they can get into a phase three trial to determine the optimal dose,” Gottlieb said. “We also have to make sure that these vaccines are producing neutralizing antibodies.”
Undoubtedly, a phase1 trial is going to demand questions; it’s phase 1 after all and an ongoing trial. Nonetheless, that which has been completed and with some degree was announced, if not for the sake of results to come in the future. This is basically what Moderna highlighted and nothing more. To the extent the Moderna headlines demanded a rebuttal seems a bit sensationalistic, even as reputable, highly regarded Wall Street analysts also suggested a more optimistic sentiment regarding Moderna’s findings.
Morgan Stanley’s top biotech/pharma analyst Matthew Harrison said in a note that he sees safety as the biggest hurdle for these expedited programs. The top rated analyst also offered the following in a note to clients Monday:
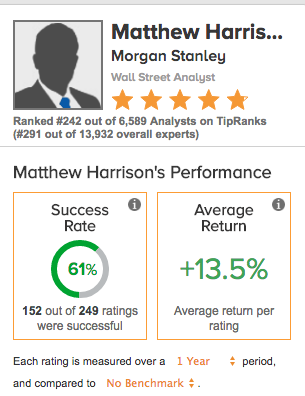
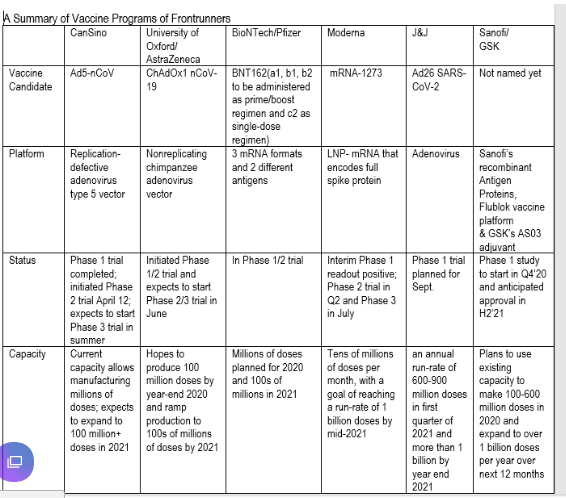
“Millions of doses of the vaccine could be available by fall 2020, and over 1 billion in 2021. Six candidates — four clinical pipeline candidates and two preclinical candidates — have a reasonable likelihood of success and can be manufactured at a notable scale, Harrison said.”
The analyst projects three waves of commercially available vaccines. The candidates, sponsors and the timelines are as follows:
By The End Of 2020
- Moderna
- Pfizer Inc. (NYSE: PFE)/BioNTech SE – ADR (NASDAQ: BNTX)
- AstraZeneca plc (NYSE: AZN)/University of Oxford
- CanSino
I’m all for careful scrutiny and analysis for headlines and newsworthy events, but man-alive this was quite the timely headline found for little utility. IT’S AN ONGOING PHASE 1 TRIAL!! All the answers, all the data and next steps won’t be known until the trial concludes. And after the chaos-induced algorithms fired and found the S&P 500 down some 1% on the day, I would think cooler heads prevail and investors are better able to rationalize the 2-day series of mixed headline sentiment. This may find the benchmark index recapturing momentum.
Monday was quite the day, and I wouldn’t be of the opinion that all the markets’ move on Monday was Moderna-driven. Remember, the Dow futures were already up some 250 points before Moderna’s announcement and CEO interview. In looking a bit deeper into Monday’s market action, here is something that we also found that suggested the upward persistence on Monday was less about buying and more about short-covering activity.
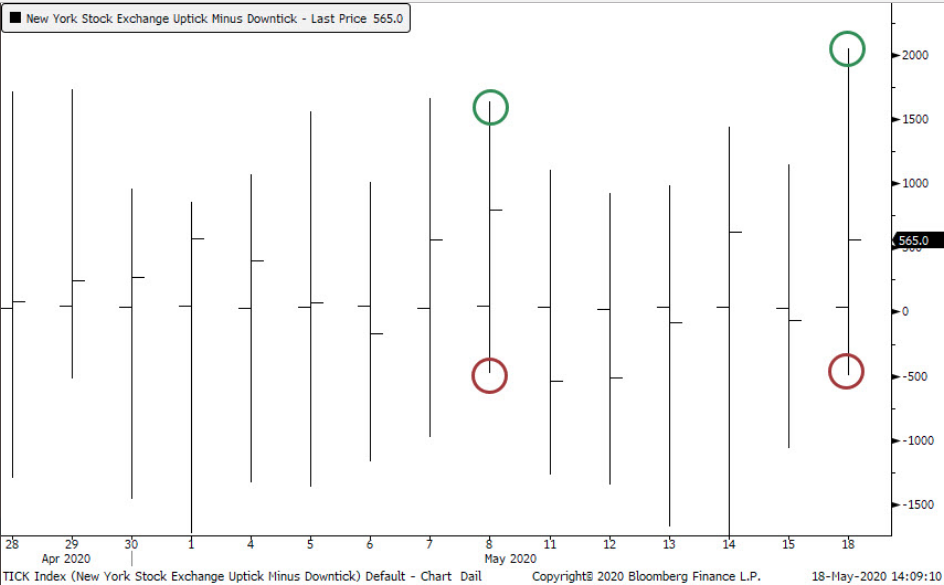
The TICK index compares the number of stocks that are rising to the number of stocks that are falling on the New York Stock Exchange (NYSE). The index measures stocks making an uptick and subtracts stocks making a downtick. For example, there are roughly 2,800 stocks listed on the NYSE. If 1,800 stocks have made an uptick and 1,000 stocks have made a downtick, the tick index would equal +800 (1,800 – 1,000)
Example of the Tick Index Monday
BREAKING DOWN Tick Index
The tick index is a popular indicator used by day traders to view the overall market sentiment at a given point in time. Seeing the ratio of “up” stocks to “down” stocks allows traders to make quick trading decisions that are dependent upon market movement. Typically, readings of +1,000 and -1,000 are considered extremes; traders should be mindful of overbought and oversold conditions at these levels.
- Traders should remember that the tick index is a very speculative identifier of market sentiment at a specific point in time and is considered unreliable for traders who use longer-term strategies.
The TICK index finished the day at 565 on Monday, this is a very high reading, but not extreme. On a day where the market was staged to head higher and then a headline of consequence is announced that proves bullish, the TICK index and consistent uptrend likely forced bearish bets on the S&P 500 or SPY to cover as sellers were absent the market. Even without the TICK index, which denotes constant upticks on Monday, I can also suggest this to be the bulk of Monday’s market activity given the final 10 minutes of trading, which found the S&P 500 falling into the close, shedding a good 9-10 points.
Essentially, with only a few minutes left, short covering had concluded, and per usual, limited buyers where in the market. The shorts, throughout this relief rally have actually been a good deal of fuel for the extended and extention of the rally. Shorts had upped their bets this past week, heading into Monday’s market trading session, if you recall…
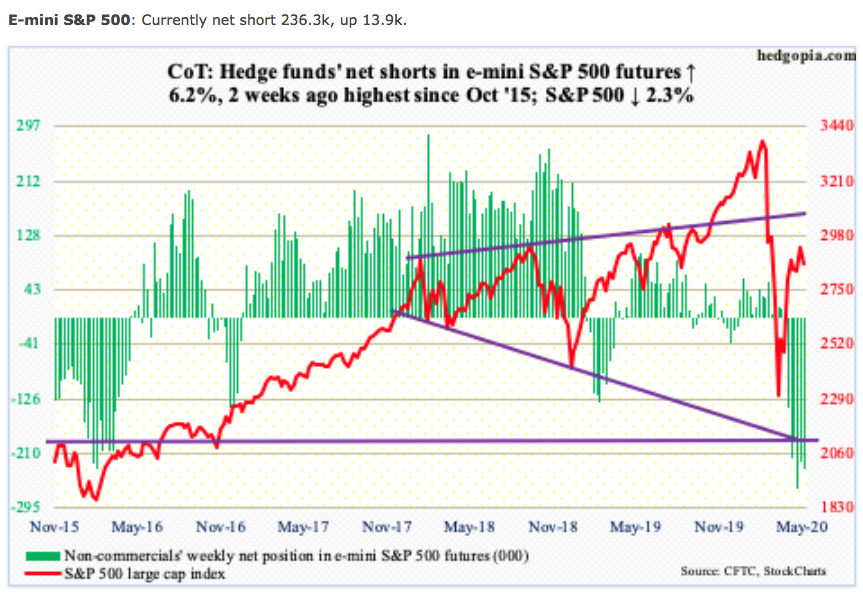
Given a better understanding of Monday’s market participation likely lacking for buyers and found more for short covering, Tuesday the S&P 500 spent a majority of the day around the flatline. Additionally, with the TICK index data at-hand, what we aim to determine is what comes next. Unfortunately, usually the near-term, forward returns are less than optimistic. The data below from SentimenTrader suggest forward returns with like TICK index readings don’t bode well for investors.
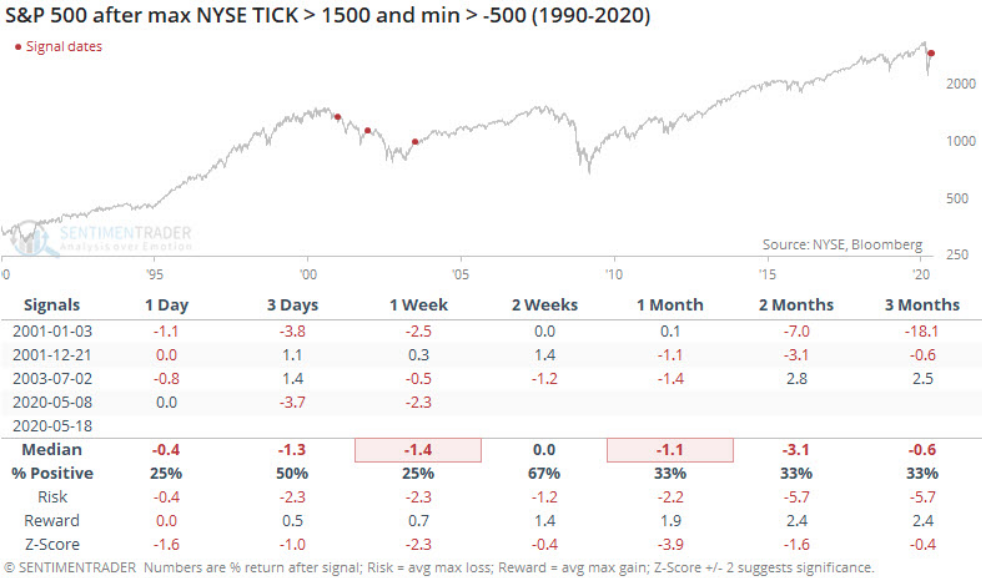
Across most timelines going out 3 months, negative returns are to be expected. The max drawdown, however, is roughly 3% out 2 months. Simply put, if this should hold true to trending historic data, it would find the S&P 500 still within the current sideways trading range that has persisted for the last 5 weeks. But, there is always a but.
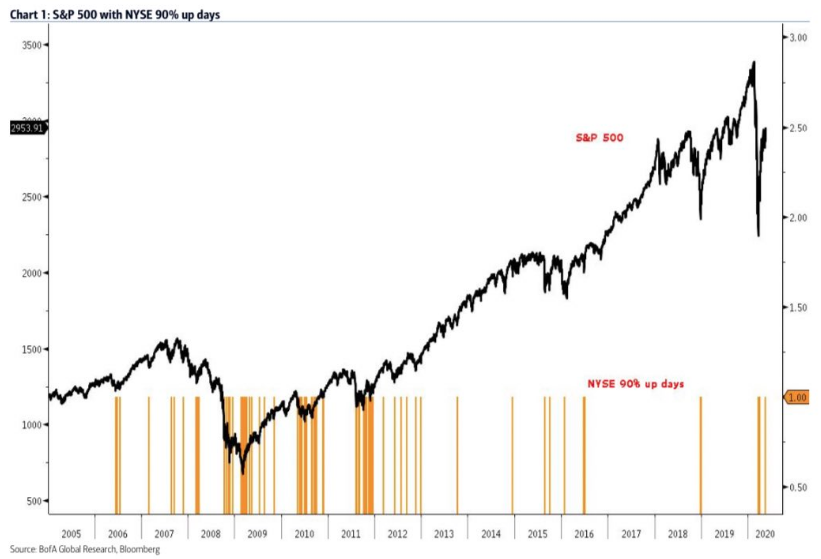
What the statistical data from SentimenTrader doesn’t include is whether or not the NYSE had a 90% up day; at best it assumes it to be so. According to B of A: “ Monday (5/18) marks the third 90% up day since the 3/23 low. Forward S&P 500 returns after an NYSE 90% up day start off negative one to five days out, to test the resolve of the bulls, and then shift positive. After 20 days, it’s “up 80% of the time.”
Remember folks, not all studies are created equally and not all studies contain all the necessary inputs/criteria to make a guarantee of sorts. Nonetheless, here we are, with still yet an S&P 500 that has come a long way in a very brief period of time. Such a move off of the March 23rd lows, in and of itself, breeds contempt. Today marks the 41st trading day since the S&P 500’s March 23 low. It’s up 32% since that date.
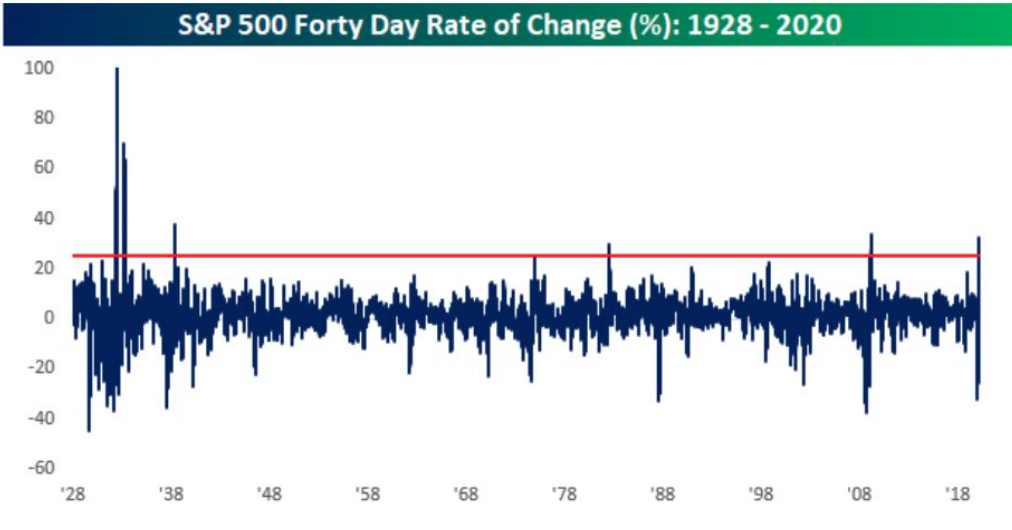
Rallies of this magnitude, in such a short span of time, have rarely been recorded and are identified in the chart above from Bespoke Investment Group. And with the economy having been shut down during this time period, a self-induced recession taking place and understood devastation to U.S. and multinational company earnings/sales, valuation concerns have naturally dove-tailed the S&P 500’s rise from the bottom. That was a mouthful! But keep in mind that much of the stabilization of valuations has come on the heels of the belief that fiscal and monetary policies act as a buffer and bridge to future resumption of economic and corporate earnings growth.
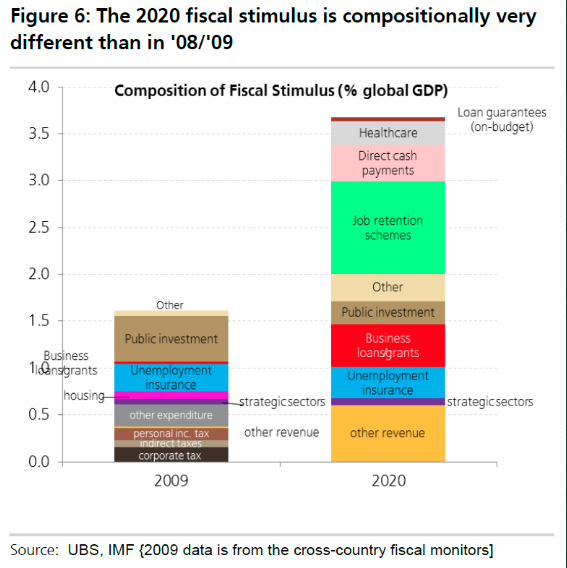
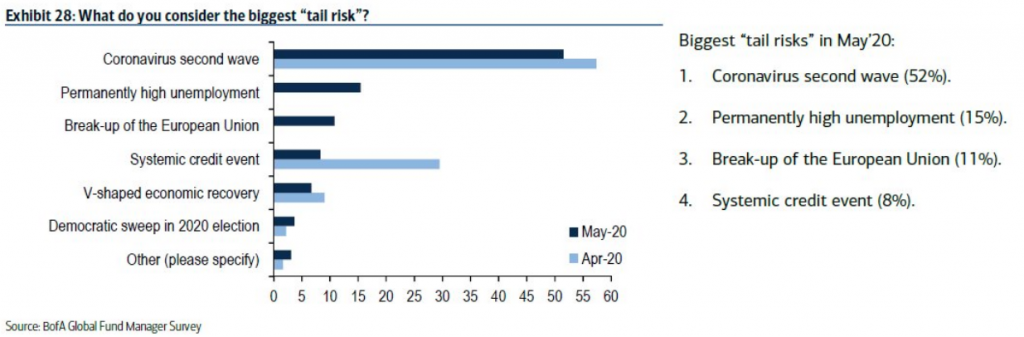
The composition of global fiscal stimulus in the corona crisis of 2020 vs. the financial crisis of 2008/2009 now amounts to 3.7% of world GDP. Fiscal stimulus is roughly 4X larger than it was in 2008/2009 and it comes alongside monetary policy implementation that has seemingly and successfully stifled a credit crisis. Expectations for a systemic credit event have collapsed from 30% to just 8% in BAML’s latest survey of global fund managers.
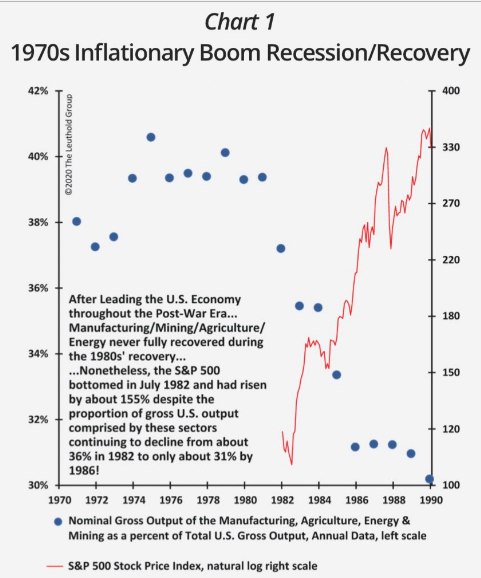
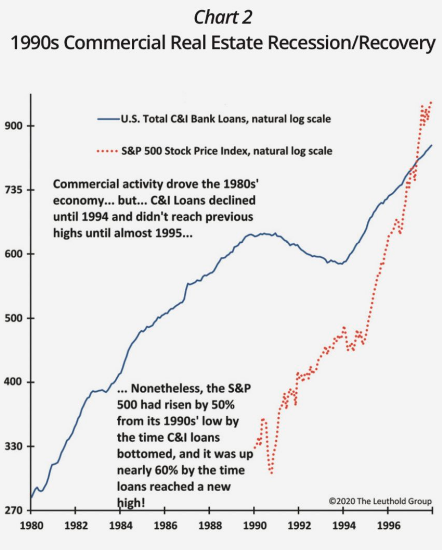
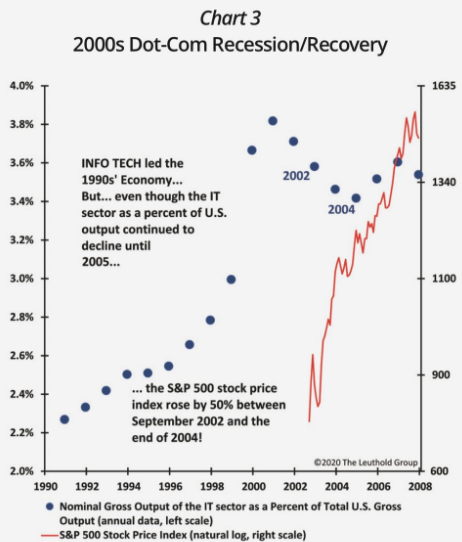
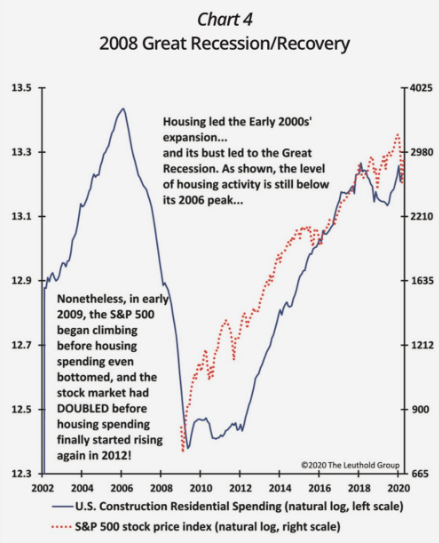
Moreover, while the market punditry finds equity market valuations absurd, given the state of the economy, this is actually how history suggests the market should be performing. The last four major crises/recessions show that stocks embark on a new bull run long before each crisis ends.” Investors “should be prepared to survive a bear market which could possibly still get worse, but invest for a bull market which has probably already begun”, according to the Leuthold Group. (See charts below of past recessions/markets)
The main difference between today and past recessions is the concentration of market cap and earnings. Tech, Health Care & Financials comprise 60% of S&P 500’s forward 12m earnings. And despite Energy’s recent strong outperformance, its sector weight is mere 0.5% of profits, as it’s facing EPS contraction of 83 percent.
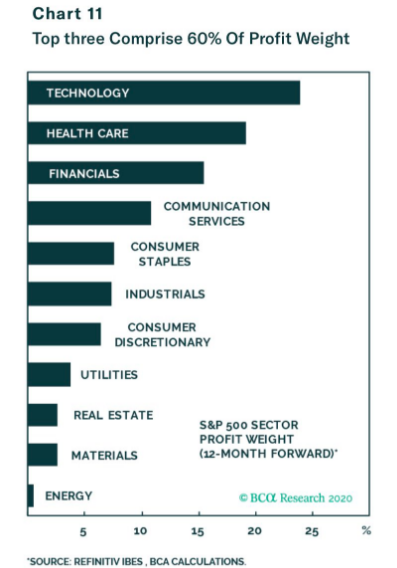
To make another point regarding the earnings concentration, we would anticipate Communication Services to increase its earnings potential in the coming quarters and years, eventually usurping Financials. So despite all the economic uncertainty that surrounds the reopening phase, it is understandable as to why the S&P 500 P/E is where it is, if we only look at fiscal/monetary policy and earnings concentration.
It’s no secret that Technology is driving the market as it maintains the highest concentration of earnings/growth and likely will continue to hold growth going forward. Nancy Lazaar of Cornerstone Macro recently offered the following message to clients and market participants, with regards to the tech-centric cycle ahead:
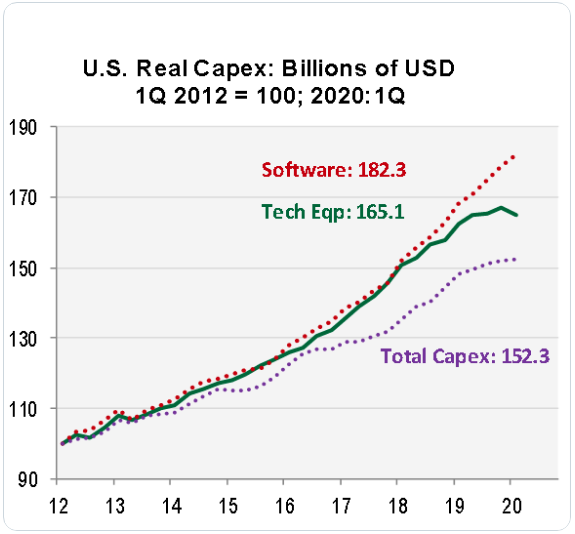
“Consumption won’t drive the next expansion, investment will. Consumers will keep their saving rate over 10%. Today’s investors have never seen capex drive growth, but it did so after WWII. Embrace it.“
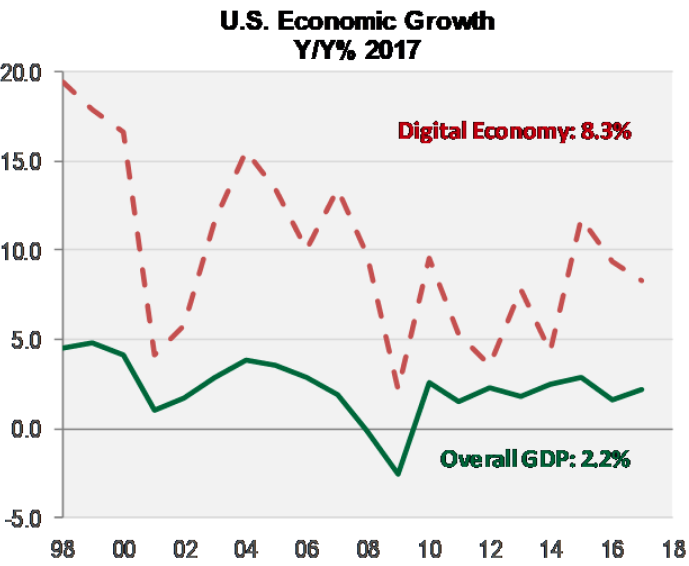
“Tech isn’t just driving stocks – it’s driving the economy. The BEA-defined Digital Economy grew much faster than the overall economy during the last expansion. It will do so again during the post-outbreak recovery.”
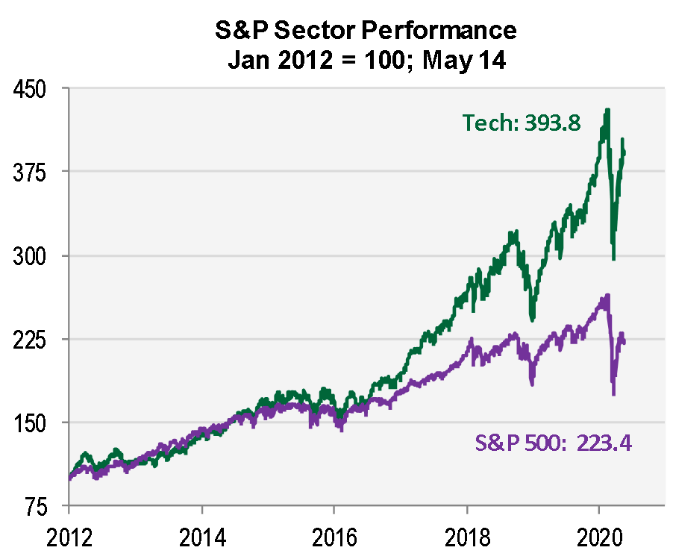
“Tech will drive the investment-led recovery, with software booming. Did you know software is capex in the GDP accounts? Tech spend boosts productivity, lifting potential GDP and profits, broadening the job market.”
Based on everything outlined by Nancy Lazaar and what we know has been bubbling-up underneath the surface of the economy since the last recession, I can safely suggest that the economy is ever-changing and the pandemic has simply accelerated the Information Technology era driven earnings cycle. But is this enough to sway the valuation concerns at the forefront of many investors? It is likely not going to prove enough for the ardent investor.
While the FAANG drumbeat of permabear market hatred carries forward, it’s also relevant to note that every cycle has a trendy investment theme. In the 60’s it was all about the Nifty Fifty, then gold in the inflationary 70s, Japanese stocks in the 80s, tech in the 90s, oil in the 00s, and of course FAANG today. (Chart via Alpine Macro)

The FAANG constituency continues to dominate and concentrate earnings growth atop the S&P 500 and Nasdaq. But valuation determination signals go beyond just earnings concentration. I’ve talked about the equity risk premium many a time in the past, but in my opinion it proves highly relevant. Not everyone is in agreement with me and I can appreciate varying opinions. BofAML points out that if you normalize ERP then stocks are pretty much dead in the middle of the ERP range they’ve been in all decade. BofAML goes on to point out that “On a statistical basis, the 20.4x S&P 500 forward P/E puts the market over 1.5x standard deviations above the average of 15.4x, and three-quarters of the way to the Tech bubble high of 25x.”

While I can appreciate the context offered by BofAML, investors don’t normalize the ERP over time, they invest today for the future, especially pension funds. In real-time, pension funds must assess the ability to achieve their target return goals and what the best way of doing so would determine. The determination is extremely clear, pension funds are forced to rebalance the fund in favor of where the greatest yield would be found over the next 1,3 and 5 year periods… equity markets.
The reality is that investors consider where they can find the greatest yield. It’s no different than a visit to the bank and asking what the highest yielding savings or money market account offers. Investors are doing the same thing in real-time. As such, the risk free premium offered by the 10-year yield STILL, despite decade high multiples, finds the S&P 500 UNDERVALUED!
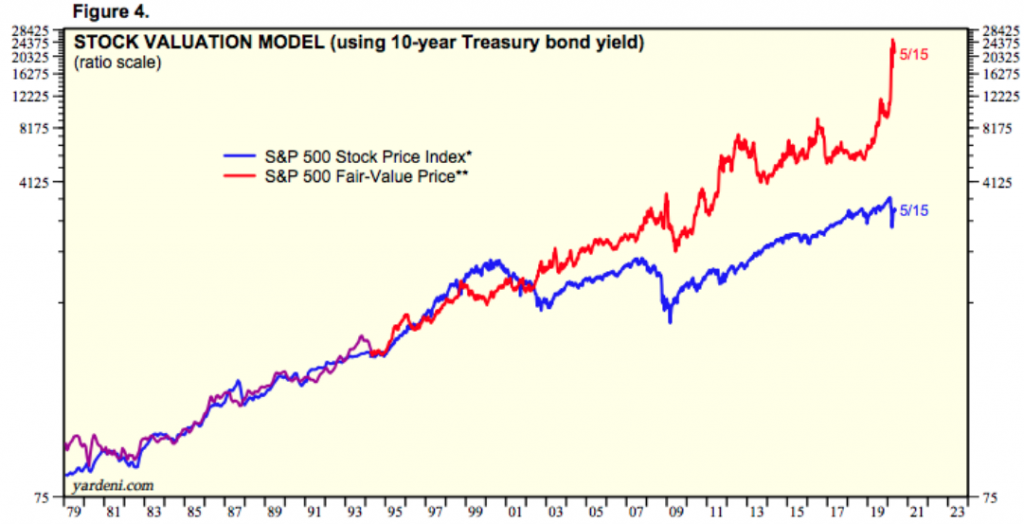
I’m not saying you have to like the facts or opinions given the present uncertainty surrounding the future outlook for the economy, but history is fact-based and begs of investor consideration. Price is truth and truth be told. Moreover, the present attractiveness of bonds vs. equities can also be viewed through a historic lens and also points more favorably towards equity outperformance, as offered by Ben Carlson below:
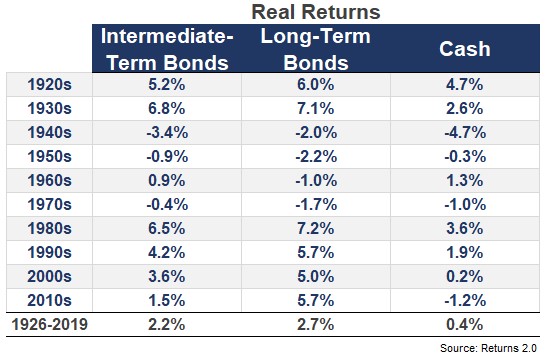
“When you compare today’s yields with annual returns of the past, things look pretty bleak today across the various maturities. I looked at annual U.S. government bond returns going back to 1926 for intermediate-term (5 year treasuries), long-term (20-30 year treasuries) and short-term (one-month t-bills) maturities:
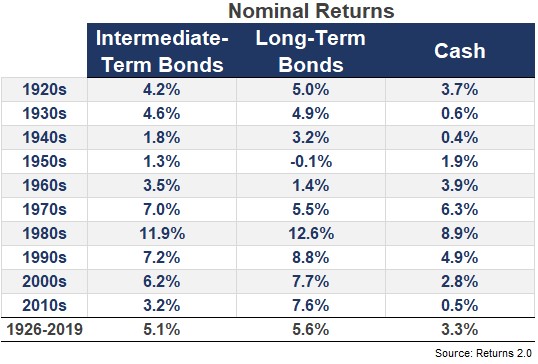
“The biggest risk to fixed income investors is inflation, not rising interest rates like many people assume. And low real bond returns have been low and even negative for entire decades in the past: