
Global equity markets soared on Monday as headlines surrounding Moderna’s phase-1 trial results for a COVID-19 vaccine proved promising. J.P. Morgan’s Biotech analysts offered there reaction and analysis to clients in a note on Monday as follows:

Quick Takes from the Conference Call:
- The neutralizing titers seen from the Phase 1 results were consistent with levels that were protective in mouse challenge models. Evaluation in other animal models are currently ongoing or planned.
- On safety, the grade 3 cases of systemic adverse events reported at the highest dose of 250ug included fever, muscle pains, headache, and fatigue. These were all transient (went away the next day with no necessary intervention), and the company is not concerned or surprised by these AEs.
- The Phase 3 trial is on track to initiate in July. Although the go forward dose has not been selected, it is expected to be in the range of 25-100ug.
- Mgmt sees the biggest risk to the Phase 3 trial as choosing sites and enrolling enough patients so that you get enough cases in the placebo arm to demonstrate a stat sig effect (and plans to enroll people at risk of COVID-19).
- The Phase 2 study will no longer include the 250ug dose level and will instead include a 50ug and 100ug dose. The trial plans to enroll the same number of patients (N=600 split into 2 age cohorts, 18-55 and 55+).
- Details from the Phase 1 Update. Recall the mRNA-1273 Phase 1 study enrolled patients at 3 dose levels (25, 100, 250ug; N=15 each) that were vaccinated with 2 doses at 1 month intervals. Patients at all 3 dose levels seroconverted by day 15 after a single dose. Antibody levels in line or higher than convalescent sera samples where seen in patients 2 weeks after the second dose in the 25ug dose (N=15) and the 100ug dose (N=10), respectively. Neutralizing antibodies (available for 4 patients each at the 25 and 100ug doses) were seen in all 8 of the patients tested. Initial results indicated that mRNA-1273 was generally safe and well tolerated.
The markets were already pointed higher going into the opening of trading on Monday, however, the Moderna headlines quickened the pace of gains and found equities climbing throughout the trading session. The S&P 500, which fell by 2.26% in the previous week, recouped all of its losses to finish higher Monday by 3.15 percent. But it wasn’t just the surge in the major averages that proved bullish, resulting from the biotechnology headlines, it was the strength of the move higher. What had been working for the markets, like technology, healthcare, consumer staples still worked, but what hadn’t been working in the market also worked Monday that much more. The easiest way to see the strength of the market’s breadth on Monday was by way of the Equal-Weight S&P 500 ETF (RSP) when compared to the Cap-Weight S&P 500 ETF (SPY).
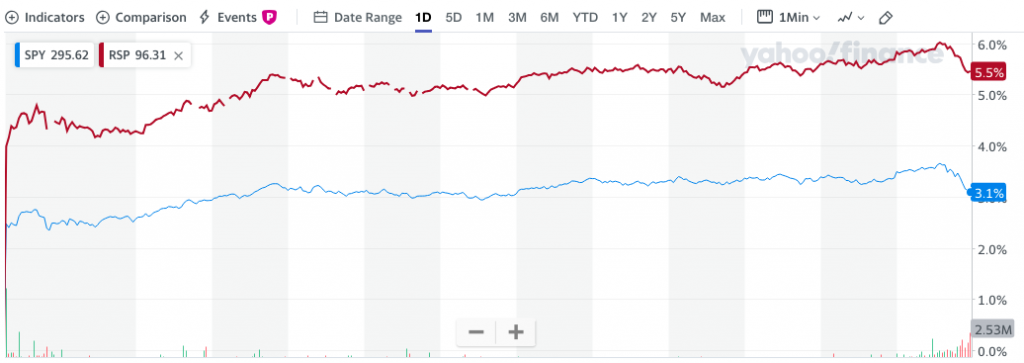
What we want to see is broad market strength/breadth in up moves. The RSP helps us to identify such breadth as it considers each stock of equal proportion. As shown in the chart above for both the SPY and RSP, the RSP rose by 5.5% Monday while the SPY rose by 3.1 percent. The market’s surge on Monday was indeed very broad and found with strong breadth.
We can also identify the strength of the move on Monday by way of the surge in the percentage of stocks climbing above their 50-DMA. Coming into the week, the percentage of S&P 500 stocks trading above their 50-DMA was just under 59 percent.
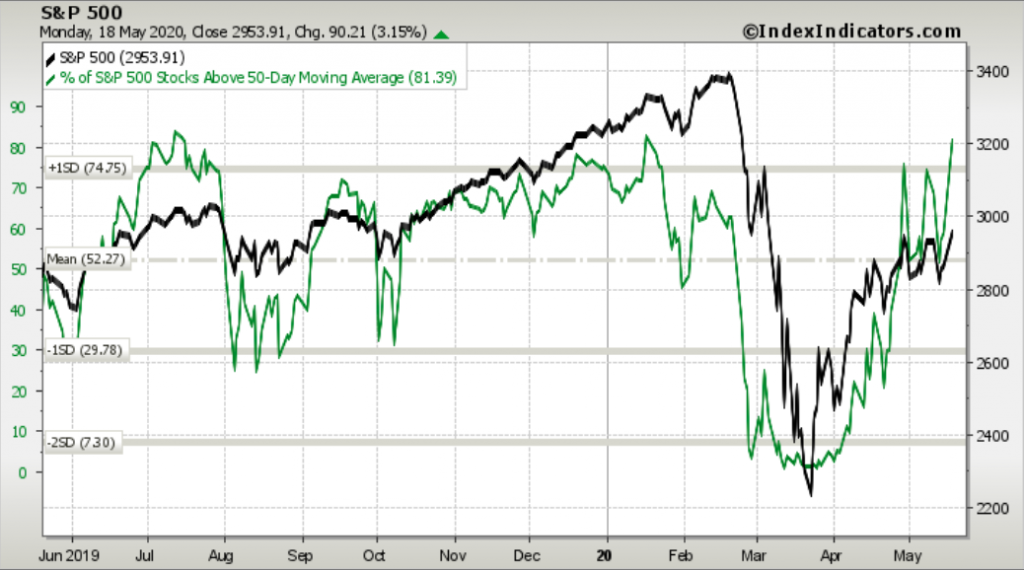
As displayed in the chart of the S&P 500 above, Monday’s move higher in the benchmark index found over 81% of stocks now trading above their 50-DMA. Andrew Thrasher of Thrasher Analytics recently discussed the relevance of this market internal reading in the context of a potential S&P 500 move above its 200-DMA. Such a move could potentially define a new bull market. Here’s what Thrasher offered:
“Typically, after a bear market (or a strong correction) has bottomed we’ll see at least 85% of the index constituents move above the 50-MA. This sign of strength is rarely found in in bear markets, but it’s also not entirely absent either. By combining both trend, as measured by the S&P 500 relationship with its 200-MA and breadth, with the percentage of stocks above their 50-day MA, we can more quantitatively evaluate the strength within the market and categorize a bear market rally from a true bottom.”

At 81% of S&P 500 stocks trading above their 50-DMA, the S&P 500 has edged closer to its 200-DMA on Monday and looks to continue its rally on Tuesday. The 200-DMA rests just below 3,000 and aligns with a gap zone that opened during the market’s breakdown from late February through March 23, 2020. Monday’s surge in the S&P 500 also found the index achieving a new relief rally high of 2,968. Investors increased risk Monday while dispensing with put options or hedges.
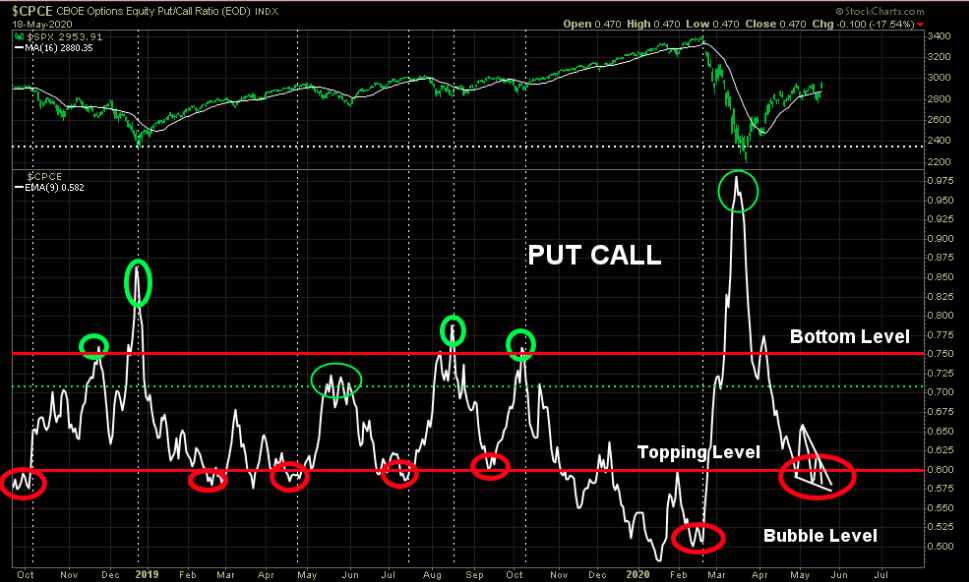
Usually, when the Equity Put/Call ratio proves this bullish for equities, there’s a set back of sorts that lay ahead for stocks. Additionally, the surge Monday begs of investors to reflect on such large market advances on the first trading day of the week, provided by the historical data. Just a heads-up, you’re not going to like the next day’s returns:
When the S&P 500 gains 3% or more to start the trading week (Monday, or Tuesday if Monday was a holiday) following a negative return week (S&P 500 -2.25% last week):
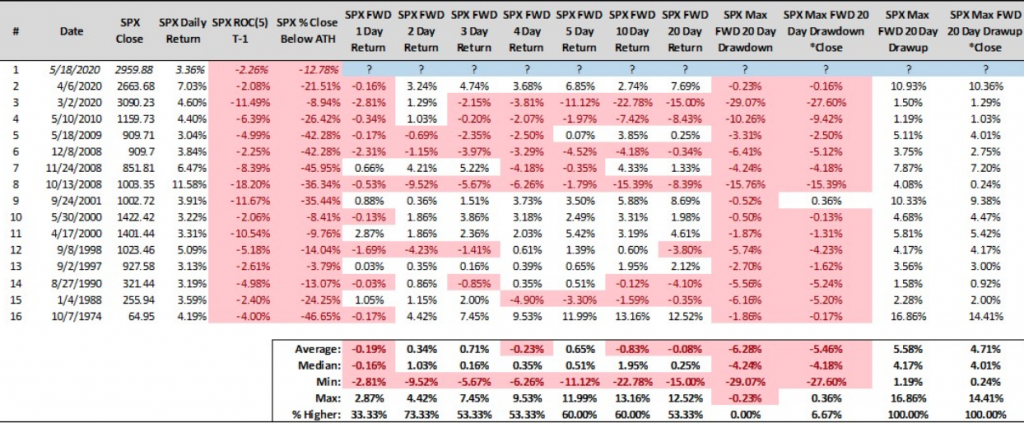
According to the table above that defines the returns after the criteria noted:
- The average return the next day is -.19%
- The average 2-day return is .34%
- The average 10-day return is -.83%
- The best returns come via the 3 and 5-day returns at .71% and .65%.
We don’t know if Tuesday will prove on-trend with the historical data, but equity futures are pointing to a down start to the trading day on Wall Street in the 6:00 a.m. EST hour. Either way, when we review Monday’s market action it would appear as though something changed. Michael Batnick agrees and chronicled the change that occurred in markets on Monday.
“With beaten down names like airlines, cruises, and retail bouncing, and the winners like Clorox and Regeneron lagging, the market is sending a message of hope that this is the beginning of the end of our battle with COVID-19.
Being long the “stay-at-home stocks” has been the trade of the year. Going into the weekend, an equal-weight basket of Zoom, Slack, Teladoc, and Pelton was up more than 200%. Today, these four names had their worst day relative to the broader market since March 24th, the day after we bottomed.
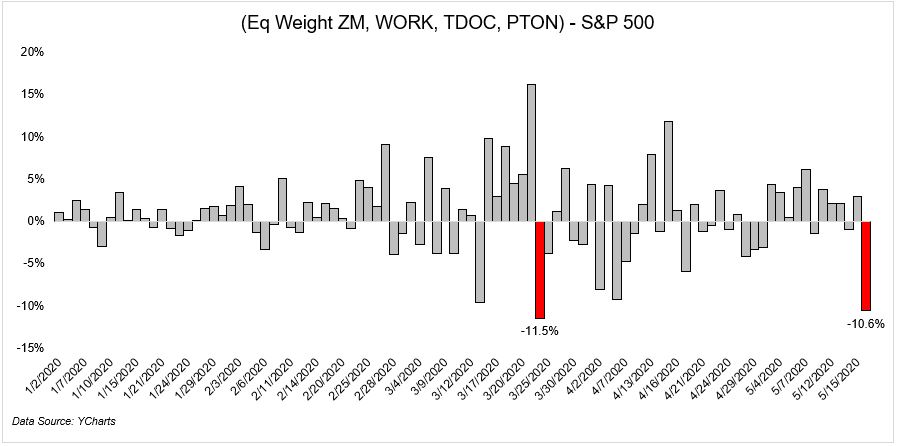
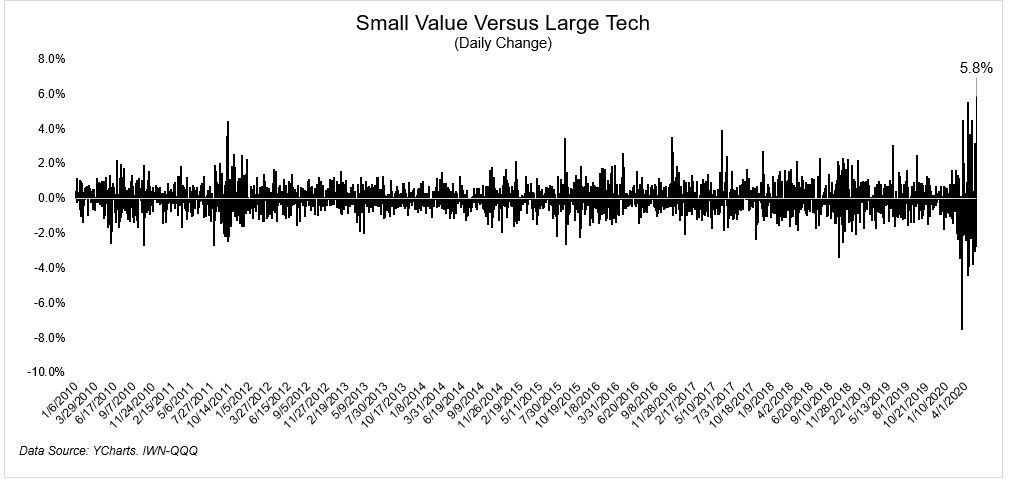
Prior to Monday, the NASDAQ-100 was up 5% on the year while small value was down 35 percent. Value investors experienced a reprieve today, with the outperformance of the laggards versus the leaders seeing its largest one day change since October 2008.
After weeks and weeks of negative COVID-19 headlines and a nearly complete shutdown of the U.S. economy, we are now sampling some good news/headlines. Of course, this is to the consternation of the media, which derives its larger audience from the dispensing of “bad news”. As such, we would expect more headlines in the near future that characterize and chronicle any pessimism surrounding heightened trade relations between the U.S. and China, valid or not.
As the U.S. economy slowly reopens, we have all sorts of new data series to track the pace of the recovery process. One such way of following the recovery trend is through city traffic congestion. The data is tracked courtesy of TomTom GPS analysis and delivered by DataTrek. Below is the latest data from Berlin, Germany.
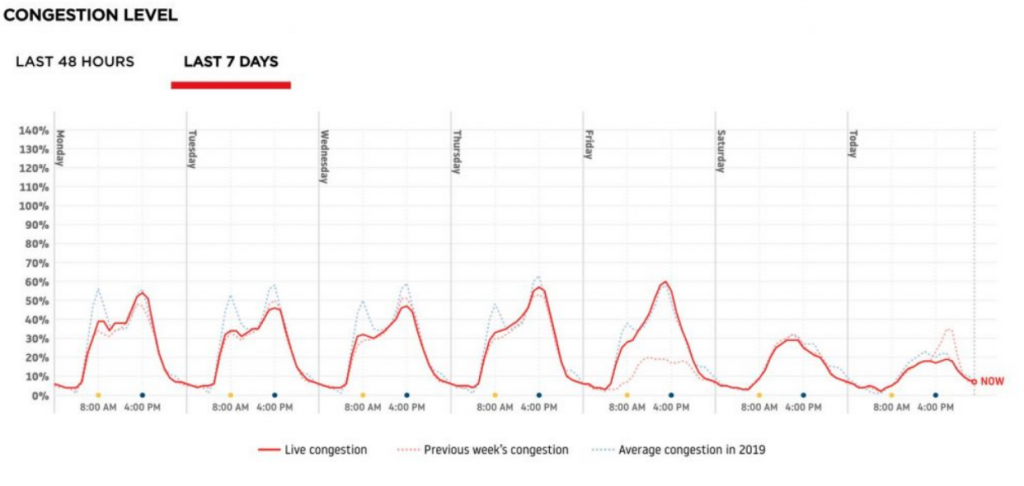
Berlin’s data tells a really good story:
- Weekday traffic is largely back to normal. The morning commute still looks light, presumably because of work-from-home.
- Midday traffic is entirely normal, which shows that retail stores and restaurants are taking deliveries again.
- This weekend’s traffic was largely normal, indicating consumers feel comfortable taking discretionary shopping trips.
Now let’s look at the first large U.S. city to reopen (Atlanta) and the largest so far (Houston), although they are on slightly different schedules since Georgia preceded Texas. These are the 2 most important natural experiments to consider when evaluating the cadence of America’s economic restart.
First, here is Atlanta’s traffic congestion over the last week:

And this is Houston’s traffic over the last week:

The lessons here:
- With the exception of Friday afternoon in Houston, the traffic data shows that U.S. reopenings are proceeding, but slowly.
- This weekend’s traffic looks very much like last weekend, showing that there is not much of a change in discretionary travel.
- Contrary to popular perceptions and social media attention-grabbing anecdotal evidence, reopenings in Georgia and Texas have proceeded slowly. That’s a good thing when it comes to containing a large second COVID outbreak. Remember: to congregate en masse in Houston or Atlanta, you pretty much have to first get in a car and drive.
Another means for which we can track how various states and even countries are reopening is through the OpenTable reservation board tracking analysis.
“As the COVID-19 pandemic keeps people home and some cities, states, and countries limit restaurant operations, our community of nearly 60,000 restaurants faces unprecedented challenges. We’ve summarized the data we have from the restaurants on our platform and are updating it daily.“
The following OpenTable data shows year-over-year seated diners at restaurants on the OpenTable network across all channels: online reservations, phone reservations, and walk-ins. For year-over-year comparisons by day, we compare to the same day of the week from the same week in the previous year. For example, they compare Tuesday of week 11 in 2020 to Tuesday of week 11 in 2019. Only states or cities with 50+ restaurants in the sample are included. All such restaurants on the OpenTable network in either period are included.
To better reflect the state of the overall industry, this dataset is based on a sample of approximately 20,000 restaurants that provide OpenTable with information on all of their inventory. This sample of restaurants chosen typically accounts for a significant majority of our seated online reservations.
Finom Group anticipates an uneven, but progressively positive reopening process for the months ahead. While the U.S. remains a step behind most of Europe and China, the data from these regions post the removal of lockdown guidelines proves promising.
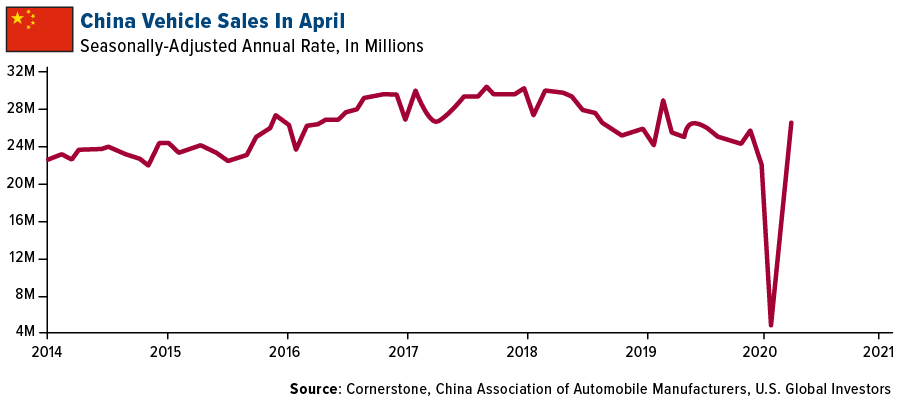
Several positive economic data points were released from China on Monday, from credit growth to sales. The country’s vehicle sales have rebounded and demonstrated a “V-shaped” recovery, as seen in the chart below. China has enacted several measures to encourage car buying such as easing purchase restrictions, extending subsidies and reducing value-added tax on vehicles. Cornerstone Macro noted that the M2 money supply rose 11.1% year-over-year in April, the fastest pace in three years, and an important support for nominal GDP growth.
Things will get better, despite the recent economic and market turmoil, the resurgence in economic activity seen around the world and to varying degrees that may prove dependent on how much fiscal stimulus has been provided, things will get better! Equity markets may be “slow walking” investors toward this understanding, foreshadowing better times ahead. With this in mind, the seemingly disconnected economy and market maintains a drum beat amongst the investor community.
Moreover, and in keeping with our “tracking the recovery” theme, there are more economic metrics we’ve been tracking that should give us a real-time look at the trajectory of higher-frequency economic data. Google puts together “mobility reports” (tracking movement trends over time), and in today’s environment, they’re particularly useful for tracking what’s going on in workplaces in general, and retail/recreation specifically. Globally, they have begun to trend higher, with the U.S. having compressed less than many European countries; but still lagging the improvement in places like South Korea.
Google Global Mobility Trends


In addition to the Google Mobility data, we can see that hotel occupancy rates have moved off of their lows, even though air travel continues to lag most travel and leisure data.

It’s going to take some time to rebound from the unique and lingering economic and social consumerism impact from COVID-19. In the meantime, however, monetary and fiscal policy initiatives aim to bridge the gap between the recession and the recovery, smoothing the process over the coming quarters.
The Federal Reserve Open Market Committee (FOMC), for its efforts, is doing all it can do by means of monetary stimulus to support the economy through the crisis period. Fed chairman Jerome Powell recently answered questions on the economy and the Fed’s “printing press”. The Fed is undoubtedly increasing the money supply and engaged in the purchases of all things debt-related, be them mortgage-backed securities or high yield corporate debt. Powell’s Q&A session on the CBS 60 minutes show caught the attention of many Fed pundits when the chairman recognized that the central bank indeed was digitally printing money. The “admission”, if you will, gathers scrutiny amongst social media participants and the broader media, even as this category of market participants already understand this is taking place.

What angers most market participants is the inflationary implications from the Fed’s printing press. Finom Group sees no means whereby such an increase in money supply heightens the risk of inflation. Many of these same market participants heralding inflation concerns simply conflate the increase in money supply with money velocity. Money velocity measures whether the money being pumped into the financial system and/or households’ hands is moving into the economy (via borrowing, investing, spending, etc.). Although money supply has spiked, the velocity of money has basically imploded.

Money velocity doesn’t necessarily move as quickly as the title of the metric would assume and as identified in the chart above. If you’re betting on inflation in the U.S. economy, as history has proven, you’re betting against trend.
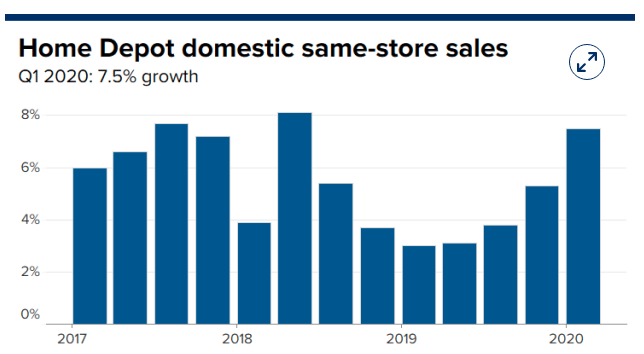
Heading into the 7:00 a.m. EST hour, equity futures are worsening their decline, as investors digest the latest quarterly results from Home Depot (HD). For the first quarter that ended May 3, Home Depot reported that net income fell 10.7% to $2.25 billion, or $2.08 per share, compared to $2.51 billion, or $2.27 per share, a year earlier. Analysts surveyed by Refinitiv expected the company to earn $2.27 per share.
Revenue for the quarter rose 7.1% to $28.26 billion from $26.38 billion a year earlier, topping analyst expectations of $27.54 billion. Home Depot’s same-store sales grew 6.4%, beating expectations of 4.4%, based on StreetAccount estimates.
The do-it-yourself retailer previously said it would hire 80,000 additional employees, with many part-time hires staffing its garden center, on par with spring hiring in recent years despite disruption from the coronavirus pandemic.
However, the company has said it canceled major spring season promotions that drive foot traffic to stores, such as Black Friday-like events. It also has been enforcing social distancing in its stores, and it distributed thermometers to employees who work in stores and distribution centers so they can monitor their temperatures.
Also ahead of the opening bell, investors are awaiting further retailer results from the likes of Kohl’s (KSS) and Wal-Mart (WMT). Finom Group recently traded shares of WMT heading into the earnings release. We outlined the trade to our Premium and Master Mind Options members via our private Twitter feed.
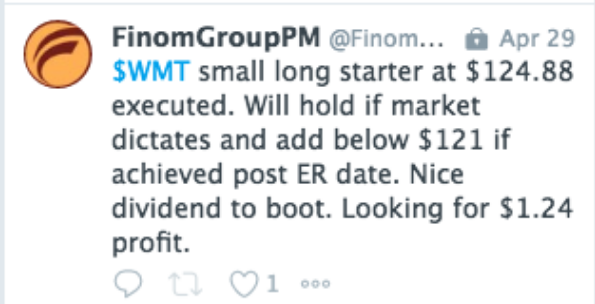
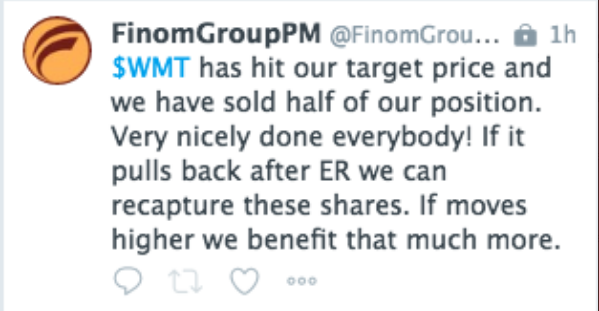
After collecting the dividend of $.54 per share, we captured some nice upside and reduced our position in the name. Additionally, we’d like to see a pullback in the stock to recapture shares for future potential gains. If such a pullback does not present itself, the remaining shares will be maintained.
In rounding out today’s daily market dispatch, we continue to encourage investors to recognize the market’s potential to develop alongside the economic recovery. The market is already looking forward to future growth, although it may be front running a bit to optimistically, depending on whom you ask. Thus far, monetary policy has prevented another credit crisis and provided credit market liquidity and equity market confidence. Fiscal policy (Cares Act) has also managed to stave off certain bankruptcies and offered provisional measures for the millions of unemployed who otherwise would not be able to pay monthly bills.
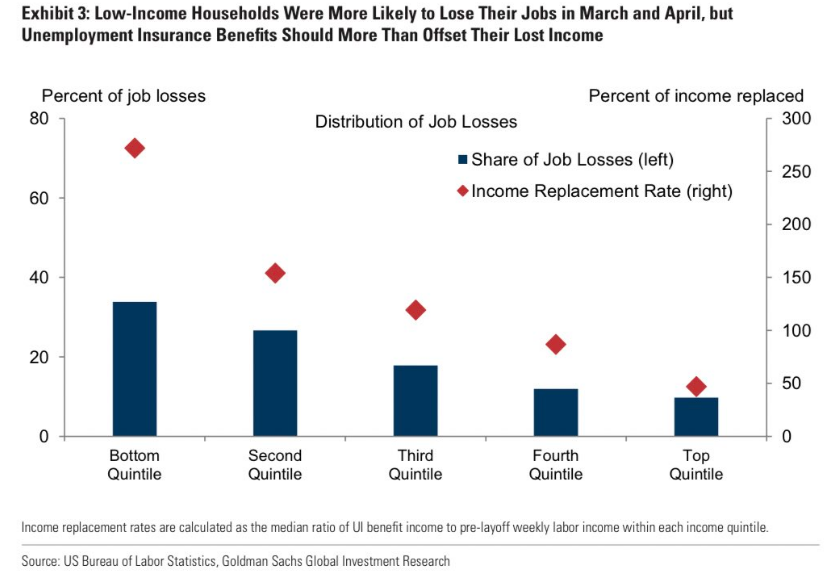
GOLDMAN: “.. total unemployment insurance benefits (including the $600/week federal supplement) more than offset lost income for low-earning workers .. suggesting that most of these workers should not have trouble making payments despite losing their jobs.” (Briggs)
And then there’s Jim Cramer. The CNBC “Mad Money” host and daily commentator on all-things market related suggested that the market sell-off may not be over on May 14th. Since then, of course, the market has rallied significantly. This is not to say that eventually the market won’t once again consolidate, but it’s kind of funny how the market works to the contrary of Cramer’s offerings and/or advisement.
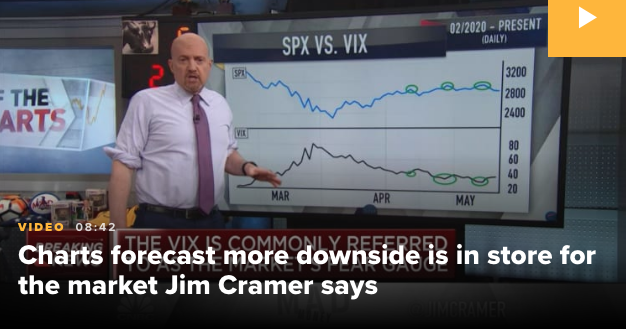
Monday’s rally just added another layer of failure to BTD-remorse for many, possibly even Jim Cramer. In his latest color commentary, Cramer throws a bit of cold water on the Moderna-driven market rally Monday. Cramer warned that investors approached the market with a “better-to-be-sorry-than-safe” attitude. He thinks a multitude of stocks went up that are vulnerable should Moderna’s efforts prove to be fruitless. Cramer welcomed the development but took on a cautious outlook.
“This data doesn’t prove anything, it just suggests that Moderna might be on the right track.”
“I know we got good news from Moderna, but let’s hope this safety-last attitude goes away, because if there’s another big outbreak and we have to go back into lockdown, many of today’s winners will come right back down.”
Funny how almost immediately after Cramer warns of further market declines to come, the market then rallies for 3 straight trading sessions and he can’t find himself more optimistic about the path forward. Or is it? We are for cautious optimism, but Cramer is proving a bit offsides with the analyst community and with regards to the latest vaccine headlines.
With about eight coronavirus vaccine candidates in clinical trials and 110 more in clinical testing, the race to a commercial product is intensifying. Against this backdrop, an analyst at Morgan Stanley looked at the most promising programs. Millions of doses of the vaccine could be available by fall 2020, and over 1 billion in 2021, analyst Matthew Harrison said in a note. The analyst sees safety as the biggest hurdle for these expedited programs.
It’s best to remain open-minded and flexible with your market participation as guesstimates are more the new normal in an environment unlike anything we’ve ever seen in the past. Have a safe and profitable trading day everyone!


