
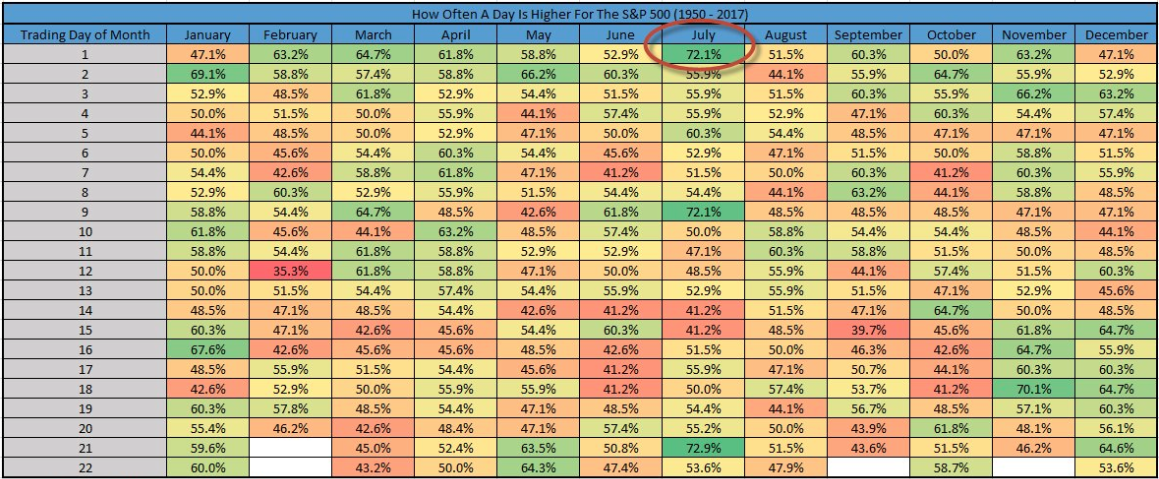
Let’s keep this short, but sweet and hopefully the market will perform in kind today. Yesterday was quite the roller coaster ride as the Dow opened sharply lower by roughly 200 points, carrying its peer indices lower. But as the day progressed, the market achieved the most probable outcome, which would be to finish in the green. As Finom Group outlined in a previous article titled Tariffs May Set Off Fireworks In a Holiday Shortened Trading Week, the stock market has finished higher 72% of the time on the first trading day of July.
Despite the early session losses, the market came roaring back and lived up to its historic performance. All 3 major indices finished higher on the day, led by the Nasdaq’s outperformance. The VIX also had a nice peak to trough day with the sentiment index rising sharply above 17.5% in the morning and falling to 15.6% to finish the day.
A lot has been made of fund flows lately and since the vast majority of those flows have found capital leaving the equity markets. For the Q2 2018 period, June brought global net equity outflows to $20.2 billion, the worst performance since the third quarter of 2016, just before the presidential election. The selling was particularly felt in mutual funds, which saw $52.9 billion in outflows during the quarter and are typically more the purview of the retail side.
We all know the reason for outflows in the market as of late and they largely point to a slow down or disconnect in global growth, inflation fears even as they are not necessarily realized and of course the heightened trade rhetoric. But here’s something interesting to note about the data and how it’s being reviewed. The following is from a recent CNBC article:
“Stocks right now are hanging by a thread, boosted by a bonanza of corporate buying unrivaled in market history and held back by a burst in investor selling that also has set a new record.”
The quote is from an article titled Companies buying back their own shares is the only thing keeping the stock market afloat right now. Talk about a headline right. Well, now look at the following chart by Steve St. Angelo:
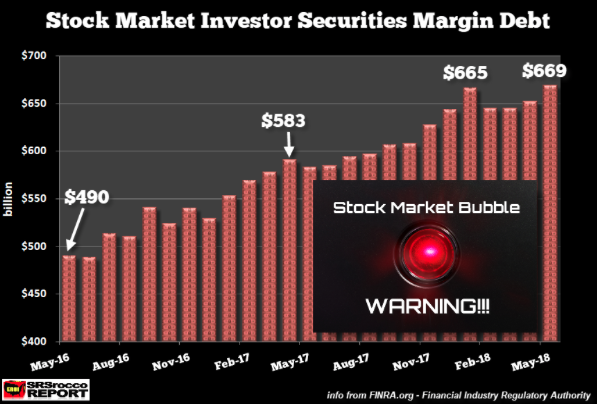
According to FINRA, the Financial Industry Regulatory Authority, investor margin debt reached a new high of $669 billion in May. The latest debt level is up 2.6% month-over-month. By and large, margin debt tends to march higher as investor participation rates increase and capital dedicated to the market increases, all the while as investors/traders borrow to speculate on rising stock prices. As such, corporate buybacks aren’t the only thing holding up the market as the corporate sector has little to do with equity margin debt, this is on the back of you and me.
With the additional information provided, the article from CNBC is proven nothing more than sensationalistic. Why is the article not an outright falsehood? Well, what would happen if corporate buybacks were removed from the market? It’s quite likely that the market would express a short-term decline along with the market participation rate and margin debt. In short, corporate buybacks are NOT the only thing holding up the market, but those buybacks are one of the market’s supporting variables.
Here’s one more perspective on the market and margin debt to consider. The following chart is taken from one of my favorite economists, Ed Yardeni of Yardeni Research.
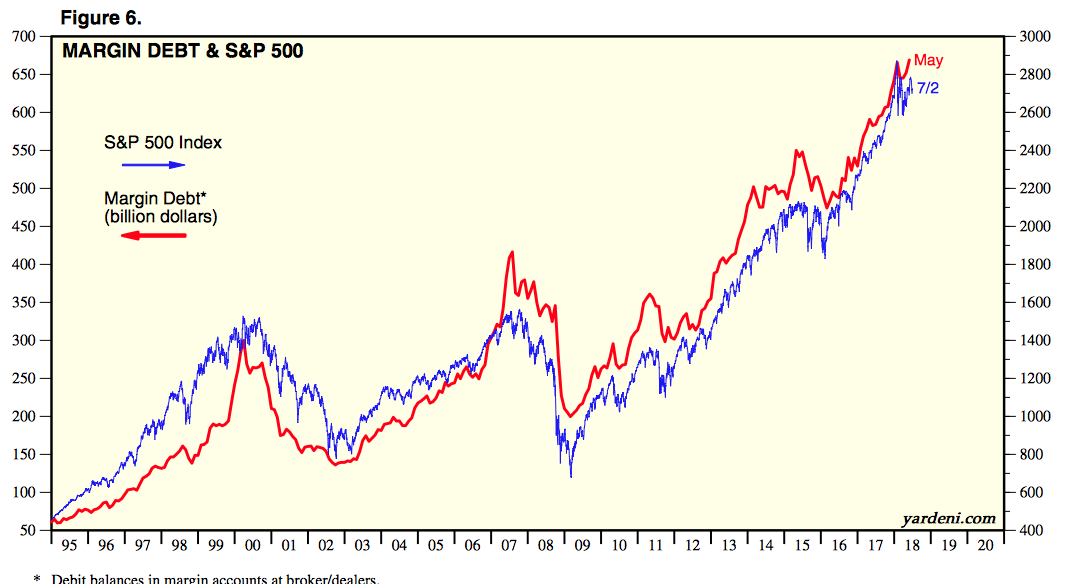
The chart identifies the correlation between the S&P 500 movement and the direction of margin debt. Pretty correlated, right? So while margin debt is at record levels in 2018, that is more a factor of time passing more so than anything else. Margin debt moves in one direction over time, much like treasury yields. Sure there are blips in margin debt that in hindsight can be rationalized as market tops, but in real time it is nothing more than a metric showing how much capital is borrowed by traders in the marketplace at the given time.
It’s often been said that peaks in margin debt signal a market crash is imminent. This is also an untruth or misnomer. In 2013, when margin debt made another new all-time high it didn’t result in a market crash and found margin debt accelerating higher through 2016. That’s 3 full years before margin debt declined sharply in 2016 and before once again accelerating higher. These facts also forced an article from Bloomberg titled Don’t Count on Margin Debt as a Crash Indicator. Sometimes, we simply have to dig deeper as some media outlets offer singular perspectives.
With the margin debt metric debunking the corporate buyback market reliance out of the way (although admittedly corporate buybacks are helpful), let’s briefly take a look at yesterday’s economic data.
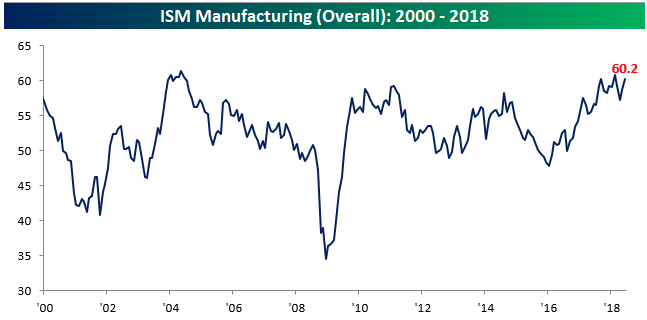
The June round of PMI data confirmed what we had previously been seeing. On the data, the ISM manufacturing PMI jumped +1.5pts to 60.2 (vs expectations of a fall to 58.2) This month’s reading of 60.2 was well ahead of consensus expectations and was tied for the second highest reading of the current expansion. By and large, the key takeaway from the data is that the trend of improvement appears consistent with GDP growth accelerating towards 4% near-term. Here’s what was noted within the release, suggesting even greater GDP growth:
“The past relationship between the PMI® and the overall economy indicates that the PMI® for June (60.2 percent) corresponds to a 5.2 percent increase in real gross domestic product (GDP) on an annualized basis.”
With the economic data out of the way and the docket rather light today, we look forward to the 4th of July holiday. U.S. equity markets will close early today at 1:00 p.m. EST ahead of the holiday. Overnight, Asian markets were mixed with the Hang Seng falling another 1.4% and firmly in bear market territory. European markets are largely higher in the early trading hours, which is helping U.S. equity market futures rise as well.
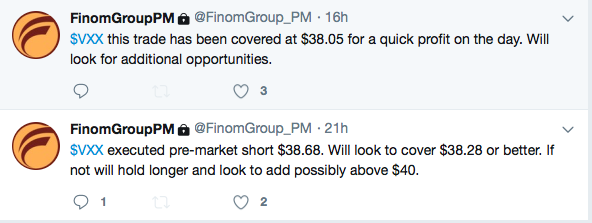
Finom Group continues to trade what the market offers and the market offered a great deal of volatility yesterday. As such, we alerted our subscribers to our short execution in shares of the VIX-ETP (VXX)
Finom Group often finds itself desiring early morning heightened levels of volatility that have little to do with the economy and corporate earnings and more to do with irrational fears. As such, we usually find volatility calming shortly thereafter and as markets adjust to the key driver of equity prices that serve to curtail said volatility.
When investors return from the 4th of July holiday, they will have to look forward to employment data in the form of ADP employment data on Thursday. Also due out Thursday is the FOMC minutes, which can and often does move investors/traders to act. On Friday, investors will receive the all-important Nonfarm Payroll and wage inflation data, which has become a hot-button data point in 2018. From all of us at Finom Group, have a joyous and safe 4th of July!


