
In the latest week, the Dow fell 0.6%, the S&P lost 0.7% and the Nasdaq fell 2 percent. For the month of June, the Dow rose 0.1% while the S&P added 1.1% and the Nasdaq rose 1.3 percent. In the second quarter, the Dow gained 1.4%, the S&P was up 3.6%, and the Nasdaq gained 6.7 percent. The meager moves for the Dow and S&P 500 mean the indexes have remained in their tight trading ranges they’ve been in for months; both also remain in their longest stretch in correction territory since 2008 and are fewer than 10 trading days away from their longest correction since 1984.
Investors and traders are at somewhat of a crossroads in both the economic cycle and the market cycle. There are many factors pushing and pulling investors in either direction as we head into the 3rd quarter of the calendar year. The key question for the rest of the year is whether the first half of the year’s major points of uncertainty become concrete changes to the macroeconomic environment in the second half of the year, and whether those changes will extend what’s already a historically long bull market, or possibly bring it to a screeching halt. As we consider this question we review the pros and cons or points of optimism versus pessimism.
Optimists
- Rapid corporate earnings growth
- Strongest labor market in years
- M&A accelerating in latter parts of Q2 expected to continue into Q3 and Q4
- Corporate buybacks at record levels
- GDP set to exceed 3.5% in Q2
Pessimists
- Global synchronized growth showing signs of cracking
- Central bank policy less accommodative and expected to become restrictive by the end of 2019
- Trade war looming as protectionists policies take form
- Flattening yield curve. An inverted curve, when short-dated yields rise above longer-dated ones, is seen as a reliable predictor of a recession. Currently, the spread between the two-year and the 10-year is at its narrowest since 2007
- Dollar appreciation
The overarching concern for most of the 2nd Quarter was the global trade agenda and rhetoric pushed forward from the White House. While the notion of a trade war is concerning, especially one with the 2nd largest economy in the world being China, the U.S. is seemingly in a position of power to express its will at the very least. Owing to the asymmetries of the trade relationship, there are many more goods coming into the U.S. from China upon which tariffs can be levied than the other way around. Last year, the U.S. exported just $130bn in goods to China, while China exported some $505bn in goods to the United States as indicated in the table below.
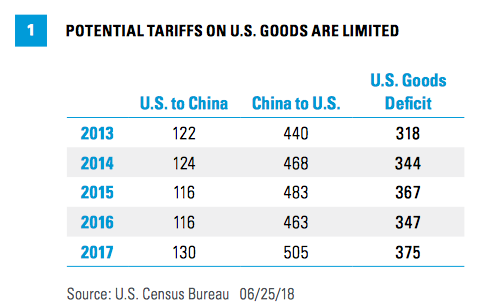
This means that China cannot sustain a tit-for-tat strategy in the dispute over trade; there are simply not enough imports from the United States. This seems to encourage China to look for other channels to express its displeasure, namely areas where it recognizes that the U.S. wants something from it, such as dealing with North Korea, reducing purchases of Iranian oil, and the territorial disputes in the South China Sea. Tariffs and retaliatory tariffs will begin taking effect at the start of Q3, namely a deadline on July 6th would find an implementation of tariffs on China to the monetary value of $34bn. Secondary rounds are possible. As a base case for imposing this initial round of tariffs, the percent of world trade being penalized is quite modest.
In a Friday note, economists at UBS said their base case is that the U.S.-China dispute will be solved through negotiations, albeit only after the Trump administration formally imposes tariffs on a round of Chinese goods on July 6 followed by retaliation by Beijing.
“If we are wrong, escalation could quickly lead to substantial adverse effects. Our view is that additional tariffs after this first round points to a full trade war with China. . Across-the-board 10% tariffs on all China imports would boost inflation by a quarter of a percentage point and slow growth by around 0.2 percentage points. A full trade war with higher tariff rates would also “disrupt supply chains, leading to nonlinearities, with substantially higher inflation in the near term and possibly a recession. We see the probability of such an escalation as low, but not to be ruled out.”
Here is what LPL Financial had to offer regarding their view on the ongoing trade dispute between the U.S. and China:
“While we do expect trade disputes to take a small bite out of the impact of financial stimulus, likely 0.1–0.2% of GDP, and anecdotal reports of businesses delaying business investment pending outcomes are already appearing, we expect the impact of fiscal stimulus to be the main player in the direction of the U.S. economy over the next year or longer.”
When we look back at the first 6 months of the year, there was an increase in volatility for the markets, with volatility up more than 40% YOY. Having said that, it’s important to rationalize that the increase in volatility versus the year ago period came from historic lows in volatility. In 2017, the VIX’s mean reading was roughly 11% and found VIX futures in contango by roughly 9% for the balance of the year. When viewed through this prism of extremely low volatility in 2017, it’s of little wonder that volatility has increased in 2018. Moreover, the macro-issues support a higher level of volatility in the marketplace versus 2017.
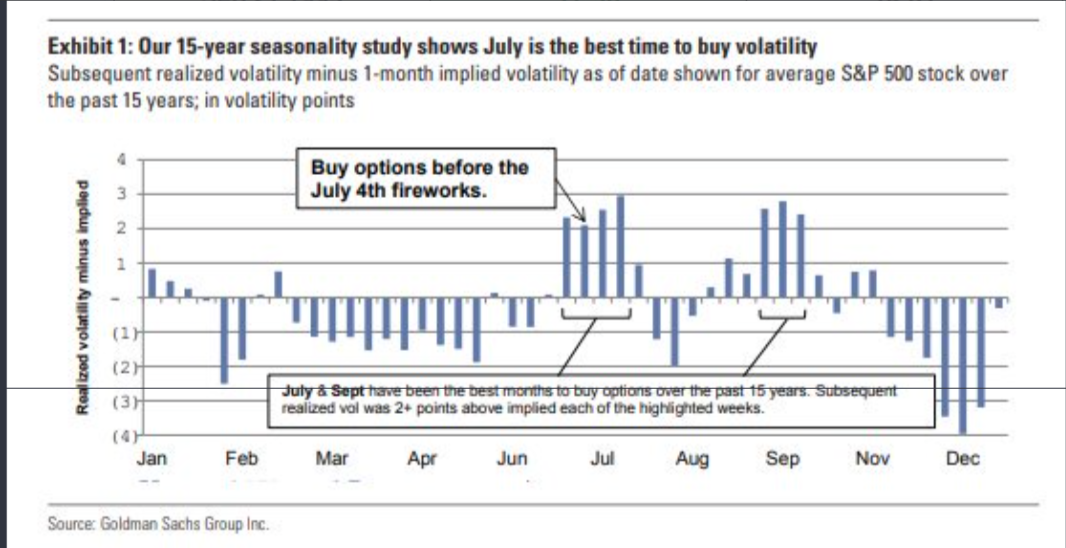
In terms of market volatility, July tends to be the best time to buy volatility from a seasonal standpoint. The chart below from Goldman Sachs validates such seasonality trends over the last 15 years.
Another consideration regarding market volatility we derive at is from looking at weekly expected moves in the S&P 500. Ahead of last week’s trading, we disseminated the following in our look at the trading week ahead:
“The expected move in the S&P 500 for the coming week is nearly $36 after an expected move of only $31 in the previous week. That’s a pretty big bump in the expectation, signaling the potential for greater volatility in the week ahead.”
And we certainly did get a nice bump in volatility during last week’s trade. What’s a bit more remarkable and even concerning is that the expected move in the coming trading week is even greater.

As shown in the screenshot above, during a shortened trading week (due to the July 4th holiday) the expected move for the S&P 500 is even greater than the full trading week last week. The expected move for the S&P 500 jumps from $36 to $42 this coming week; this is a week that has only 4 trading days. So be careful folks as there may be yet another ramp up or down in volatility.
Of course, another ominous sign for equity prices near term comes in the form of fund flows, which we cannot ignore. Global equity funds have seen outflows of $12.4 billion in June, a level not seen since October 2008, according to market research firm TrimTabs. As the emerging market and non-U.S. trade has unwound and fears have intensified over a trade war, investors have fled global stocks and returned to the U.S., where funds have seen $6.3 billion in inflows. The iShares emerging market ETF has seen $5.4 billion in outflows in June, the most of any fund, according to ETF.com.
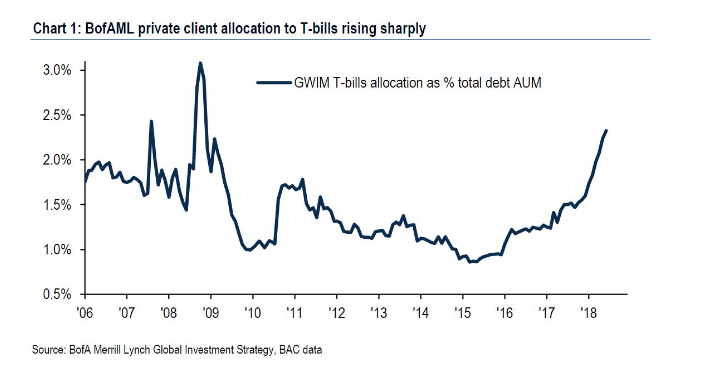
According to BofA Merrill Lynch Global Research, U.S. equity funds saw outflows of $29.7 billion in the latest week, the second-largest one-week redemption in history. They pulled $24.2 billion from U.S.-focused stock funds, the third-largest weekly outflows in history. At the same time, private-client allocations to Treasuries have surged to a 10-year high in 2018.
As we look forward to celebrating our nation’s Independence this coming week, the trading week will be one that is marred with uncertainty and potentially prove to be a volatile week. One interesting factoid we pointed out with regards to the coming trading week, in an article last week, is how the market performs on the first trading day of July.
“The most bullish S&P 500 trading day of the year, since the new century is (drum roll please)…. that’s right, July 2.
-
When: First trading day of July (in 2018, that’s July 2)
-
Average return: 0.35%
-
Win rate: 83.33%
Below is yet another interesting table, from FactSet, that identifies the win rate for the market on the first trading day of July and since 1950.
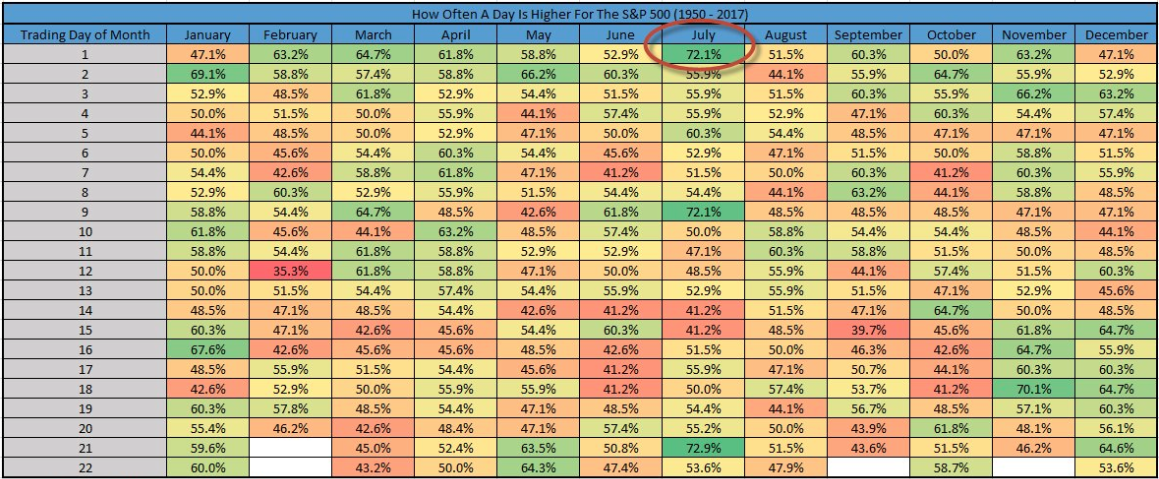
It’s important to understand, however, that never before has this particular trend been met with the Fed unwinding its balance sheet the Saturday before the 1st trading day of July. Moreover, the trading day the Fed has been unwinding its balance sheet has found the S&P 500 in negative territory 75% of the time. It’s a collision course of trends that will find a winner and a loser come Monday!
This week is also subject to the all-important economic data, especially data that will come in the form of labor reports. On Thursday, traders and investors will be delivered the ADP employment report and on Friday will be the release of the government’s Nonfarm Payroll report. Expectations for the NFP report is that the economy grew jobs by roughly 205,000 during the month of June. We’re likely going to have a lot of media coverage concerning the trade tariff deadline of July 6th, all week long, which will likely serve to foster market sentiment. The middle of July will be represented by the earnings season kicking off. Earnings estimates for the S&P 500 Q2 period have been ratcheting higher of late.
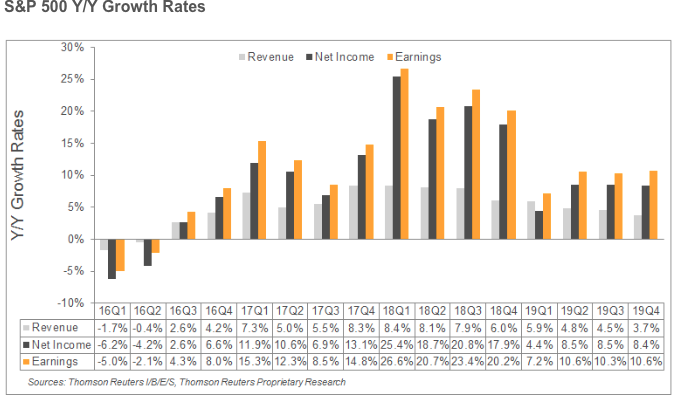
Only a month ago, Thomson Reuters was forecasting Q2 earnings growth of 20 percent. Since then, the data tracker has boost the forecast to 20.7%, which may prove to be too low as well.


