
Finom Group wants to take this opportunity to wish everyone a festive and safe Holiday season, spent with friends and family. We hope to see you back here, taking part in our well-researched financial market narratives and research reports. Subscribe today to take advantage of our Premium and Contributor Membership level exclusive video analysis and deep-dive weekly Research Reports. We’ve carefully guided our members throughout the year with a highly accurate forecast for economic output and the S&P 500 rally. With that being said, let’s get to it folks.
All Things Market Related
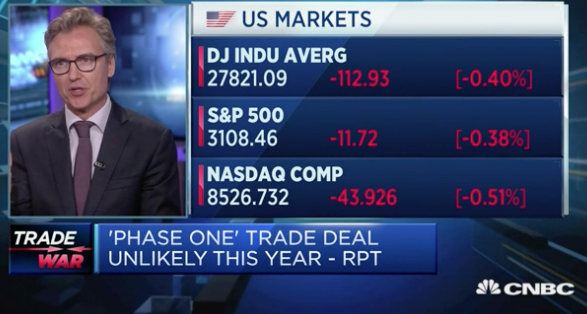
The S&P 500 (SPX) will look to recapture its momentum and uptrend this shortened, holiday trading week. The benchmark index fell by .33% in the past trading week, breaking a streak of 6 consecutive weekly gains.
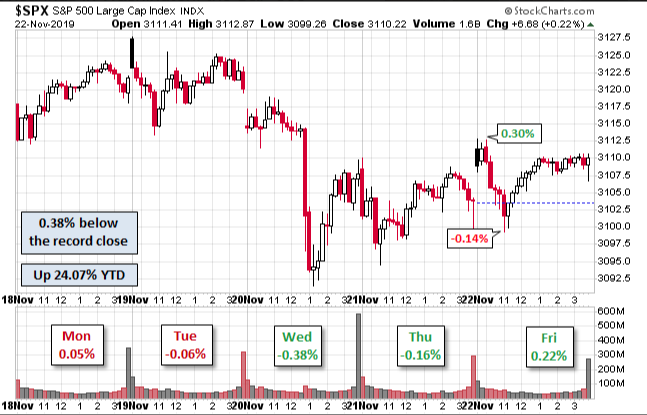
Although it is a holiday shortened trading week, investors and traders will hope to see the recent moderation to the downside in equities met with investor optimism over the holiday shopping season. Ahead of the annual festivities, it appears investors have already gone on hiatus, with the S&P 500 relative strength index already showing weakness.
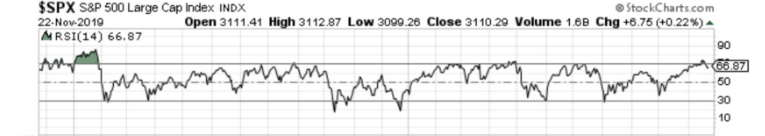
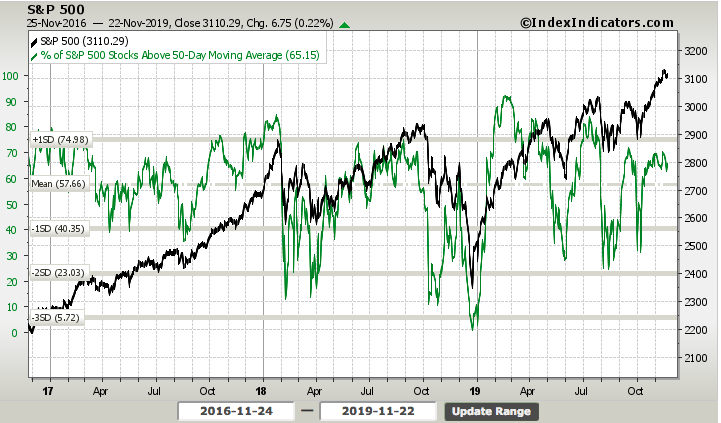
To be fair, however, the RSI is still hovering at very healthy levels and above 60 heading into the trading week. Other breadth indicators have also weakened, as one might expect post a 6 week rally, but remain in healthy territory. The percentage of stocks in the S&P 500 trading above their 50-DMA also remains above 60%, although off of their recent highs of 70 percent.
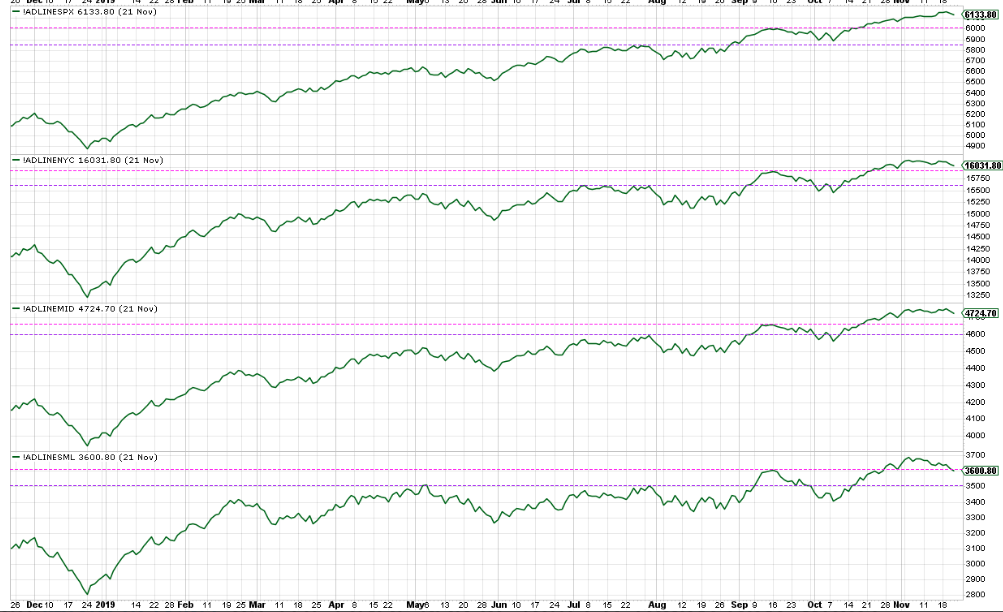
One chart we’re keeping an eye on, amongst the plethora of breadth indicators, is the small cap breadth. Small cap stocks breadth line just broke down through support support this past week. Certainly the broader, large cap stocks can continue higher, but for how long? (bottom chart)
Past the midway point of November and heading into the final trading week of the month, the S&P 500 is up more than 24 percent. And remember where the S&P 500 entered the month of November, which kicks off the best 6-month period to own stocks historically. The S&P 500 ended the month of October at 3,037 and has now advanced another 2.3% during the month of November. So what’s the significance of this move? In order to define the significance we need to start at the beginning of the year, whereby the S&P 500 gained 7.9 percent.
It proved to be one of the strongest January months in history. “Strong January Playbook”, or historical analysis of what happens after the S&P 500 has outsized gains in January, has worked nearly every month in 2019. Abnormally strong January returns have been a historically clear signal about market direction over the balance of the year.
- The S&P 500 rose by 7.9% during January 2019, one standard deviation above this month’s average return of 1.2% since 1958 (first full year of data).
- There’s only been 8 other Januaries that have also returned +1 standard deviation above the average, or 15% of the time: 1961 (+6.3%), 1967 (+7.8%), 1975 (+12.3%), 1976 (+11.8%), 1985 (+7.4%), 1987 (+13.2%), 1989 (+7.1%), and 1997 (6.1%).
So what happens in November and December during the Strong January Playbook. Datatrek identified the periods as follows:
- November (good): The average historical return is +1.3% and the S&P was higher 75% of the time. The worst return was -8.5% in 1987 and the best was +6.5% in 1985.
- December (really good): The average historical return is +2.8% and the S&P was higher 88% of the time. The weakest return was -1.2% in 1975 and the strongest was +7.3% in 1987.
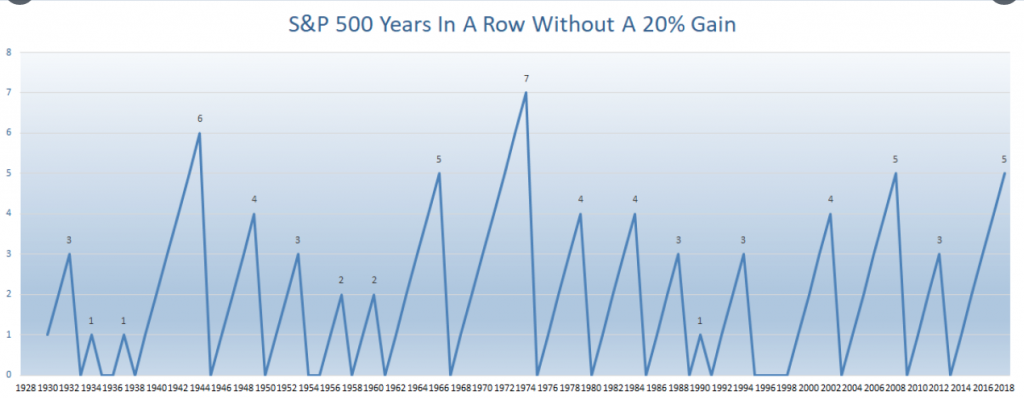
It appears as though the S&P 500 has already eclipsed the typical returns for the Strong January Playbook by a full percentage point. This may speak to the liquidity regime of the market as well as investors looking forward to a rebound in earnings come 2020. Also keep in mind, the S&P 500 hadn’t been up 20% (price only) for 5 years in a row. One of the longest streaks ever. Although the market doesn’t work by our clock, it may be overdue! (Chart from LPL Financial)
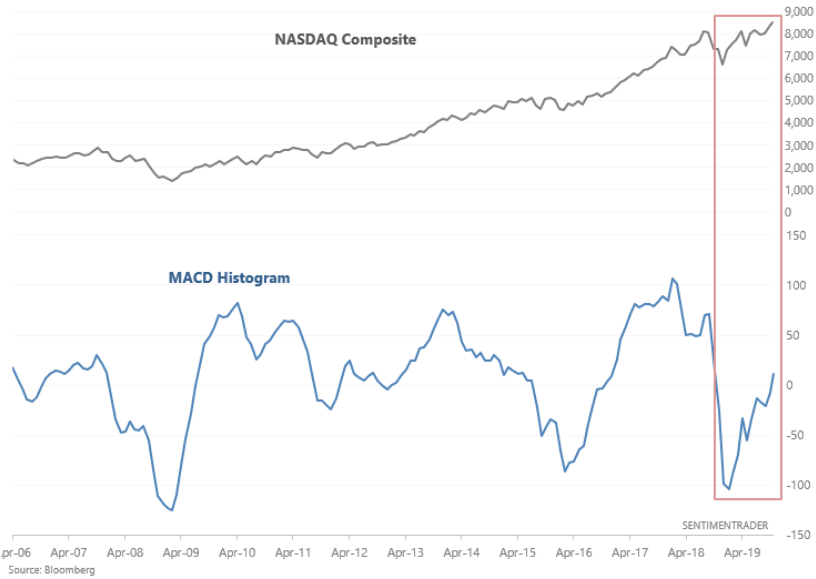
Last, but certainly not least is a significant development in the Nasdaq (NDX). Barring a significant decline this coming week, the NASDAQ Composite’s monthly MACD histogram is about to turn positive for the first time in 12 months. When this happened in the past, the S&P 500 & NASDAQ soared over the next 6-12 months every single time.
While the statistics don’t lie folks, history doesn’t always repeat itself, so bear this in mind that when we review historic data it is not a guarantee of future results but an observation of forward looking probabilities. We emphasize this point because there have been some rather mixed signals coming from the tech-heavy NASDAQ of late. Just a couple weeks ago, the index triggered a so-called Hindenburg Omen and an Ohama Titanic Syndrome.
The Hindenburg Omen is formulated to predict market crashes, or severe downturns, by synthesizing data, including 52-week highs and lows, as well as stock moving averages on the New York Stock Exchange. In this case, it is forming in Nasdaq-listed stocks. The Omen was created by Jim Miekka, a blind mathematician, marksman and teacher, who died several years ago. Miekka claimed that his indicator had been an accurate predictor of every market crash since 1987.
The Titanic Syndrome was coined by Bill Ohama in 1965, and is viewed as a “preliminary sell signal.” Chart specialist Tom McClellan says that in the past when lows surpass highs, within seven trading days of a one-year peak for an index, an Ohama Titanic Syndrome signal is triggered.
Jason Goepfert, head of SentimentTrader said that for his purposes, he used the following conditions to help determine whether the Titanic syndrome had been triggered: 1) The Nasdaq-100 closed at a 52-week high at some point in the past 7 sessions, and 2) New 52-week lows outnumber 52-week highs on the Nasdaq.
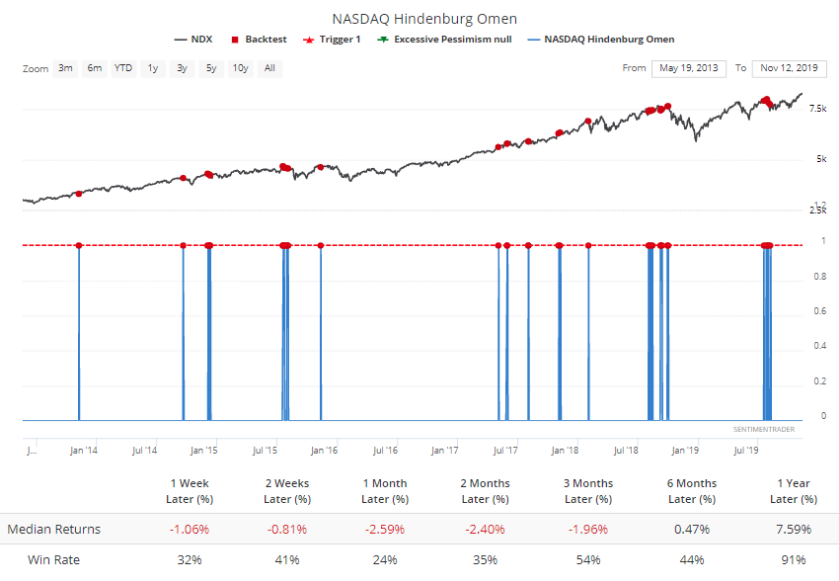
The strategist said both developments are “ a warning sign that typically precedes trouble” over the coming months, which is how it played out this summer. However, he did caution that only one such instance of those patterns, rather clusters, have occurred so far. “It’s only a single reading, not a cluster of days yet, but that hasn’t really mattered for future returns,” he said.
While the Hindenburg Omen and Titanic Syndrome sound ominous, Barry Ritholtz of The Big Picture blog says there both meaningless and predict nothing.
“Every now and again, a way of looking at markets suddenly gains traction. Data gets assembled, analyzed, reviewed. Eventually, it becomes the basis of traders’ decision-making process. It even can become part of Wall Street lore.
The problem that arises all too often is that this approach is statistically bogus. The data gets cherry picked; backward-looking analysis gets form-fitted to what just happened and has no meaning for what is most likely to happen in the future. Confirmation bias and selective perception can lead an investor to lose objectivity, choosing an approach that justifies an existing portfolio mix, as opposed to objectively evaluating the data.
Consider as an example the ominous-sounding Hindenburg Omen, a technical analysis that purports to signal the likelihood of a market crash. That’s exactly what it’s been doing — unsuccessfully — since 2010. This sort of recession porn allows people to confirm their existing prejudices. After five years of money-losing forecasts, the Hindenburg Omen’s following among traders is fading.
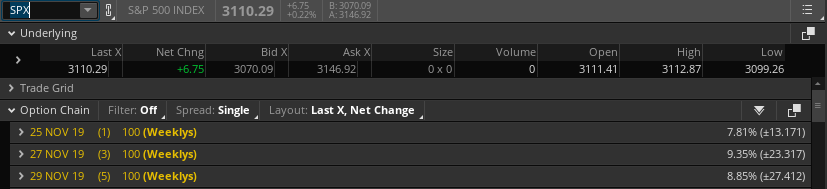
So while we’ll log the Hindenburg Omen in our memory bank for now, to see if it does in fact foster some trouble in the weeks and months ahead, we’ll also look toward the options market to find the weekly expected move. There was little action and volume in the markets this past trading week and that should be the expectation for the shortened trading week to come. With that, the S&P 500 managed to stay within a tight trading range this past week and within the weekly expected move of $32/points. For the week ahead, the weekly expected move is $27/points.
The U.S. economy remains in record-setting territory, entering its 125th month of expansion on Nov. 1, 2019. The pace of real GDP growth has slowed from a 3.1% annual rate in the first quarter to a 2% growth rate in the second quarter, and then to a 1.9% growth rate in the third quarter. But there are few signs that the expansion is on its last legs. Indeed, if anything, the current growth rate is consistent with the economy’s potential rate of growth—which most economists estimate to be between 1.75% and 2%.
It’s going to be a really festive, but condensed trading and economic data release week for investors and traders alike. Wednesday is jam-packed with economic data, as holiday shoppers will aim to steal the spotlight from the data to some degree. Most of the data to be released on Wednesday will identify the strength or weakness of the economy and its well-positioned consumer.
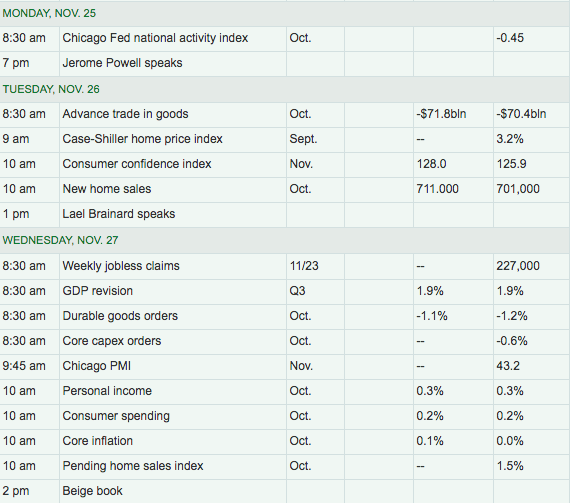
On Tuesday, Conference Board’s Consumer Confidence Index is expected to show a rise from the month of October into November. New home sales are also set for release on Tuesday and also expected to rise from the September to October period. With mortgage rates down more than a full percentage point YoY, and affordability for homes having improved recently, the housing sector has shown itself to produce a strong rebound from 2018 and through 2019.
- Housing affordability conditions improved in September 2019 compared to last month and a year ago, according to NAR’s Housing Affordability Index. Even as housing prices continued to increase, affordability improved due to lower mortgage rates. The effective 30-year fixed mortgage rate1 declined to 3.65% this September from 4.77% a year ago.
- Nationally, mortgage rates were down 112 basis points from one year ago (one percentage point equals 100 basis points). The median sales price for a single-family home sold in September in the US was $275,100, up 6.1% from a year ago, while median family incomes rose 3.5 % in 2019 from one year ago.
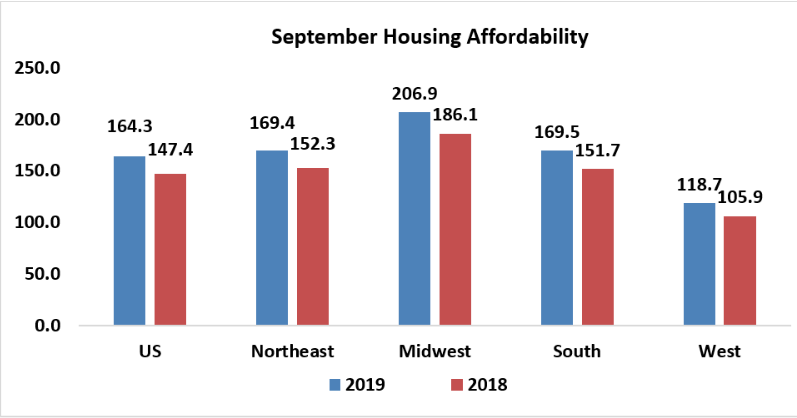
Finom Group is expecting the strong housing data that has prevailed since the spring of 2019 to continue through year’s end. But everyone is likely anticipating the data deluge to come on Wednesday. This data deluge will tell us what really want and need to know about the U.S. consumer-driven economy.
“The focus on consumers is intensifying for two reasons: One, economic growth is particularly dependent on them at present. As the accompanying figure illustrates, there has been little expansion of economic activity outside of consumer spending in recent quarters. Two, consumers have shown signs of diminished momentum of late.”
–Bloomberg Economics’ Carl Riccadonna, Yelena Shulyatyeva, Andrew Husby and Eliza Winger
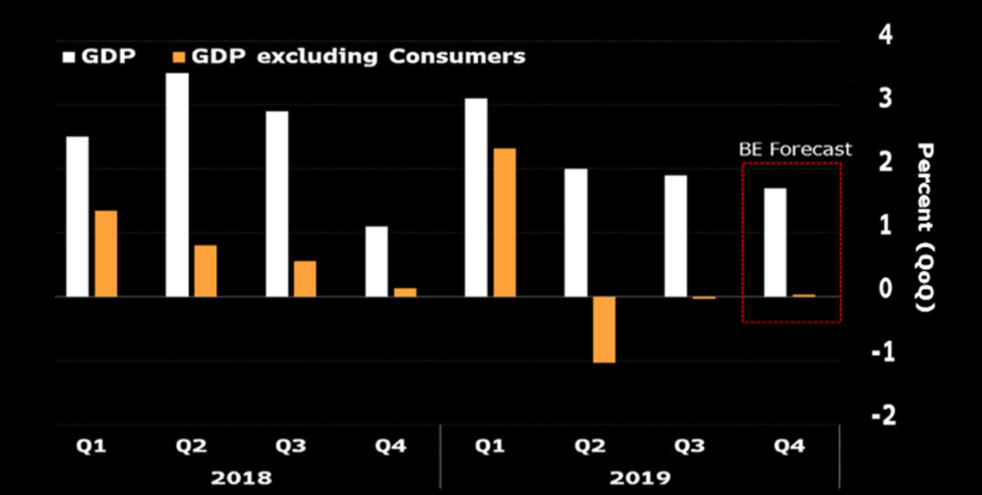
On Wednesday, investors will receive the revisions, if any, to Q3 2019 GDP. At present, economists aren’t anticipating a change to the initially reported 1.9% Q3 GDP print last month. More importantly alongside the Q3 GDP update will come the latest Personal Income and Expenditures data or PCE. This will give investors a look at real consumer spending for the month of October. Within the PCE data investors will also get a peak at the habits of consumers and balance sheet by way of the change in the Personal Savings rate. The rate recently ticked higher up to 8.3 in September from 8.1 in August.
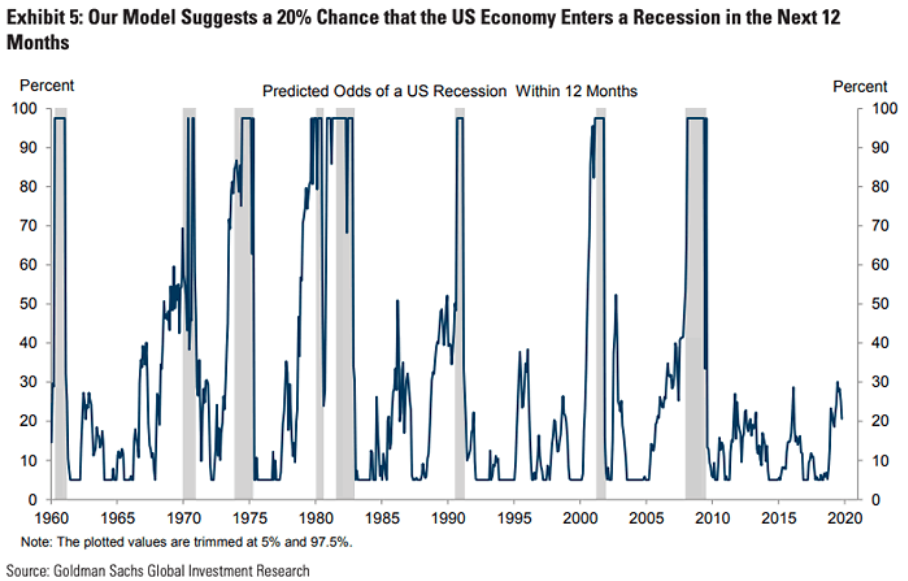
Where once the year had been plagued with recession fears, those fears have been abating in the second half of the year. This chart from Goldman Sachs suggests that the odds of a U.S. recession within the next 12 months has decreased to just 20 percent.
But Goldman Sachs isn’t the only firm who thinks recession odds should abate. Barclays’ Michael Gapen warns it’s too early to give the U.S. economy the all-clear, but pegs a U.S. recession over the next 12 months at just 20% odds.
“The deceleration in manufacturing seems to be abating. That’s the good news. The bad news in that report is the services side of the economy seems a little weaker than expected.”
In any given year, Gapen estimates there’s a 10% chance of a recession. If Washington and Beijing can agree to a trade deal, he suggests 2020 could see a more normalized risk because it would give U.S. businesses more confidence to start spending again.
“We need to get some sort of ‘phase one’ agreement done even if it’s narrow. What the market and economy needs to know is we’ve hit peak tariffs and they’re likely to come lower. So momentum on that front has stalled out a bit. I still think on balance the comments around U.S. trade discussions are positive.”
One could argue that despite the more than 24% surge in the S&P 500 in 2019, it’s still somewhat of a throwaway year for the economy and even investors. Most investors haven’t felt confident enough to leverage their accounts in favor of equities, missing much of the 11-month long rally. It’s quite rare to see record highs in the S&P 500 , yet margin debt falling.
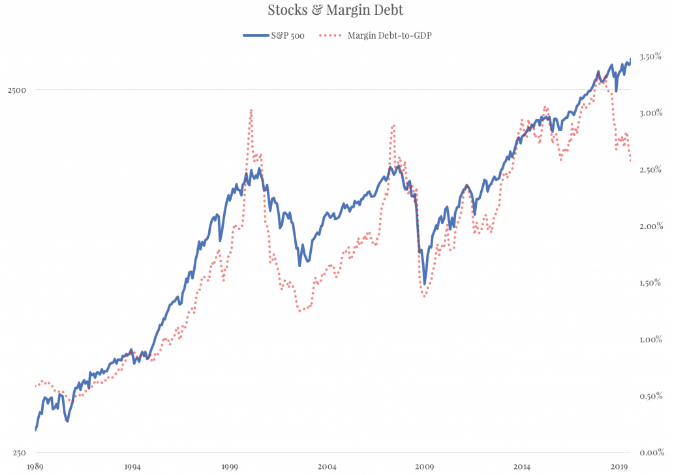
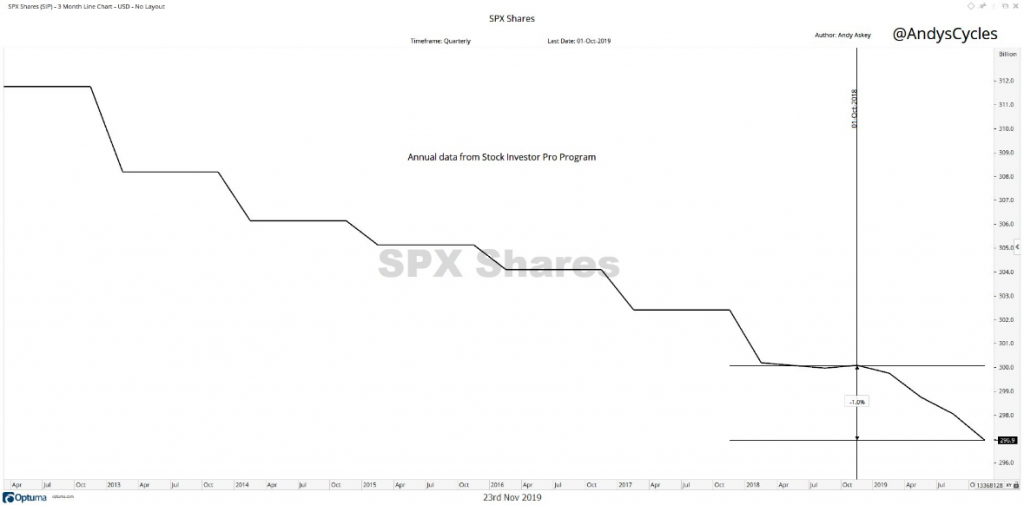
Margin debt hit a high last year, and while the S&P 500 recently hit new highs, margin debt relative to GDP recently fell below its lows from late last year. This suggests that investor risk appetites, after soaring to a euphoric extreme in 2018, are simply not supportive of stock prices in a broad sense in 2019. But who needs investor risk appetite when corporate buybacks remain at record levels and the S&P 500 float continuing to shrink YoY. The number of shares outstanding for the S&P 500 is down 1% from last October. The pie continues to shrink as they say.
Moreover, corporate earnings are now expected to decline for the full year in 2019, something that hasn’t been seen since 2016. For the Q3 2019 period, FactSet anticipates earnings will have declined by 2.3% and for Q4 earnings are forecasted to decline by 1.5% YoY. While this may seem a negative development, it’s important for investors to put the earnings decline in perspective. The period from Q3 2015-Q3 2016 saw a much steeper earnings decline than what will take place in 2019.
Coming off a year of double-digit earnings growth from 2014, the comps proved difficult in 2015. Sound familiar? But look at what happened after the 2015-2016 earnings recession! When the comps became easier, earnings grew double-digits once again. The multiple expansion that began in 2016 was foreshadowing a return of earnings growth in 2017. Again, sound familiar?
Three-fourths of earnings recessions since World War II have morphed into economic recessions, said CFRA Chief Investment Strategist Sam Stovall. The 2015-2016 earnings recession did not morph into an economic recession and unless the trade dispute runs off-track in a material manner, with more tariffs imposed, the current earnings recession is unlikely to express an economic recession. But investors need to keep a watchful eye on the EPS outlook for the Q4 and FY2020 period as both have been moderating lower, with the S&P 500 hitting new record highs. While the multiple on the S&P 500 can continue to expand, at some point investors will need to some of their hopes turn to reality or satisfied by earnings growth and trade resolution.
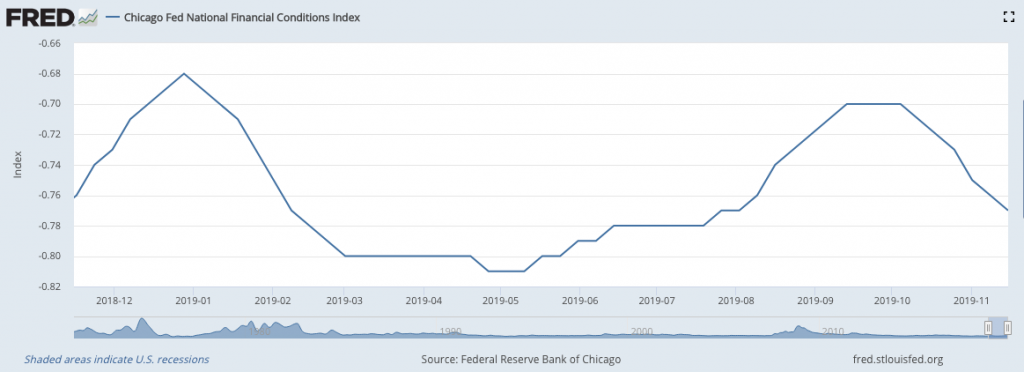
The Fed can only do so much to support economic activity. Since deciding to expand its balance sheet once again, as an effort to satisfy the REPO market, the Fed’s balance sheet has swelled by $286 billion since early September, to $4.05 trillion. The liquidity boost from the Fed has had a profound affect on financial conditions. The YoY chart of the NFCI identifies just how much looser/easier financial conditions are in Q4 2019 versus the same period a year ago.
Keep in mind that the Fed’s shot of liquidity and bond purchasing activity also naturally produces lower rates, or unnaturally if you prefer. Fed liquidity is making it easier for companies to borrow cash that can be used for share buybacks. Those share repurchases help boost demand for stocks while simultaneously boosting per-share earnings. The permabears absolutely hate this recursive loop.
The Fed’s bond buying activity serves to reduce returns on short-term government bonds, making stocks look more attractive by comparison.
“That is pushing investors with short-term horizons towards the stock market,” said Philip Marey, senior U.S. strategist at Rabobank. “It is contributing to a stronger stock market.”
If the whole of the weight of the economy is to be placed on the back of the Fed for the foreseeable future, “Houston, we got a problem”. Economic policy is still at the forefront of the woes of the U.S. and global economy. The nearly 18-month trade war demands conciliatory and positive resolution near-term or business investment will continue to moderate lower and eventually pervade other areas of the economy, resulting in below trend-growth. It behooves both China and the U.S. to put aside the big ticket items in favor of a skinny deal of sorts over the next few months. Anything less than this outcome, and the Fed may find itself cutting rates in 2020, sooner than even they expected. With that being said, we’ll see what Fed chairman Jerome Powell has to say about the economic outlook in a speech Monday evening.


