
Another record setting day on Wall Street to start a holiday shortened trading week. The Dow (DJIA) ended the day above its previous closing high of 28,036.22 set Nov. 18, the S&P 500 (SPX) surpassed its previous closing record of 8,570.66 set on Nov. 19, while the Nasdaq (NDX) finished the session above its last closing high of 3,122.03 set on Nov. 18. All three benchmarks also set new intraday highs on Monday. The rally on Wall Street was once again positioned for better trade headlines that surfaced over the weekend. Contributing to the positive tone on Monday, the Chinese government on Sunday also released a document calling for more protection of intellectual-property rights, something the White House Administration had been pushing as part of a trade deal.
The S&P 500’s record setting Monday marked the large-cap benchmark’s 9th record close in November, surpassing the 8 record closes seen in July for the most in a single month since January 2018, when it scored 14 all-time high finishes, according to Dow Jones Market Data. It also marked the most record closes for the month of November since 2014, when it scored 12. The record setting month of November isn’t anything we should take with surprise; this is actually typical for Novembers. Remember from our Research Report issued on November 3, 2019 where we discussed the record setting month of November probabilities as follows:
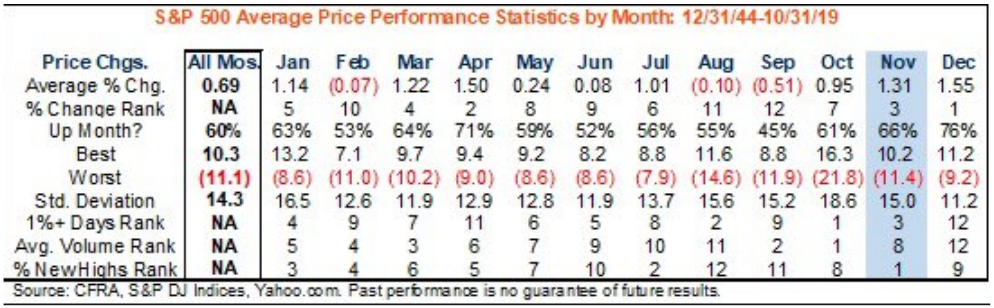
“And why not, remember we have entered the best time to own stocks, from November to April. In fact, November has recorded the greatest percentage of new all-time highs since WWII.”
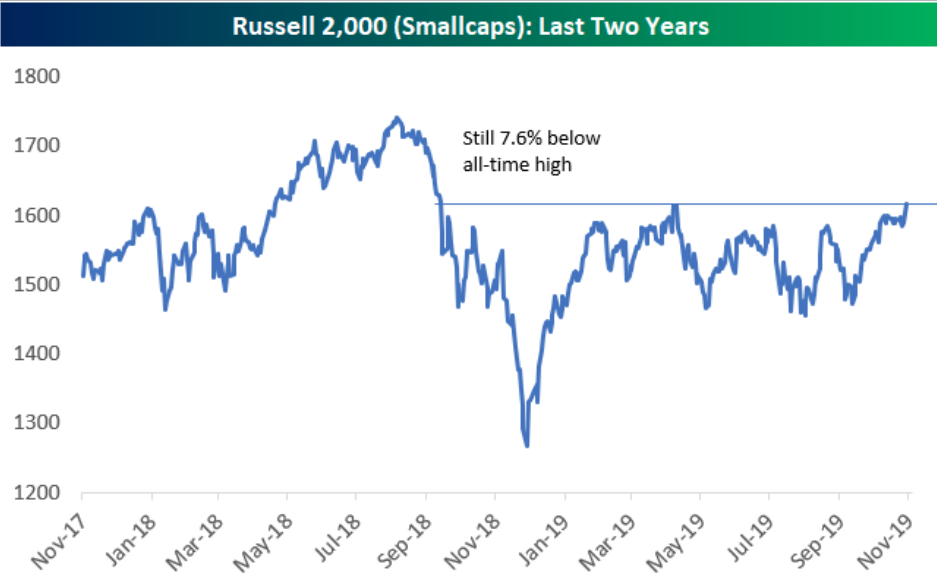
And least we not forget about the small cap Russell 2000 (RUT) hitting a 52-week high on Monday, outperforming its peers with a greater than 2% rally on the day. The Russell 2000 closed at 1,621.90, a 2.09% gain, and the highest close since Oct. 9, 2018.
“The dynamics of this market are changing. The definition of this new uptrend that’s developing is that pullbacks should be shallower and shorter lived and and the upswings should be stronger,” said Ari Wald, technical strategist at Oppenheimer. “I think this is a market where global equities are breaking out across the board. It’s not just the U.S. large cap growth anymore. It’s U.S. broadly, and now small caps, a big breakout in the Russell 2000 today. You really have a market that is firing on all cylinders.”
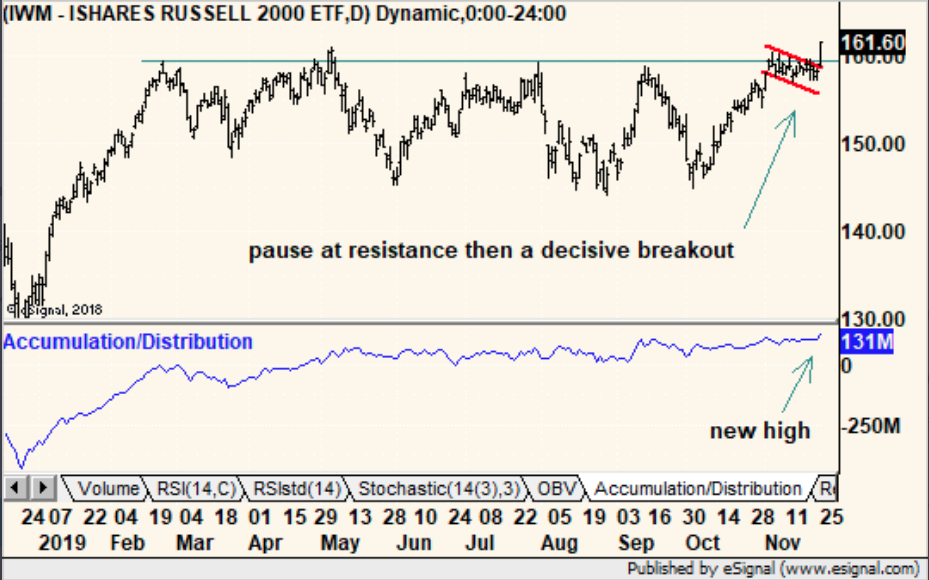
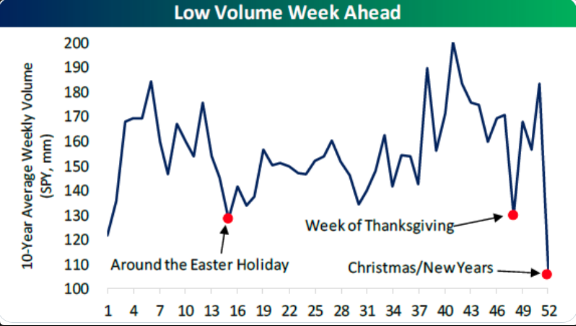
The market rally rather sharply across all indices on Monday and it’s nice to see the Russell 2000 play catch-up and hopefully breakout. The small-cap index will need to hold these gains and push higher near-term to solidify the breakout. Additionally, we understand that the rally in all indices Monday came on light volume. But this is to be expected given the holiday period, as shown in the seasonal volume patter from Bespoke Investment Group below:
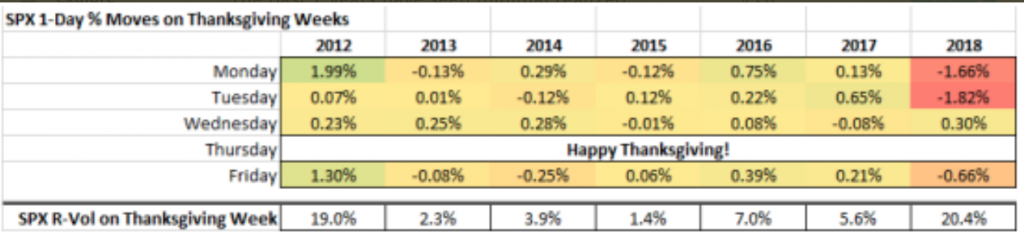
Another way in which we can anticipate market activity is by way of market volatility, or lack there of on a seasonal basis. The past 7 years have seen minimal realized volatility during Thanksgiving week, shy of 2018 and 2012. The options team at Cornerstone Macro Research expects this year to mirror the 2013-2017 range where the SPX was fairly quiet. (See table below)
The seasonal trend is in keeping with what the team at Schaeffer Research recently found by way of certain put/call ratios earlier this month. After its recent peak above 1.00, the Options Clearing Corporation (OCC) all-exchange, equity-only 10-day option volume put/call ratio has swung to yet another extreme — this time, on the low end of the spectrum. The ratio checked in at 0.73 on Nov. 15, hitting its lowest point since late September 2018.
At the same time, the OCC all-exchange, all-volume 10-day put/call volume ratio has also been plummeting. This metric matched its equity-only counterpart’s aforementioned low with a 0.757 nadir — and in fact, both of these put/call ratios have since remained below 0.80 for at least 10 consecutive days, an occurrence which last took place in November 2017.
“Taken together, the sharp, simultaneous skid lower in these two put/call ratios point to a sudden shift away from puts and toward calls — and from a sentiment perspective, that’s signaling potential giddiness in the options market.“
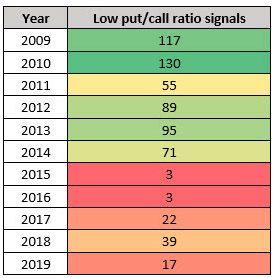
These two put/call ratio readings being as low as they are is a great statistic which underscores the low-level implied volatility and realized volatility regime over the last 2 months. But what does it portend for the market’s future returns? The below table summarizes instances since 2009 whereby both the OCC equity-only and all-volume put/call ratios were below 0.80, as they are now. This was a much more common occurrence in 2009 and 2010; there are hundreds of signals in those years, compared to just two or three dozen apiece in 2017 and 2018.
Looking back over this past decade’s worth of data, Schaeffer Research found that S&P 500 returns after a low-ratio signal tend to underperform “anytime” returns as far out as a year, albeit by a relatively modest margin. For example, the average two-month S&P return since 2009 is 2.2%, but it falls to 1.8% after a low put/call ratio signal. One year after a signal, the S&P is up 10.8%, on average, compared to its at-any-time 12-month gain of 12.3%.
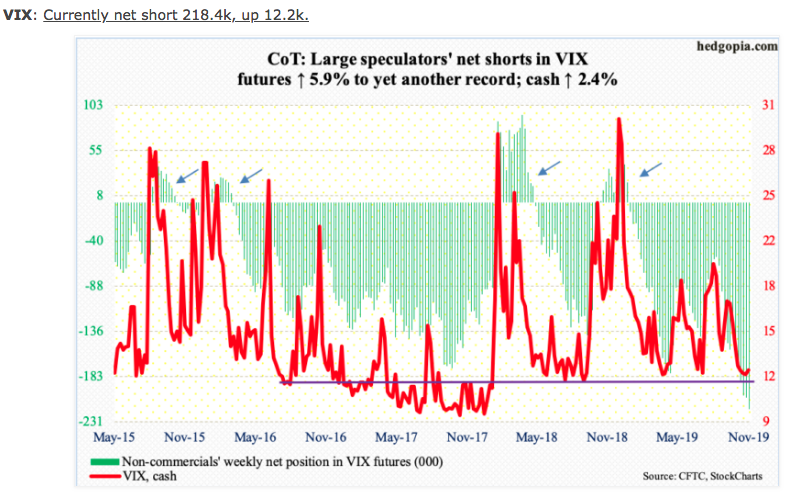
Given the aforementioned seasonal volume, record setting benchmark index levels and low put/call ratio readings, it’s no wonder that we finally witnessed the VIX also close at its lowest level for 2019 and its lowest level since October of 2018. This as hedge funds continue to press their bets for a 5th consecutive week by shorting VIX futures to record setting levels.
What’s not often understood about this record setting VIX Futures short positioning among hedge funds is that the biggest VIX Future short positions, held in the “Leveraged Funds” category (hedge funds, etc), is currently considerably lower than in 2017.
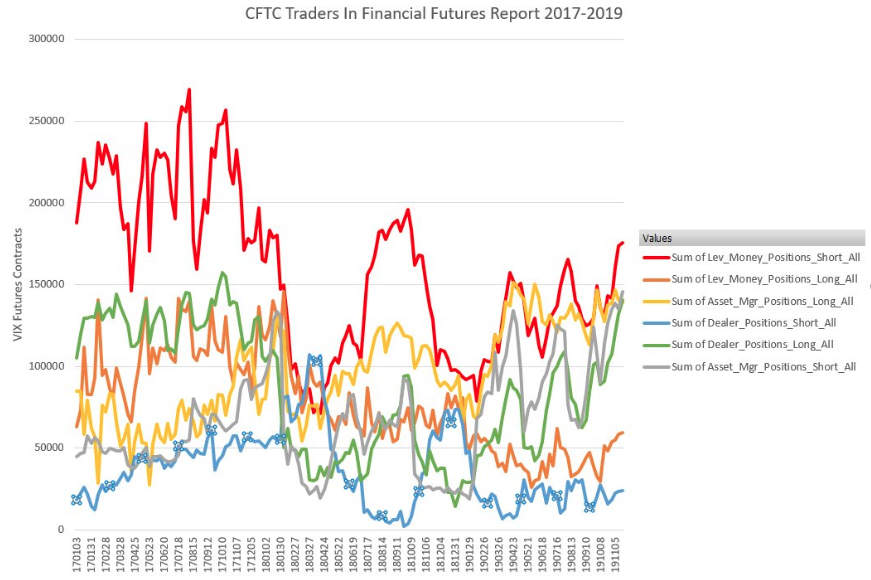
For more details on how the CFTC reports TFF positions on a weekly basis, click the link here . As always, Finom Group is not suggesting the lesser hedge fund positioning when compared to 2017 would prevent a VIX spike of consequence to many short positions, but rather a Volmaggedon-like event is rather improbable without some other major exogenous event taking place.
The trading week was kicked-off with favorable trade headline sentiment that has seemingly found similar headline sentiment on Tuesday. The S&P 500 closed at 3,133 on Monday after positive headlines. With Tuesday’s headline, who knows where the market will end the day! The leaders of the U.S./China trade negotiations held another phone call on Tuesday morning, China’s Ministry of Commerce said in an online statement.
“Both sides discussed resolving core issues of common concern, reached consensus on how to resolve related problems (and) agreed to stay in contact over remaining issues for a phase one agreement.
Here’s where Wall Street thinks it’ll end next year, according to forecasts that have been released so far:
- Morgan Stanley: 3000
- UBS: 3000
- Stifel: 3100
- BMO: 3400
- Goldman Sachs: 3400
- Credit Suisse: 3425
J.P. Morgan (JPM) analysts said 2020 could be the year of the “great rotation”, retail investors abruptly shifting away from bond funds to buying equity funds, last seen in 2013. Analysts at the firm said the “extremely cautious stance” of retail investors this year had been puzzling and acted as a drag for equity markets.
“Years of high bond flows, such as 2012 and 2017 — and now 2019 — have typically been followed by weak bond fund flows the following year.
JP Morgan analyst Nikolaos Panigirtzoglou said: “Given this year proved to be a strong year for equity markets, helped by institutional investors, then we should see retail investors responding to this year’s equity market strength by turning [into] big buyers of equity funds in 2020. This suggests 2020 could be another strong year for equities driven by retail rather than institutional investors.”
He accepted this call faced “a major challenge” from already elevated retail investor equity positions but said that it was justified by cash and bond yields being significantly less than before following central bank rate cuts.
Switching gears for the moment, we remind investors that the economic data calendar is very much compacted into a data deluge day that lay ahead on Wednesday. On Tuesday, however, investors will get the latest reading on Consumer Confidence, which is expected to have improved from September through October. In addition to the latest reading on consumer confidence, New home sales data will be released at 10:00 a.m. EST Tuesday. Housing sector data has been strong since the spring months and is anticipated to remain strong into the first half of 2020. Home purchases have a multiplier affect when it comes to consumption, as home buyers acquire more stuff to go into these homes. With that being said, last week’s release of Existing home sales proved another strong month for home buying.
October existing home sales increased sequentially. Sales were up from 5.36 million to 5.46 million. Last month’s report had a 2.5% monthly decline and a 3.5% yearly increase. This latest report produced a 1.9% monthly gain and 4.6% annual growth. Existing sales in October were the 3rd highest of 2019. The yearly comps will be getting easier which means double-digit growth could be around the corner. As we can see from the chart below, sales in November, December, and January were 5.21 million, 5 million, and 4.93 million.
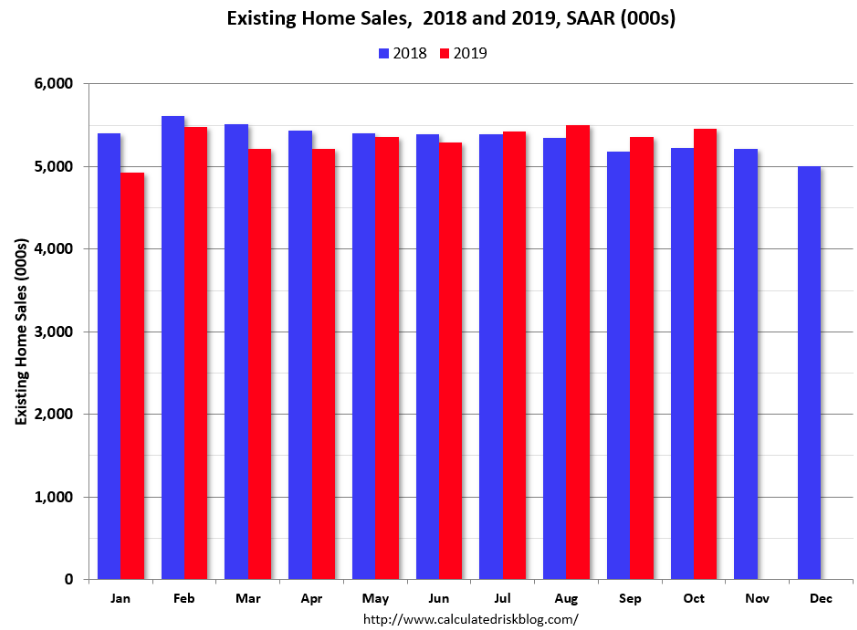
The labor market remains strong and interest rates are low, but inventory is becoming constrained and consumers say prices aren’t as affordable as they were coming into 2019. There were only 3.9 months of inventories which was down from 4.3 months last year. The market is balanced when there is 6 months of inventory which means this is a sellers’ market. This supply imbalance explains why price growth was high. The median sales price of existing homes was up 6.2% to $270,900. Single family sales were up 2.1% to 4.87 million (yearly growth 5.4%). Yearly median single family prices rose 6.2% to $273,600.
While it may appear that the prices are higher, and they are, the average household has done an extremely sound job of improving their balance sheet over the last decade. The average household has increased their savings rate throughout the current expansion cycle, a rather anomalistic finding from the governments own data. Usually, households are drawing down the savings rate through an expansion period. Additionally, the savings rate has historically followed bond yield trends. But that all changed after the Great Financial Crisis according to the study performed by DataTrek.
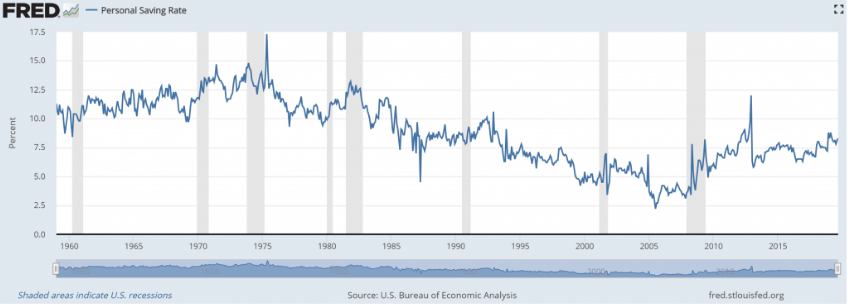
- From 1959 to 2007, US savings rates broadly followed interest rates.
- During the period when rates rose (1959 – 1981) so did the percentage of consumer’s disposable income that went into savings (i.e. not spent).
- When rates declined (1982 – 2007), savings rates fell. From the 10% – 15% of disposable income saved during the period of rising rates, the savings rate fell to a trough of 2.2% in mid 2005.
- The Great Recession-and-after period (2008 – present) breaks the connection between interest rates and savings. Savings rates have generally risen, and now stand at 8.3% – the same level as the late 1980s when 2-year Treasuries yielded over 5% rather than today’s 1.6%.
Here is how DataTrek explains the anomaly being shaped amongst consumers and/or households: American savings rates are structurally higher right now than at any point since the early 1990s, and it’s not because interest rates are better (the old relationship) but likely due to a variety of new factors:
- An aging population, with a higher propensity to save rather than spend.
- A younger generation (millennials) that despite their reputation are actually saving what they can and deferring consumption.
- Broad concern about the state of the U.S. economy being late in the current cycle.
- While overall savings rates may be higher, the aggregate data may simply reflect incremental propensity to save among higher income households.
For the better part of the last couple of years, Finom Group has been identifying the various ways in which “this time is different”. It’s the dreaded phrase that gets ridiculed by market participants who lay claim to the human condition and behavioral paradigms that tend to repeat, as nothing more than heresy. The reality, however, is that every economic cycle is different. The Personal Savings rate data is just another evidenced example of how this cycle differs from those in the past.
An update on the Personal Savings rate will be released alongside Consumer Spending and Personal Income data (PCE) come Wednesday.
We are now just 2 short days away from Thanksgiving Day and “Black ThursFriday“. With that in mind, we can’t help but to expect and/or anticipate all the media attention that will be cast on the retail and consumer discretionary stocks in the market. Although the consumer spending and retail sales data has remained healthy in 2019, that hasn’t been the case for the Consumer Discretionary stocks, which have been lagging the market in a major way more recently. One way to view this underperformance is in the rolling 20-day performance of the S&P 500 versus the Consumer Discretionary sector (XLY). As of last week, for example, the S&P 500 was up 4.1% over the trailing 20-trading days whereas the XLY was down over 1 percent. That wide of a performance gap over such a short duration has not existed in this bull market cycle until now.
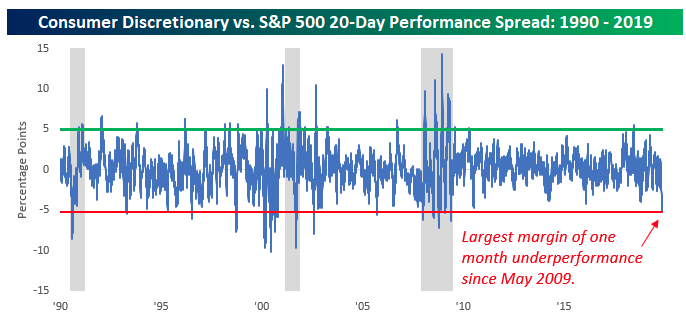
The chart above (from Bespoke Investment Group) shows the rolling 20-day performance spread between the XLY and the S&P 500. Last week’s plunge in this reading took it below -5% for the first time since coming out of the recession in May 2009! What the chart also identifies is a possible trough in the SPX:XLY performance ratio near-term.
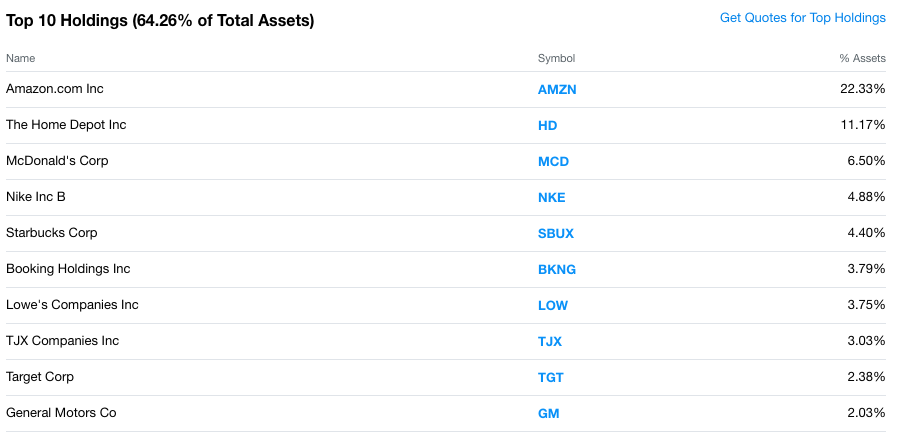
Finom Group believes the XLY is setting up for outperformance in the early parts of 2020, having been weighed down more recently by Amazon (AMZN) and Home Depot (HD) shares, which constitute the largest weighting in the ETF.
And if you’r wondering what one of the hottest product categories will prove to be come this Black ThursFriday, it’s likely to be wireless headphones once again. (Google Trends chart below)
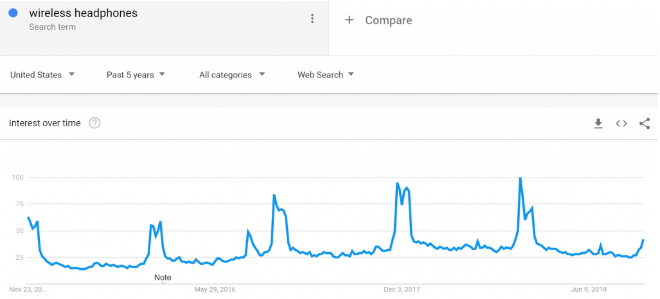
- Searches for “wireless headphones” continue to best prior year highs in November of each year, reaching its highest level so far in November 2018.
- Searches for Apple’s “AirPods” just hit an all-time high this past October with the arrival of Apple AirPods Pro.
As such, it should come as no surprise that Amazon just came out with a cheaper offering, called Echo Buds. Now those visiting Amazon for wireless headphones will see both AirPods and Echo Buds; they’re not much different except that the latter comes at a more competitive price point.
In closing, yea, we get it! Market is at all-time highs, we saw 6 consecutive weekly gains before a slight drawdown last week, so how much higher can we possibly go near-term and in 2020. Let’s take a look at what the historic data suggests for this query, shall we? (Chris Ciovacco table)
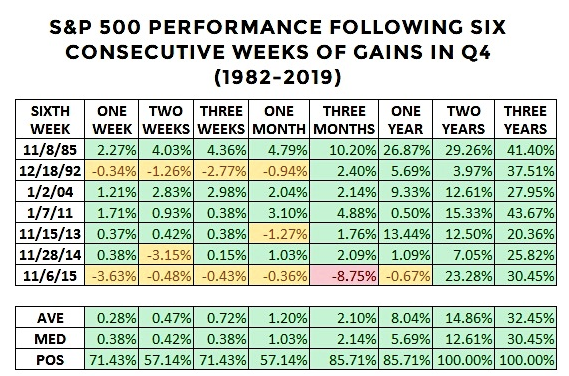
As shown in the table above, stocks were higher one year later in 86% of the cases posting an average gain of 8% returns. Two and five years later, the S&P 500 was higher in every case. The yellow and red portions of the table, however, remind us to have realistic expectations about potential volatility over the next three months. We may not go up in a straight line, but the probabilities look quite strong for further gains in 2020 and beyond.


