
Upon waking up Wednesday morning you might see something you haven’t seen in the past 29 days with regards to the VIX and the VIX Futures Term Structure. In the 5:00 a.m. EST hour, U.S. equities are pointing to a 1% move higher with the Dow Futures up some 240 points. The VIX is under severe pressure, down nearly 13.5% to 17.23 percent in the premarket. Now let’s look at VIX Futures Term Structure…
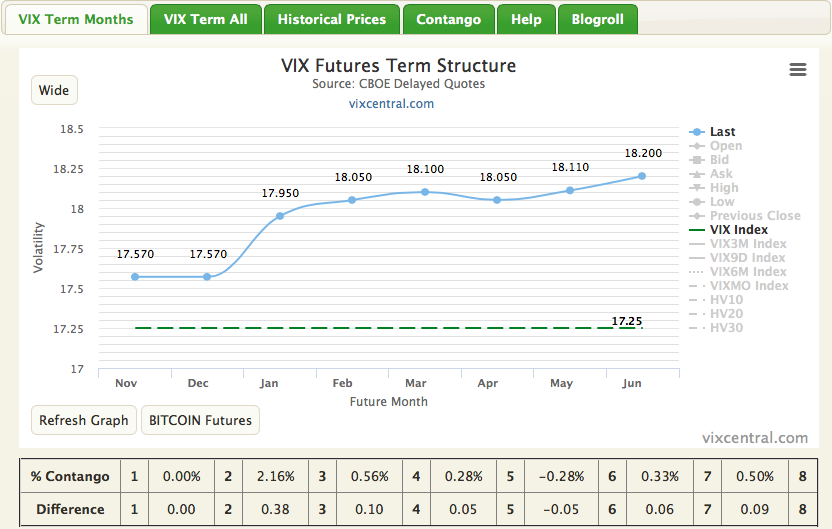
As displayed in the chart, VIX Futures are flat on M1/November and have eliminated the status of backwardation. M2 is now found with modest contango, just above 2 percent. For those investors/traders participating within the VIX complex of derivatives (VIX-Exchange Traded Products), M2 is the main driving force behind the movement of the derivatives given the calendar cycle of VIX futures. Why is M2 the main driving force due to the calendar cycle? The reason is because the VIX-Exchange Traded Products are always selling the front month contract and buying back month contracts for each calendar day that passes and up to VIX Futures expiration (typically 27-30 day VIX Future cycle). With M1 VIX Futures expiration date of 11/21/2018, the VIX-Exchange Traded Products (UVXY, TVIX) are holding a majority of M2 contracts versus M1 contracts. So all eyes should be on M2 going forward and leading up to VIX Futures expiration day. At that point, M1 will roll off the board and M2 will roll forward and become the new M1 or front month contract. All other VIX Futures months will also roll forward. Now that we’ve tackled the VIX segment of the early market movement for Wednesday, let’s see what else is out there and the driving cause of Wednesday’s favor for equities.
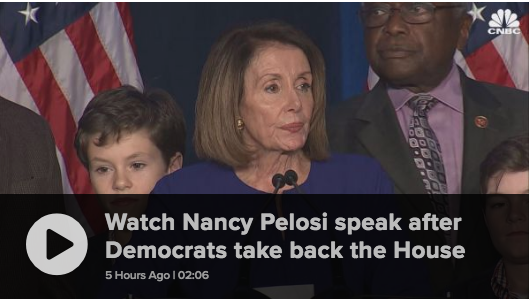
Tuesday night was the highly anticipated midterm election vote and Wednesday morning finds the world waking up to a House of Representatives that has been flipped from Republican control to Democrat control. The victory will put Democrats in control of the House for the first time since 2010 and likely return House Minority Leader Nancy Pelosi to the office of speaker. The victory came even as Republicans were projected to keep control of the Senate, according to NBC.
With midterm elections now completed, one less uncertainty remains for investors to contemplate in the final months of the calendar year. Markets have historically performed very well post-midterm elections. In each of the last 18 midterm election years, the market moved higher thereafter and held its gains into the following year. For those who desire to understand how the new House leadership might affect trade policy, a lingering concern, there is likely very little to change on that front.
When it comes to trade policy, one of the areas most relevant for the international community, President Trump enjoys executive power and can set the terms regardless of whether Congress is divided or not. That’s because “Congress doesn’t have much of an ability to control trade policy,” analysts at RBC Capital Markets wrote in a recent note. Rather, “the Oval Office has wide reaching powers to act unilaterally,” which means the president is likely to “keep pushing his trade agenda,” they continued.
The market still has another hurdle that lay ahead for the week with regards to the FOMC statement that is set to be delivered on Thursday and after the conclusion of its 2-day meeting. No rate hike is expected for this meeting, but the statement could go a long way toward determining the market’s ability to maintain the recent rally and bullish sentiment since the October correction. Most economists and analysts expect the Fed to suggest the economy is healthy and continuing on a strong growth path with inflation targets in-check, showing neither deflation nor breakaway inflation. Ahead of the Fed’s statement, yields are lower on Wednesday with the benchmark 10-year Treasury yielding 3.182 percent.
Economic data continues to come in strong during the 4th quarter of 2018. The number of job openings in the U.S. fell in September just a month after setting an all-time high, but companies are still scurrying to find workers and offering higher pay and benefits to attract them.
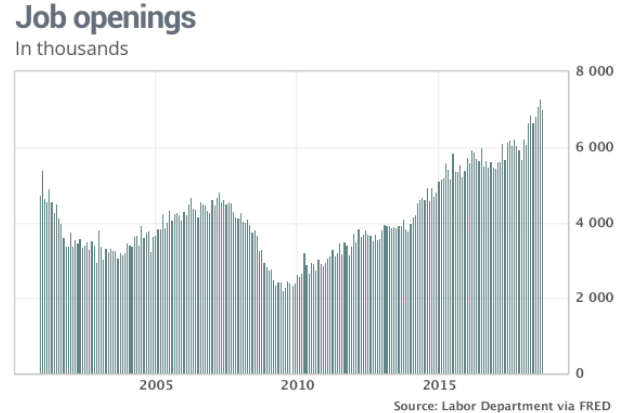
According to the latest JOLTS survey, job openings slipped to 7 million on the last day of September from a record 7.3 million in August, dating to when the government first began keeping track in 2000. About 5.7 million people were hired and 5.7 million lost their jobs in September, the Labor Department reported Tuesday.
Moreover, this is the strongest labor market that the country has experienced in decades. It is powering a U.S. economy that’s likely to set a record for the longest expansion ever by 2019. The unemployment rate recently fell to a 48-year low of 3.7 percent. The more citizens employed has been lending itself to a 3%+ GDP in the Q3 period and consumer spending of roughly 3 percent. When considering the JOLTS report and the equity market correlation, here is what we come to find.
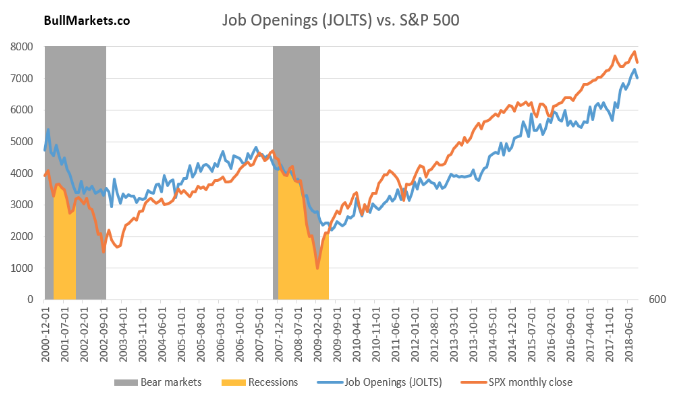
The JOLTS report is a leading indicator for the stock market and economy. The following chart demonstrates the positive correlation between JOLTS and the S&P 500. An uptrend in JOLTS equals an uptrend in the S&P 500. (chart from Troy Bombardia)
The strength that lay within the economic data is mirrored in the strength of corporate earnings which are now slated to grow some 25% YOY in the 3rd Quarter reporting cycle. As earnings continue to roll-in, the estimates continue to be revised higher by data tracking firms such as FactSet and Thomson Reuters. It’s for this reason; Finom Group remains of the opinion the market will ultimately trend higher and align more favorably with the earnings trajectory. Historically and akin to the JOLTS/SPX correlation, markets follow earnings over time. Having said that, the concerns over “peak earnings” will continue to weigh on investors and pervade sentiment through year’s end, at least.
According to a recent article on CNBC, the rate of earnings growth is likely to deteriorate in 2019. In fact, this is largely expected by the analyst community and a natural evolution of a bull market cycle. 2019 is expected to yield a 9.3% earnings growth increase that, while still substantial, indicates a considerable slowdown when compared to 2018.
“Not surprisingly, investors also wonder if EPS peaks have historically coincided with equity price sell-offs,” Sam Stovall, chief investment strategist at CFRA, said in a note. “The unfortunate answer is yes.”
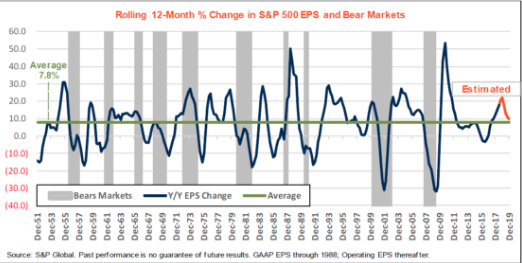
According to Sam Stovall and despite the rally from the recent correction, the market strategist sees further downside. The downside he believes could result in a total market correction, from the S&P 500 peak, of roughly 14 percent. The good news is that Stovall does not see an outright bear market, defined as a 20% drop, as is often the case with peak earnings.
“Indeed, we think the recent unpleasantness represents the readjustment in the anticipated angle of ascent in share prices over the coming year, due to increasingly challenging year-on-year GDP and EPS comparisons.”
As previously noted, an earnings slowdown is widely anticipated by all classes of the capital and equity market community; it’s a natural element of the market and when a market is presented with the laws of large numbers. Year-over-year comparisons simply become very difficult to match or exceed. Having said that, keep in mind this bull market, which is setting records for longevity, has surprised many if not most for its ability to exceed corporate earnings growth estimates in each of the previous 3 quarters. Additionally, much of the anticipated earnings growth slowdown forecasted for 2019 installs an escalation of tariff implementation and trade wars. Should anything more positive than the escalation of tariffs be found by year’s end, the forecast for corporate earnings in 2019 could also be found more favorable.
Wednesday’s early market optimism is a welcome sight for investors, but we wouldn’t get too complacent just yet, as the FOMC will take center stage on Thursday. What we do like seeing presently and with regards to investor sentiment is the relaxing of the put/call ratio that had been rather elevated only a week ago. It seems counterintuitive, but when the put/call ratio is elevated, it tends to be a bullish indicator, as it can only remain elevated (like the VIX) for so long and before it crashes. The Put/Call ratio’s 15-day moving average (3 weeks) has finally started to come down, as depicted in the chart below.

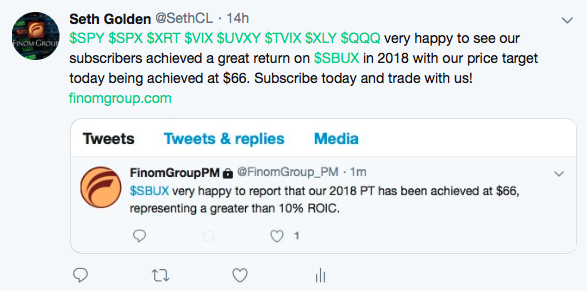
Finally, Finom Group recently announced its completed investment thesis in Starbucks Corporation (SBUX). On Tuesday, with the share price reaching $66, Finom Group’s price target had been achieved and our 10% profit goal had been achieved and then some. Our chief market strategist Seth Golden publically announced the achievement on Twitter Tuesday. Golden suggest the stock’s outperformance recently may be relegated to market performance going forward, but believes in the long-term investment thesis in the brand.
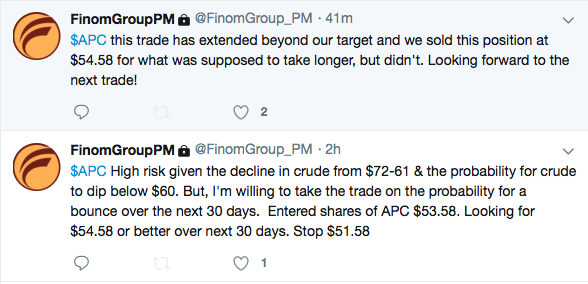
In addition to the long-term investment thesis in SBUX noted, Finom Group continues to trade the market daily/weekly. The market volatility has recently lent itself to a variety of swing trade and scalping opportunities and Tuesday proved to be no different. The following trade was offered to premium subscribers and in one of our favorite trading stocks, Anadarko Petroleum Corp. (APC).
To reiterate, the trading day has many hours to go and with equity futures pointing to a sharply higher open on Wall Street, this can afford investors the opportunity to extrapolate portfolio profits, rebalance and or reposition capital. Use opportunity wisely and profit profoundly!


