
We expect a good deal of market anxiety to persist throughout the trading day as the media surveys, polls and analytics suggests this or that may come to pass in today’s U.S. midterm elections. As we mentioned in our latest research report, the elevated VIX (20.27 as of Tuesday morning) and front month VIX futures contract remain stubbornly high even as the equity market has found stability and risen from its recent lows.

That front month contract (m1/November) is a perfect representation of the anxiety or fear represented in the current state of the market when compared to the back month (m2/December) contract, which assume less volatility in December. We would be of the opinion that post the midterm election results, the VIX futures curve will normalize. Uncertainty is not a valued state of affairs amongst investors and until the midterm election cycle uncertainties ease…
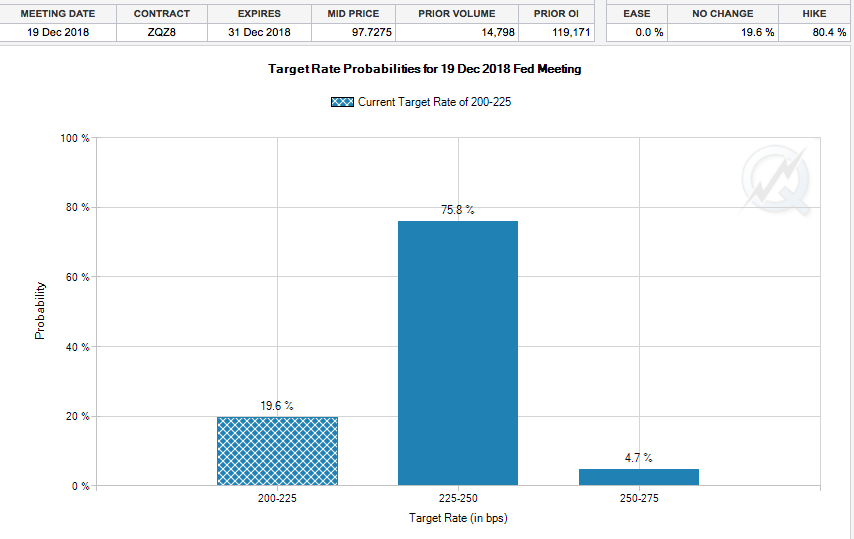
Looking beyond the midterm election vote that will end with final tallies Tuesday night, investors will also grapple with Thursday’s FOMC meeting. There is no rate hike expected for the November, 2-day meeting. A December rate hike is still very much anticipated by economists and investors alike. According to the CME’s FedWatch Tool, the probability of a December rate hike stands at roughly 75%, up from a recent low of 66 percent during the market correction in October.
Market participants will heavily scrutinize the Fed’s statement release at the culmination of the 2-day meeting. Many will look for any signs of change in verbiage that might indicate a future pause in rate hikes. Having said that, some analysts and economists believe the Fed must stay the course given the tightening labor market and wage inflation seen in the latest sets of economic data.
“Richard Moody, chief economist at Regions Financial Corp. in Birmingham, said, “Our view is that the FOMC is not, at least not yet, uncomfortable with the tightening in financial conditions brought about by lower equity prices.”
Overall, Fed watchers expect little change in the policy statement, expecting the central bank to repeat that economic activity “has been rising at a strong rate.” Additionally, many will be looking for any further insights into the Fed’s activity surrounding the unwinding of its balance sheet, which now stands at roughly $4.1trn, down from $4.5trn.
As the Fed is offloading its balance sheet, another super-sized round of Treasury note and bond auction are taking place this week. A record $83 billion in bonds will be auctioned in the current week and ahead of the FOMC meetings. Given the bond market moving events taking place this week, it’s likely that yields will head higher. We’ll just have to wait and see, with the 10-year yield flat on Monday, but hovering around 7-year highs.

Ahead of both the midterm elections, bond auctions of significance and the FOMC statement, equities rallied on Monday with the Dow (DJIA) 190 points and S&P 500 (SPX) up 15 points while the Nasdaq (NDX) was down 28 points. The tech-heavy Nasdaq has remained under pressures after the earnings reports from FAANG stocks that included the latest disappointing guidance from Apple Inc. (AAPL). The latest reporting from Apple has brought about a host of proclamations of the potential peak for the company and the stock’s performance. The current sentiment expressed over Apple’s business cycle, however, is nothing new. Back in May of 2016 and after the company reported declines through much of its product segments, the stock price dipped, ever so briefly, below $90 a share. Finom Group’s chief market strategist Seth Golden even wrote an article about the AAPL share price decline that very day titled “Apple Shares (Briefly) Drop Below $90”.
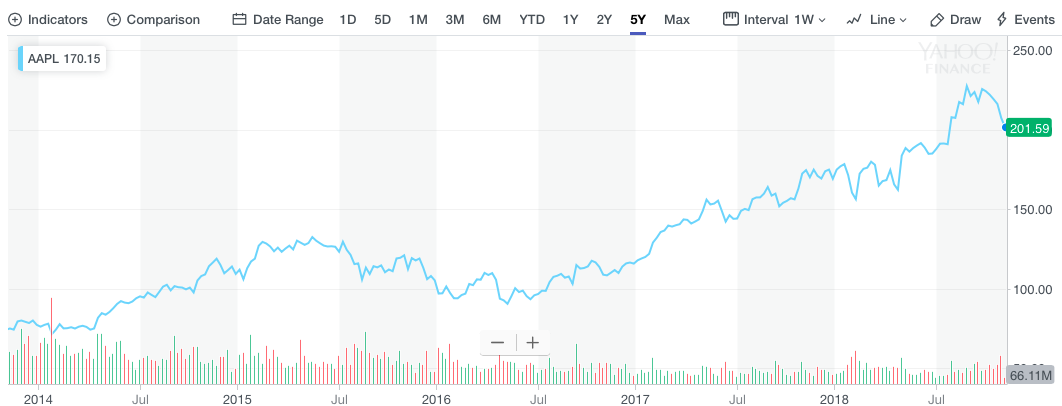
“As I mentioned in a previous article, AAPL would likely not rebound quickly. “The technical analysis noted within this article suggests investors should be cautious regarding their AAPL participation as shares may exhibit greater declines in the coming months, but that remains to be seen.” As technicals are a function of the fundamental business operations, AAPL shares are following the declining sales and earnings outlook for Apple. Today, shares of Apple broke through $90 and once again highlight the challenge Apple faces for future product cycles and against the backdrop of a slowing macro-environment whereby the consumer is spending less on discretionary goods.”
Shortly after shares of AAPL breached $90 a share, it based and found a nonstop share price trajectory to the upside and eventually found a $1trn market cap. What Golden learned from his coverage of the iPhone maker was that there is more to Apple than meets the eye. Unlike many brands, competition is front of mind and always a concern when it comes to pricing and margins. That is where Apple shines, as it has largely proven it can set whatever price it desires for its iPhone product line and the consumer will pay that price. It’s been that way since 2009 and that paradigm hasn’t abated. It’s the main reason Apple can actually sell fewer phones than a year ago and still grow handset sales. There are only a handful of brands and/or services out there in the market that have the pricing power that Apple has demonstrated. Facebook (FB) and Starbucks (SBUX) are just a couple examples of brands with tremendous pricing power. Even Netflix (NFLX), with its ever-growing user base, doesn’t have the pricing power that the aforementioned brands have. So when SBUX shares tumbled during the spring, this was of little concern as the brand staying and pricing power would find the share price eventually rebounding alongside its fundamental metric performance, which is largely based on demand for its products. The same happened with Apple back in 2016 and will likely occur again given the current share price deprecation period. The brand and pricing power are simply too strong to find sustainable share price depreciation absent an economic recession. And of course this is all before even mentioning the Warren Buffett-effect on the share price.
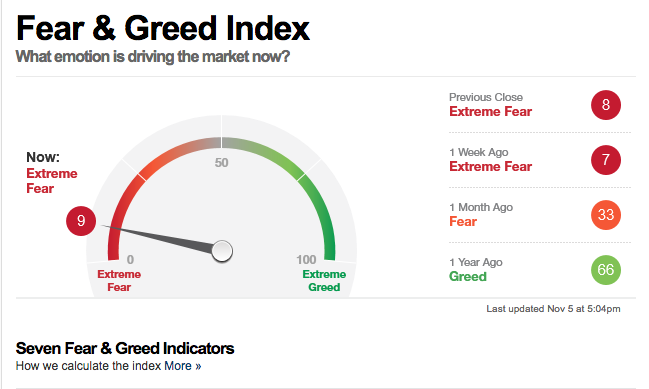
On Tuesday, we characterize the equity market as being in a state of limbo and during a week that is largely proving to be headline driven. The S&P 500 is up roughly 3% on the year, but well off of its highs, akin to its peer indices. Equity sentiment is also mixed at present, but trending more positively and off of a very low/bearish sentiment base. Having said that, a recent polling still finds overall bearishness in the market, especially with FAANG having proven out of favor this earnings season.
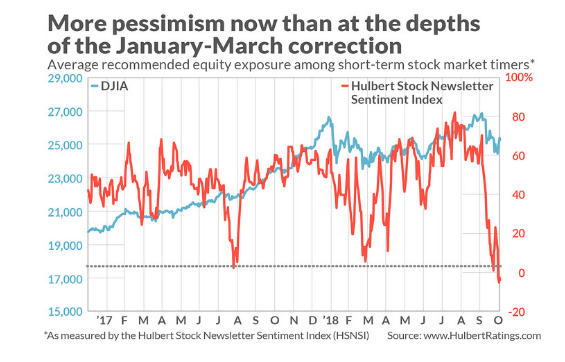
Even though the stock market today is more or less at the same level it was a month ago, the average market timer is significantly more bearish. That’s a good sign from a contrarian point of view, according to columnist Mark Hulbert.
“This increased pessimism is evident in both of the stock market sentiment indexes that I maintain. The first represents the average recommended equity exposure level among short-term market timers who focus on the Nasdaq market (as measured by the Hulbert Nasdaq Newsletter Sentiment Index, or HNNSI). On the occasion of my month-ago column, this average recommended exposure level was minus 25.9%, which means that the average Nasdaq-focused timer was allocating 25.9% of his equity portfolio to going short. Today, in contrast, with the market at essentially the same level as it was then, the HNNSI stands at minus 38.9%.”
Hulbert’s other sentiment indicator is the Hulbert Stock Newsletter Sentiment Index, or HSNSI. This index is less volatile, and rarely has it fallen into negative territory. In the last few trading sessions, however, the HSNSI has gone negative. In fact, it’s now more negative than at any time since the severe market correction (some say bear market) that bottomed in February 2016.
Sentiment indicators tend to be very good contrarian indicators. In other words, when sentiment is majority bearish, a likely bullish market reaction ensues. When sentiment is majority bearish, a likely bullish market reaction ensues. It’s important to note, however, that contrarian sentiment indicator analysis isn’t always right and is largely used for short-term market moves.
Given the numerous market moving events taking place this week, it’s no wonder that investor sentiment continues to come in unfavorably.
Furthermore and given Monday’s market rally, it does seem as though many investors are viewing sentiment as contrarian in nature. Nonetheless, warnings about future equity price declines continue to roll in. David Stockman warns a 40% stock market plunge is closing in on Wall Street. Here’s what the infamous market watcher had to say during a CNBC on-air interview recently.
“No one has outlawed recessions. We’re within a year or two of one. Fair value of the S&P going into the next recession is well below 2000, 1500, way below where we are today.
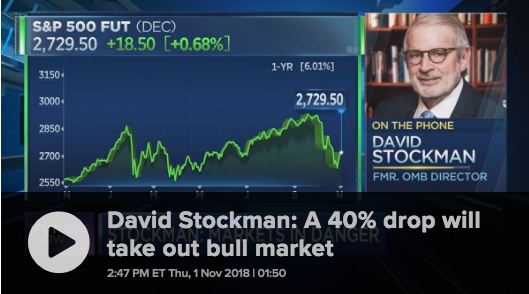
If you’re a rational investor, you need only two words in your vocabulary: Trump and sell. He’s playing with fire at the very top of an aging expansion.
He’s attacking the Fed for going too quick when it’s been dithering for eight years. The funds rate at 2.13 percent is still below inflation.”
In addition to the noted quotes from Stockman, he goes on to cite the irrationality of the ongoing trade war as a harbinger of the future recession and stock market plunge. While we agree with some of Stockman’s latest “rants” (mainly on the lack of inflation), we have to suggest the former President Reagan’s Office of Management and Budget director, rants to be viewed as “par for the Stockman course”. After all, Stockman has been suggesting an imminent market plunge as far back as we can remember. Fortunately, his track record is quite literally as bad as it gets and found even with SEC charges against his person. The following table/study is that of David Stockman’s market crash warnings on CNBC juxtaposed with forward returns of (SPY) over the years.
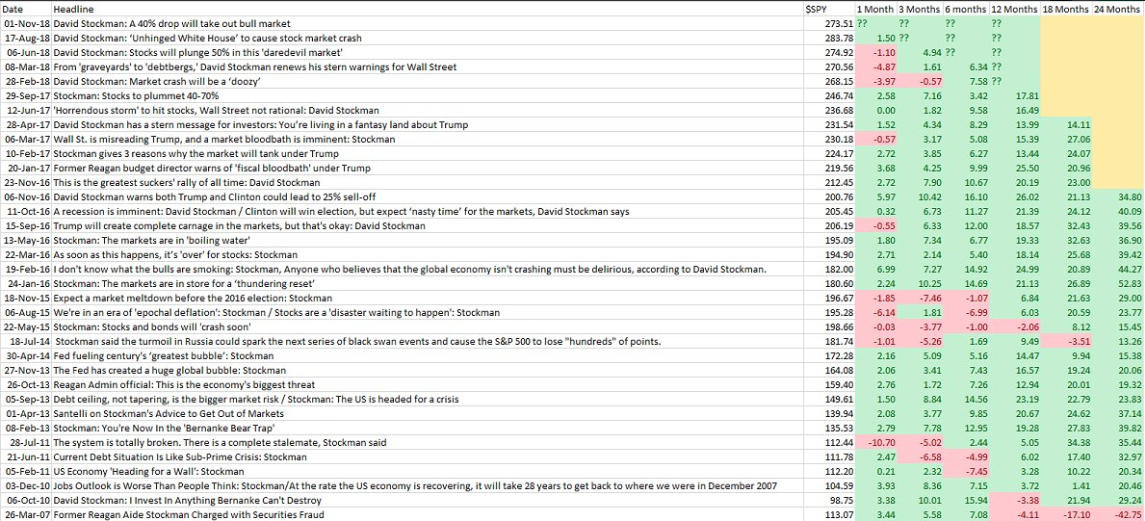
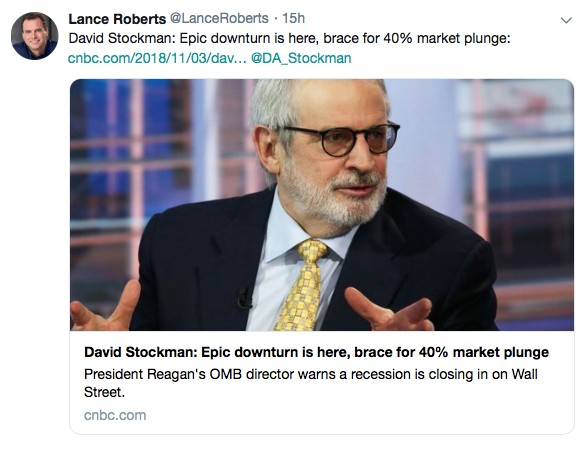
He’s basically been “right’ once, back in 2007 and when he was charged by the SEC with securities fraud. How fitting isn’t it? The reality is Stockman has never been right; he’s simply a permabear. Permabears are always calling UPON a market crash, not calling THE market crash, which is where media publications get the story wrong. Stockman is no different than the likes of Lance Roberts and Jesse Columbo of Clarity Financial. It’s no wonder Lance Roberts retweets Stockman, a known culprit of securities fraud, crash warnings.
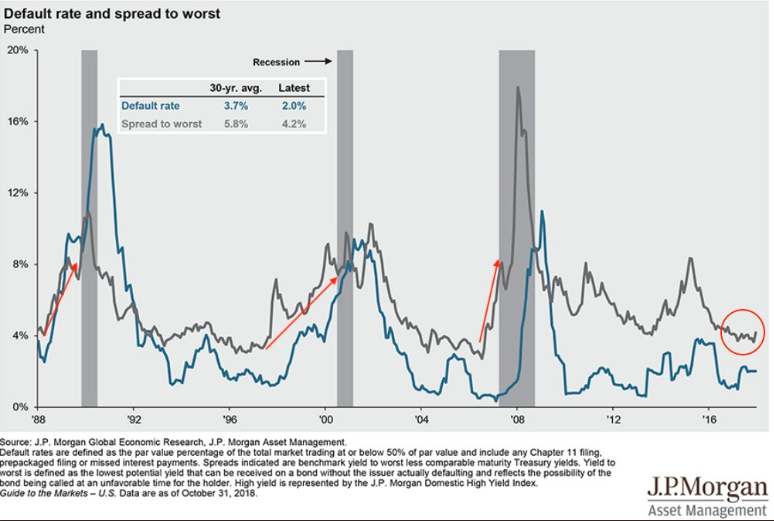
We’ve seen many, many bear market calls and narratives that suggest debt will cause the next recession. The fact is that debt in the United States doesn’t cause recessions, as we live in a consumer/demand-driven market. “But the national deficit and record high debt levels!” Debt, like equity prices go in one direction over time. Unless you, of course, believe the population trajectory goes down over time? Debt only has the ability to amplify a recession. Nonetheless, what these debt-heralding permabear cries will almost never tell you is that default rates are extremely low and have been moving lower since the Great Financial Crises and even lower since 2016. As shown in the chart below from J.P. Morgan ((JPM) default rates remain very low. Spreads (gray line) widen ahead of a recession; they’re not widening right now.
A market crash is coming that will be followed by another market resurgence; these are simply the inevitabilities of the market place. All you can do as an investor is the same thing we always encourage at Finom Group:
- Actively manage your portfolio and finances
- Perform the necessary due diligence for portfolio holdings
- Seek mentorship for aspects of portfolio management and trading
- Have a plan and establish disciplines
- Be flexible with your plan, but without emotion-driven activity
- Always consider your activity with a long-term outlook
Everyone has an opinion about the market and everyone assumes his or her opinions are valid. The long-term trajectory of the market goes from the lower left hand corner to the upper right hand corner; it’s quite literally the only way the market can work. Your job as an investor is simple: Avoid the emotional decay that pervades the periods where the market corrects and finds many selling when they should be buying, as proven throughout the market’s history…long-term.


