
After another strong rally on Wall Street Monday, equity markets are in retreat early Tuesday morning and expressing the early signs of consolidating gains. This is something we’ve heralded for a couple of weeks now as a strong probability, but in no way exonerates the new bull market that has been created over the course of the last 2 months. Consolidation is normal and to be anticipated. What an investor does with a period of market consolidation is a whole other story though, as most investors become paralyzed with fear and especially should market consolidation combine with heightened levels of volatility. Nonetheless, here was our outlook for markets, which was offered on May 24th and consistent with our weight of the evidence, flexible approach:
“Ultimately, the main consideration is what an active portfolio manager should do if the market continues to melt up and above the 200-DMA or falls 7-10 percent. I’m of the opinion that lightening volatility exposure or high beta positioning (fast and percentage moving) into a 200-DMA advance would prove optimal given Finom Group’s 30-day outlook that anticipates consolidation. To reiterate: Consolidation can take the form of time and/or price. Over the last 6 weeks, the market has exacted a good amount of time consolidation while the S&P 500 traded in a tight range.
“Moreover, we remain of the opinion that dips are to be used as long-term buying opportunities. In no particular order we outline our 5 REASONS underlying our BUY THE DIP premise:
Having offered the above a few weeks back, Finom Group consistently participated in the melt-up through the 200-DMA through profitable trading, which has proven to build our cash position. We remain steadfast that a new bull market has been confirmed and begs of investor resolve during any periods of market consolidation. Additionally, while the debate rolls along over the V-shaped or U-shaped or even L-shaped economic recovery, we highlight that the market’s recovery off of the March 23rd lows looks a lot like a V-shaped recovery and something akin to the market recovery from the March 2009 bottom.
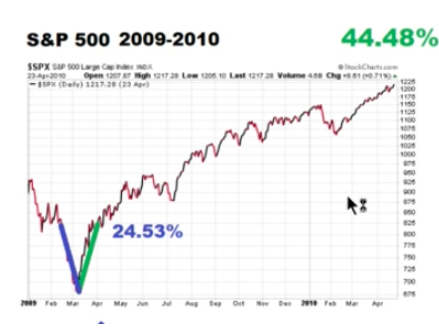
The current market rally is extremely similar to that of 2009, which did continue to march higher into 2010. The gain indicated atop the S&P 500 chart of 44.48% was not from the bottom, but after the 24.53% V-bottom. Having said that, we can see the hiccups in the advance along the way, which begs of investors to expect an uneven advance in the market over time.
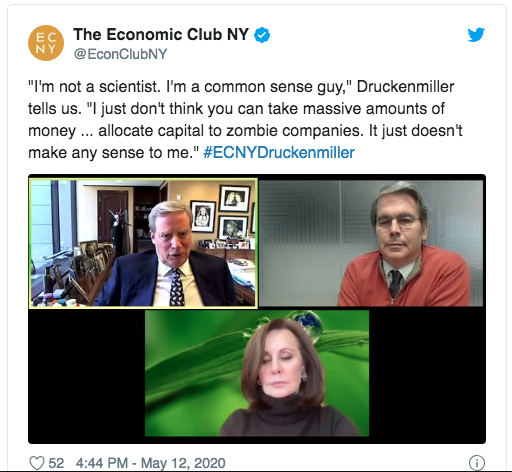
Through much of the S&P 500 and peer indices recovery process, many market participants and highly touted fund managers proclaimed the recovery to be a farce and likely to end poorly for those participating. Recall Stanley Druckenmiller’s soliloquy about markets and the economy nearly a month ago and as follows:
“Hedge fund manager Stanley Druckenmiller told the Economic Club of New York on Tuesday that, “The risk-reward for equity is maybe as bad as I’ve seen it in my career,”according to the organization’s Twitter account.

“The government stimulus programs won’t be enough to overcome the economic problems. It makes no sense for the market to jump so much when optimism emerges around certain drugs like Remdesivir (“I don’t see why anybody would change their behavior because there’s a viral drug out there”) and, most concerning, that “there’s a good chance that we just cracked the credit bubble that’s the result of free money.”
“The consensus out there seems to be: Don’t worry, the Fed has your back. There’s only one problem with that: our analysis says it’s not true.”
“While traders think there is “massive” liquidity and that the stimulus programs are big enough to solve the problems facing the U.S., resulting in stratospheric P/E multiples, the economic effects of the coronavirus are likely to be long lasting and will lead to a “slew” of bankruptcies.
With that review of Druckenmiller’s market and economic commentary in-hand, the famed hedge fund manager updated his thoughts with an interview on CNBC Monday.
“I was up 2% the day of the bottom, and I’ve made all of 3% in the 40% rally.”

“I missed a great opportunity here”, he added. “Won’t be the last time.
Well, I’ve been humbled many times in my career, and I’m sure I’ll be humbled many times in the future”, he told Joe Kernen. “When COVID hit, I was pretty much of the view that there was a good chance the credit bubble had finally burst and the unwinding of that leverage would take years”.
Druckenmiller is not alone in missing out on the largest relief rally since the Great Depression. Some 52 days since the rally began, the S&P 500 has traveled more than 40 percent. Very few had such a rally in their models back in March.
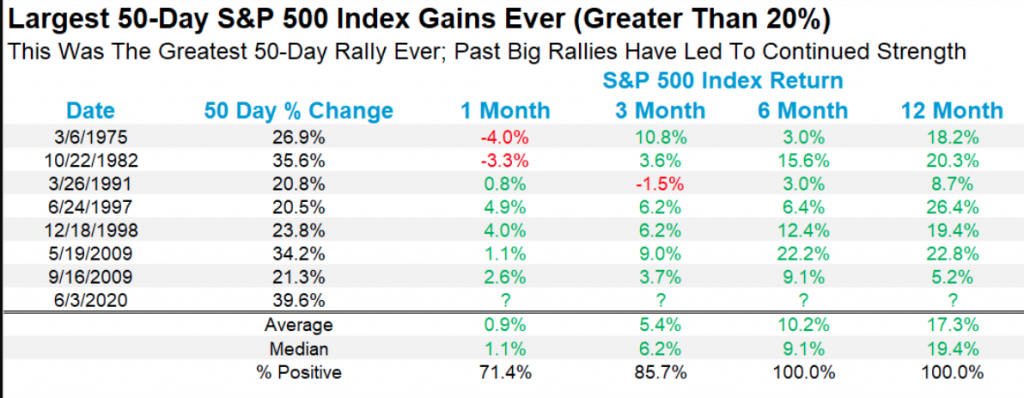
- 50 trading days after the bear market ended and the S&P 500 is now up 39.6%, for the best 50-day rally ever.
- Looking at the other largest 50-day rallies, they tend to take place at the start of new bull markets and the future returns 6- and 12-months later are quite strong.
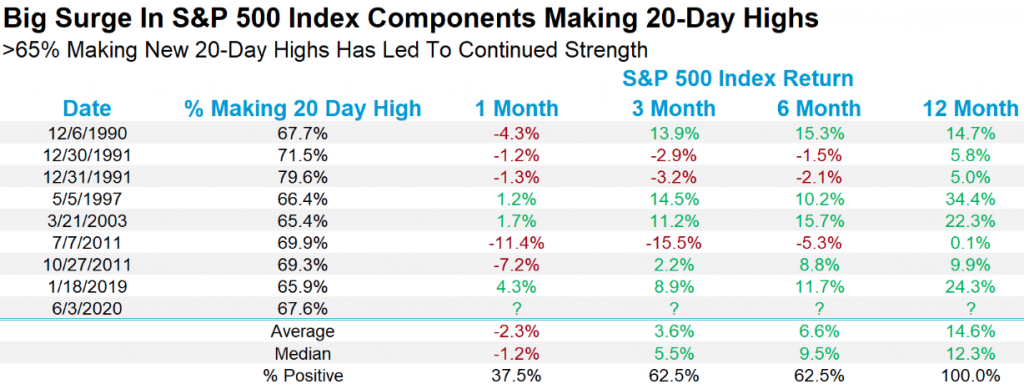
Leading up to Tuesday’s trading session, there have been plenty of signs pointing to markets that are overheated. From the number of stocks trading above their 50-DMA (96%) to the number of stocks trading at their 20-day highs (65%), such market breadth is consistent with a new bull market, but demands some form of consolidating gains near-term.
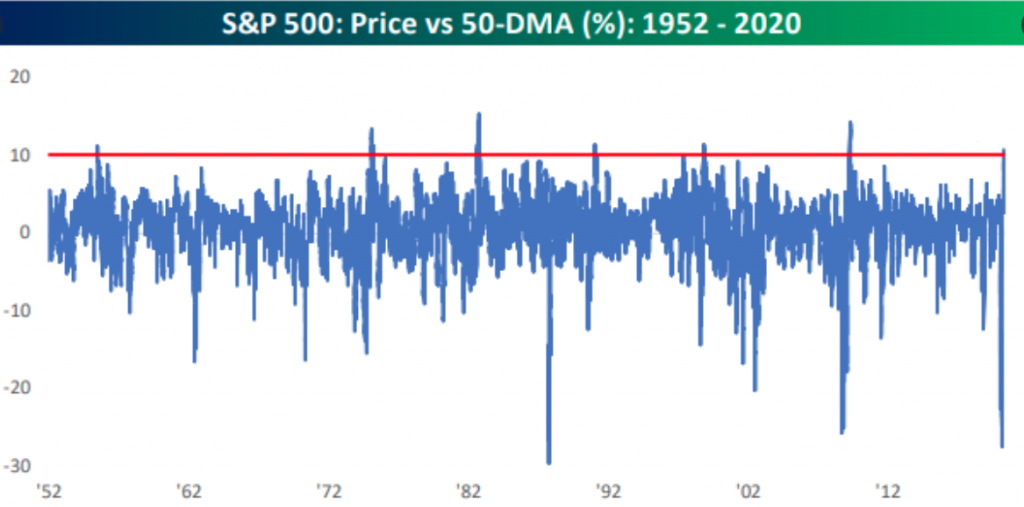
Alongside these breadth readings proving an overheated market, the following chart of the S&P 500 and its 50-DMA also proved “concerning” in the previous week. The chart identifies the distance the S&P 500 has traveled above its 50-DMA. At present levels, the index is some 3 std. deviations above its 50-DMA, which has also curled higher (a bullish sign).
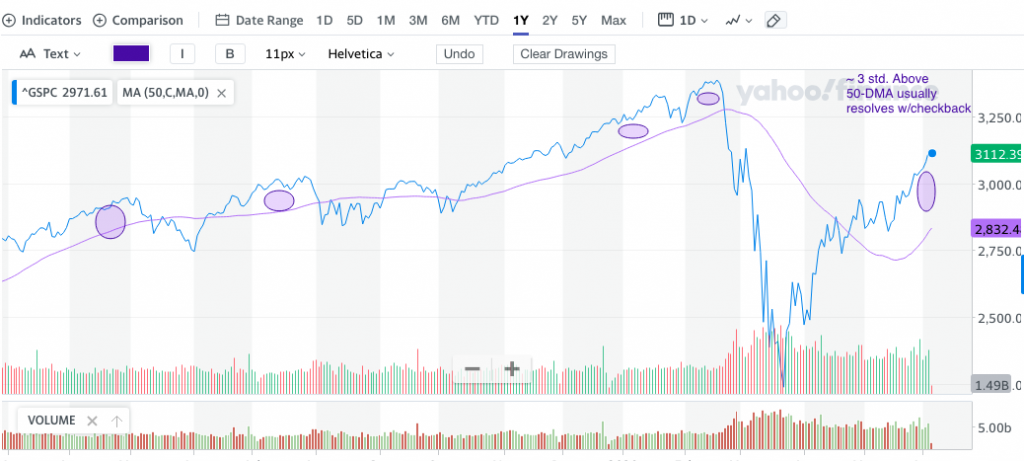
Usually, when the index is this far away from its fastest moving average it tends to consolidate in price and/or time. At present levels, the S&P 500 hasn’t been this far above its 50-DMA since 2009. Nonetheless and while the media will likely march out a plethora of market pundits to justify the any market retreat through the lens of economic uncertainty and/or valuations, we would be dip buying in accordance with our game plan.
Many of the worst feared outcomes for the economy that had been forecasted a month ago and prior to the economy slowly reopening haven’t shown signs of coming to fruition. Last weeks’ release of industry PMIs and Nonfarm Payrolls proved less bad than forecasted and showed signs of an economy which likely trough during the month of May.
Part of the good news on jobs centers on the manufacturing sector which showed a rebound of 225,000 manufacturing jobs added as the Federal Government is offering to pay moving costs and tax incentives for American companies to bring their overseas supply chains back to American shores. We expect to see these jobs numbers continue to grow.
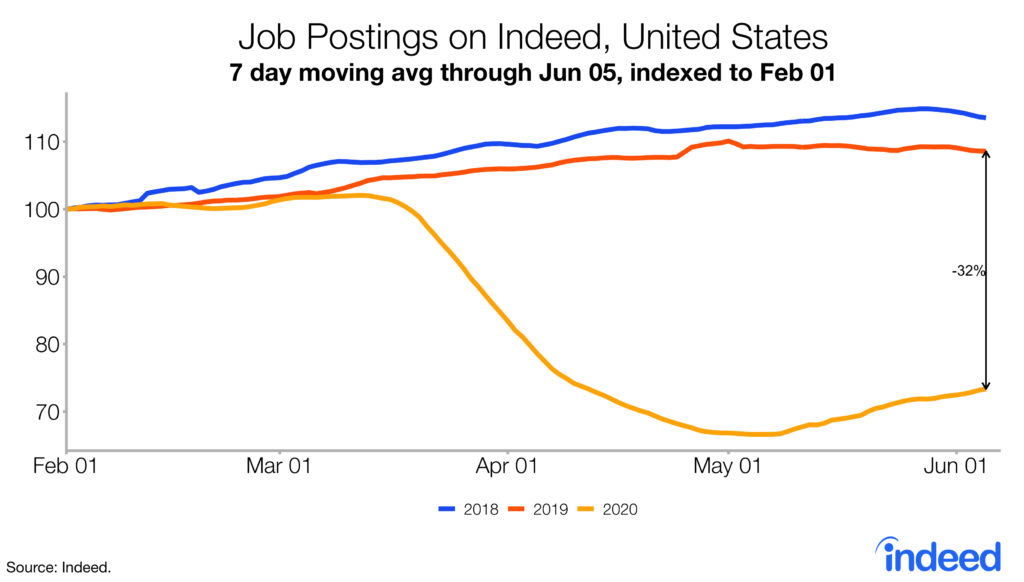
The global economy has slowed dramatically during the coronavirus pandemic. The trend in job postings, a real-time measure of labor market activity, is 32.5% lower than in 2019, as of June 5. But much like the less bad Nonfarm Payroll report, the trend has improved over the past five weeks relative to May 1, when the trend was down 39.3% from a year earlier.
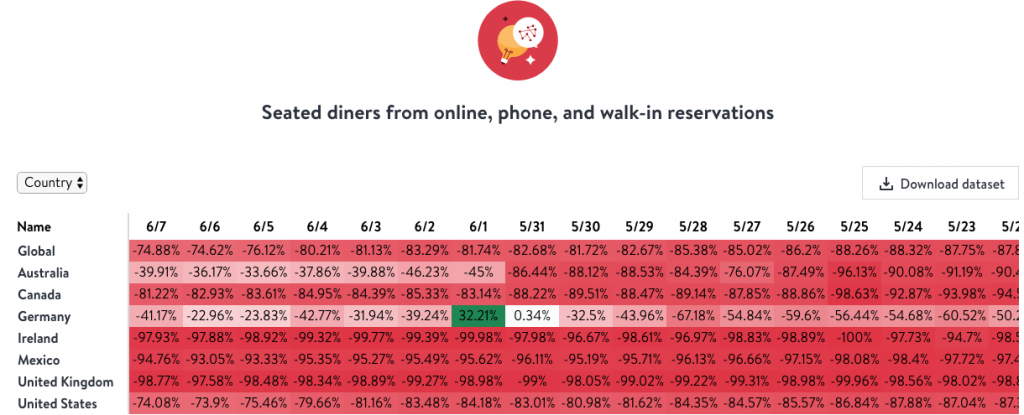
Online reservations for vacation rentals have increased 127% since April. Mortgage applications moved above the pre-virus levels and auto sales have improved significantly since April. Travel and restaurant bookings are increasing. (OpenTable State of the Industry daily tracker)
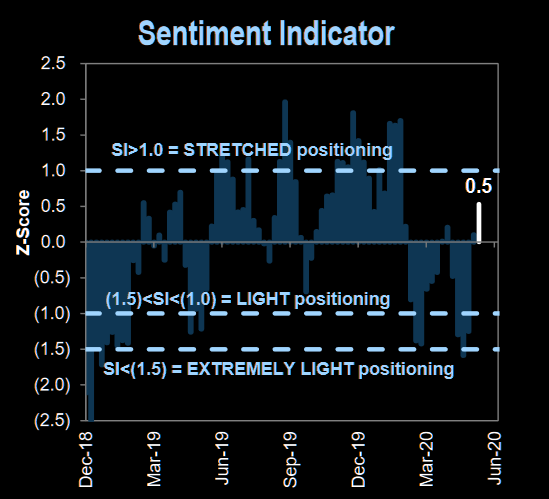
Much of the overall sentiment running parallel to the market has shifted since May and in accordance with a decline in market volatility. Bullishness still remains subdued, while equity positioning, however, has shown signs that also align with overbought and overheated markets. Goldman Sachs’ positioning indicator can be viewed in the following 2 charts. The first shows positioning has been stretched to the upside…
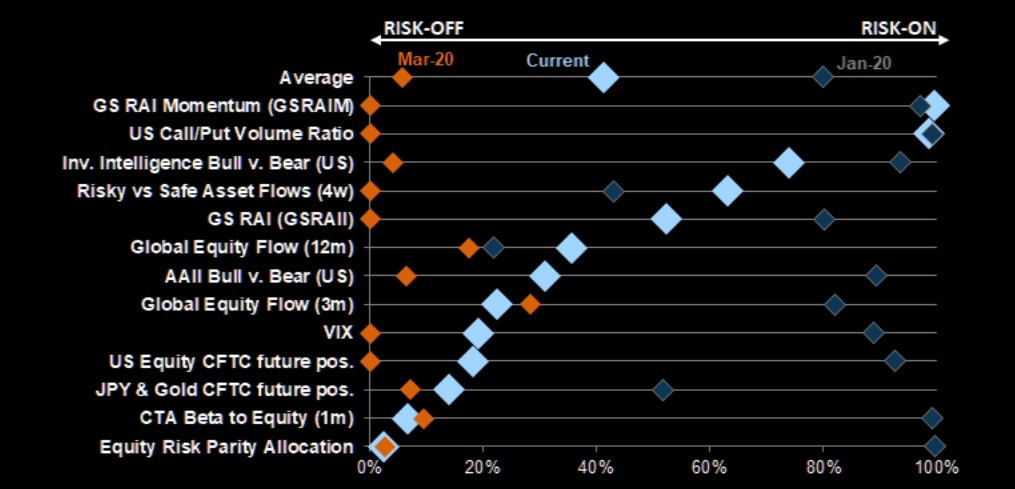
The second chart/table identifies most positioning indicators remain light, but have started to increase sharply. The percentile of different sentiment indicators since 2007 are noted in the table below and we encourage investors to recognize that actual allocations remain below average, while survey and sentimental positioning indicators are above average. It’s probably quite recognizable that the call/put volume ratio is extreme.
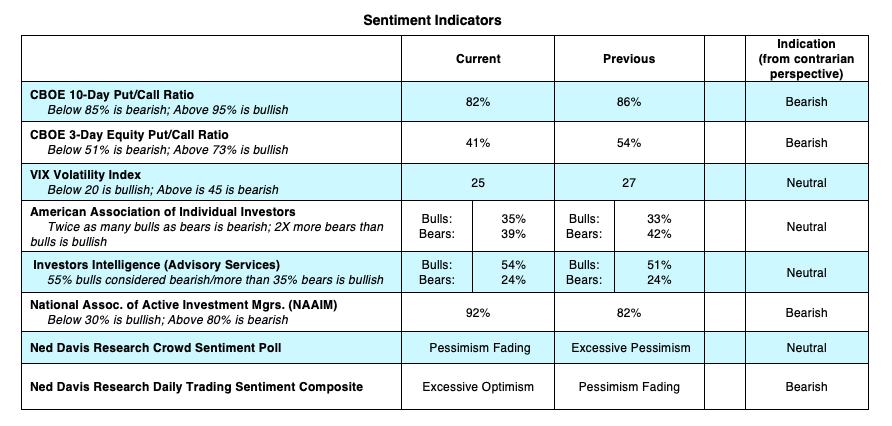
In addition to the Goldman Sachs’ chart/table above, Ned Davis Research’s table of individual sentiment and positioning indicators aligns succinctly with that of Goldman’s.
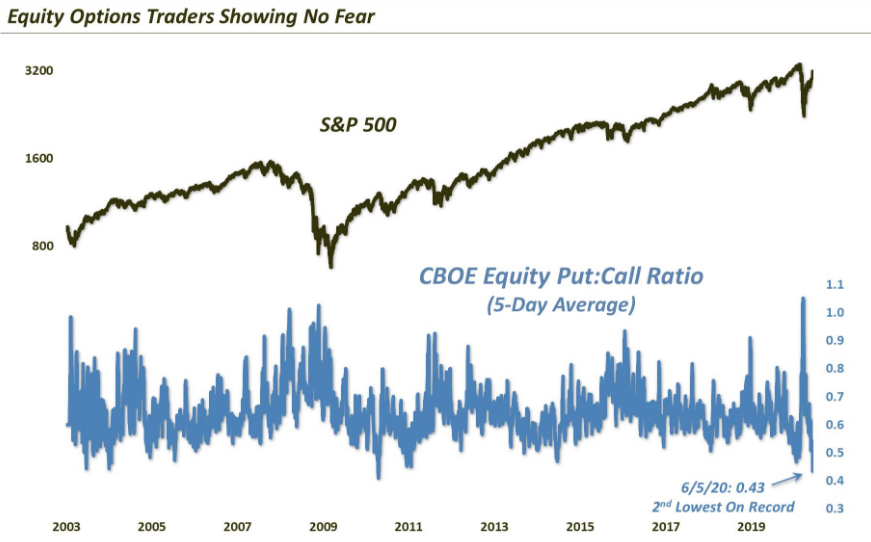
With pessimism notably fading and excessive optimism taking hold of markets, the Equity Put/Call ratio has plunged to levels not seen since 2010 as well. Last Friday, the ratio finished at .41% and after Monday’s markets continued rally we saw the put/call ratio continue to decline to .37 percent.
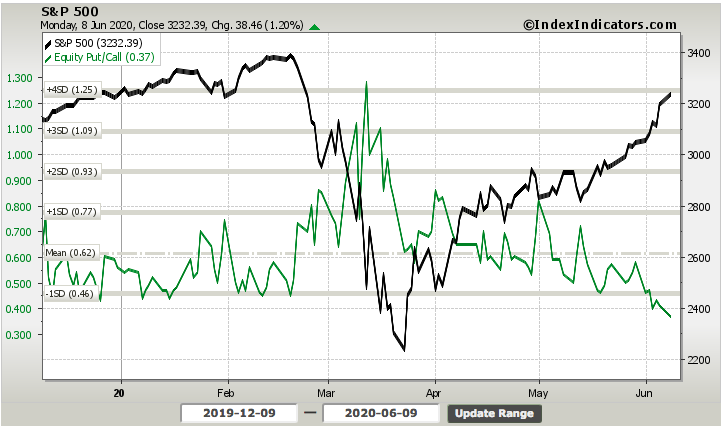
The most notable aspect of the chart above identifies that the put/call ratio is not an ideal signal for investors to take action. Keep in mind that the put/call ratio has been trending down for more than a month and has been below .60% (historically a low average reading) for the last 3 weeks. Had someone gone short the market using this measure of sentimental positioning, they would have missed the last 10%+ move in the market.
For a longer-term view of the 5-day average put/call ratio, the chart below shows just how extreme sentiment has been over the last couple of months and through Monday’s trading activity. The CBOE Equity Put:Call Ratio (5-day average) finished at the 2nd lowest level on record (April 2010)
No one indicator should be used as a reason to position in favor of or against the market trend in our opinion, least of all the put/call ratio. While we recognize the current level as being extreme, it likely demands additional extreme readings coming together to elicit a period of market consolidation. With the aforementioned in mind, here is what we offered in our weekend Insights Report and with regards to the put/call ratio:
“The Put/Call ratios noted above identify complacency, but even this doesn’t pose an immediate threat to the market. Akin to the poorly positioned hedge funds in E-mini futures that were found covering in multitudes this past trading week, the Put/Call ratio isn’t the best signal for gauging market trajectory near-term.”
The market has had a fantastical, unprecedented, record-setting rally. In terms of momentum, the index has now gained 11.53% over the last three-weeks. When examining all other 3-week winning streaks that ended with returns of 10% or more, we can see that the last time this happened the S&P 500 got absolutely smashed the next month (2011). However, most other instances showed upward momentum persisted, especially over the forward 3-week period.

Momentum begets momentum as they say! And no matter how we choose to look at the market, a breakout has clearly taken place. It would likely prove an optimal time and place in the newly formed bull market and given the historically overbought conditions and sentiment noted above, to exact some form of consolidation sooner than later.

While equity futures are pointing to a nearly 350 point drop for the Dow Jones Industrial Average (DJIA) at the open of trading Tuesday, it remains to be seen if the dip buying activity that has become commonplace and more constant throughout the rally continues. The S&P 500 is less than 6% from recovering record highs while the Nasdaq (NDX) touched it’s record highs on Monday.
Moreover, the S&P 500 now trades at more than 22 times forward earnings, its highest valuation since mid-2001. We’ve noted in the past that we are of the opinion that the previous 10-yr trailing PE average of 15s was likely to moderate higher when the new bull market is born. With that being said, we think high teens to low-20s will describe the next 10-yr trailing PE average value. Piper Sandler’s chief market technician Craig Johnson recognizes the high valuation the S&P 500 has captured during the relief rally, but also suggests it will prove of little consequence in 2020.
“There’s no question that earnings drive stocks, and I think that is going to continue to be the case. I think what we’re seeing right now in this market, though, is due to the unprecedented stimulus between the Fed and also between the fiscal policy that’s been put into place, a bridge has been sort of built over 2020.
I see a market that’s going to continue to push ahead. I think by year-end, we’re going to get to 3,600 on the S&P 500. That is an objective that we’ve had since December of last year and we reiterated at the March lows.”
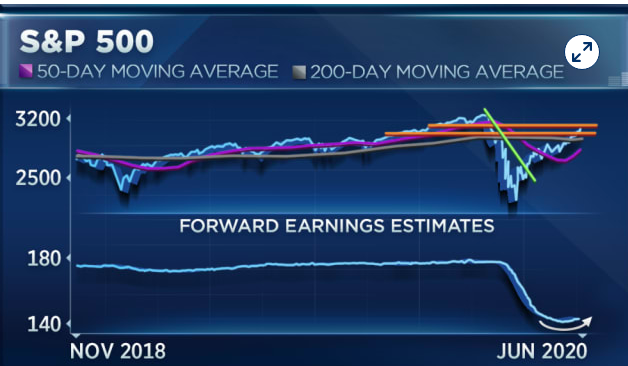
The good news for investors who recognize that markets following the trajectory of earnings over time is that the forward-looking earnings estimates seem to have trough and turned higher. And piggy-backing on Craig Johnson’s commentary, BTIG strategists led by Julian Emanuel said that while the short-term was unclear, on a 12-month basis the S&P 500 should move to new highs led by cyclical stocks that were beaten in the coronavirus downturn and resurgent off the bottom.
Investors have been “historically whipsawed” in recent years, with 2018’s volatile bull run ending with a non-recession bear market in the fourth quarter and 2019’s “Fed-inspired” bull market running into February’s coronavirus crisis bear market, noted Emanuel.
We’re watching for signs and the eventual period of market consolidation, not with fear, but rather anticipation. When we take all the notable overbought conditions and combine them with the record-setting market rally and sentiment, we think that consolidation is that much closer to reality. With a focus more recently tied to the extreme put/call ratio reading, Monday’s market rally was not met with a lack of hedging activity. The S&P 500 rallied just over 1%, but also found the VIX rallying some 5% on the day. This is not as unusual as one might think, mainly because Monday’s are when the VIX is reset from the lowered options bids the previous Friday and weekly automatic hedging programs are executed amongst the institutional investor communities. Having said that, the hedging programs usually run their course by mid-day. With the VIX actually rallying through the closing bell, we recognize yet another decoupling of the VIX/SPX inverse relationship. Remember, we’ve seen this type of decoupling before and at key market levels, but not to the degree we saw on Monday.
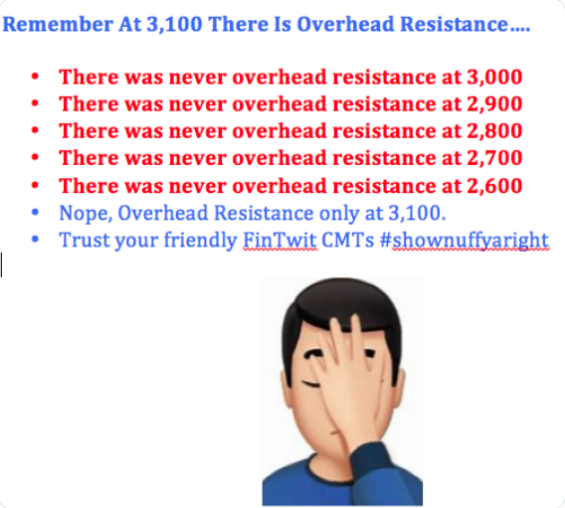
The tweet graphic above identifies the prevailing #Fintwit sentiment during each S&P 500, one hundred point mile marker achievement. But again, Monday was found with a more profound decoupling of the VIX/SPX relationship akin to what we saw back in March and just before the S&P 500 bottomed. Take a look at the left side of the VIX/SPX chart below, dating back to March 18th:
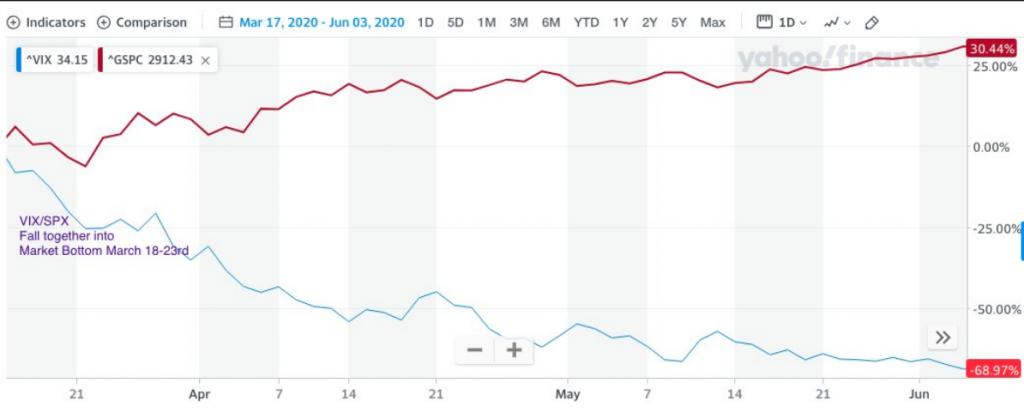
The VIX inverse SPX relationship is roughly 85% of the time. Divergence is often found at inflection points in market moves. A perfect example came ahead of and through the March 23rd bottom. In the chart above, the VIX and SPX declined from March 18-23rd. They declined together! So the question is whether or not the recent rally has reached an inflection point to the upside in the same way the market reached an inflection point to the downside in March of 2020. We’ll find out soon enough and as investors and analysts alike scramble to position for the most optimal long-term outcomes.
Here may be some other helpful insights related to the recent VIX/SPX decoupling on Monday: According to a recent study from Steve Deppe:
- SPX gains 1% or more while the VIX gains 5% or more during a persistent uptrend in SPX (ROC’s 5, 10, & 20 all higher) since 1990.
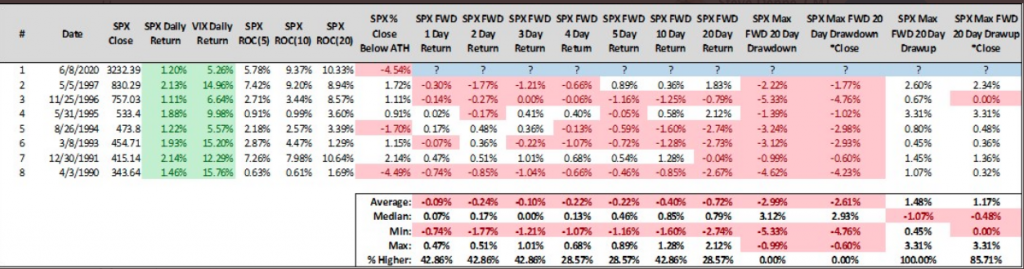
There’s a lot of red on the screen after such a decoupling of the 2 indexes performance noted in the table going forward. Four of the prior 7 occurrences, by the way, were also on Monday. And do take notice that the declines are rather inconsequential on average.
We’d be careful of any narratives attached to any negative portrayal of Tuesday’s potential market consolidation. Let’s face it, analysts and strategists have been largely found out of touch with markets since the bear market began. At 3,200, the S&P 500 is sitting 9% above the projection of 2,933, the average level where strategists expect the index to finish 2020. That’s the widest gap in Bloomberg data going back in 1999.
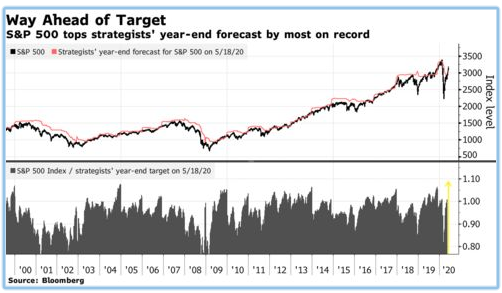
While strategists’ record in forecasting the S&P 500 has been spotty at best, they missed the benchmark’s gain in 2019 by more than 10% percentage points and overshot the market by a similar amount in 2018, their current stance echoes prevailing skepticism among institutional investors.
As evidenced by Stanley Druckenmiller’s lack of market participation during the relief rally, money managers have been reluctant to embrace the equity rally. Their equity positioning has climbed from a record low but is still stuck in the 8th percentile of a historic range, according to data compiled by Deutsche Bank. From a contrarian perspective, such pessimism bodes well for the market because it means potential buying power.
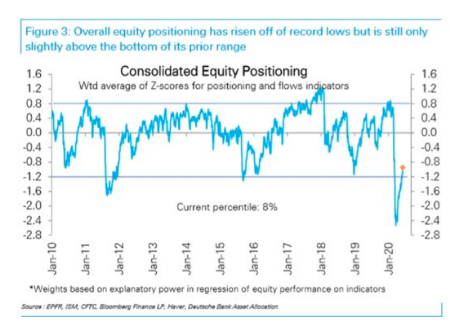
“Equity positioning has risen from rock bottom but is still extremely low,” Deutsche Bank strategists including Parag Thatte and Binky Chadha wrote. “Institutional money across the systematic as well as discretionary spaces is now chasing.”
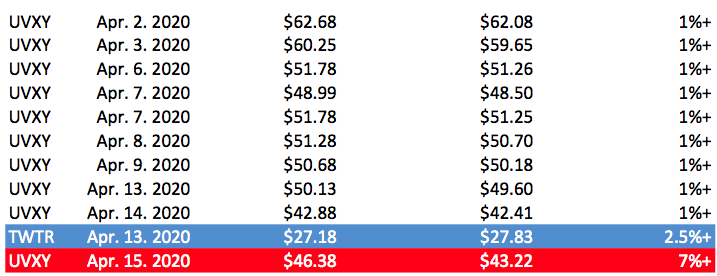
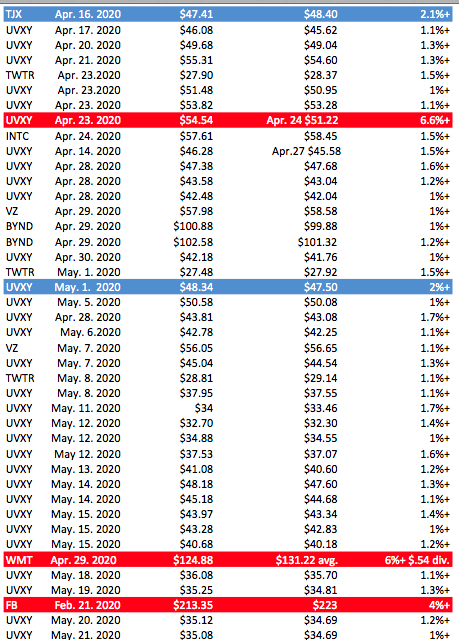
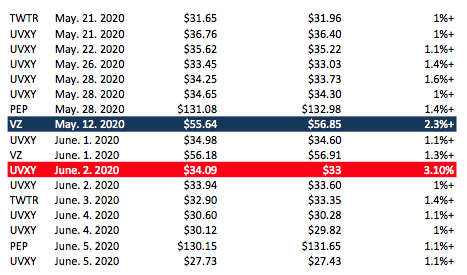
With all that being said, trade safely and trade with us at finomgroup.com in our live daily Trading Room! Below are our completed short-VOL (UVXY) and other trades since the April rally solidified the start of a new bull market.
Subscribe to our Premium or MasterMind Options trading services before our membership fees are adjusted higher on June 10th, as announced previously, and lock in the existing fee levels. Have a great trading week and stay in touch with the facts, while avoiding the hyperbole!


