
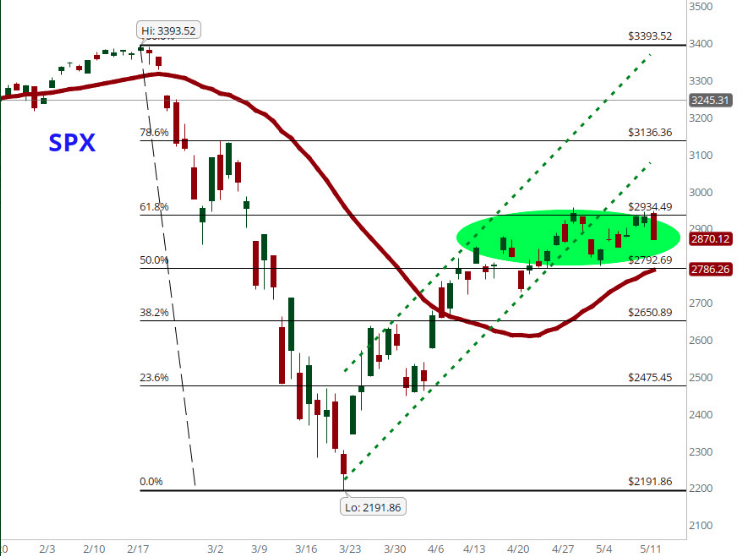
For the second trading day in a row, the S&P 500 (SPX) managed to climb above the 61.8 Fibonacci level around 2,935 only to be pushed back down (Chart below). The struggle is real and seemingly found for selling pressure for each attempt at closing above the key retracement level. Almost immediately after gapping higher on Tuesday (2,945), the market gave up all of its gains as volatility increased into the late afternoon. When it was all said and done, even the technology sector couldn’t hold the markets together as the Nasdaq (NDX) also tumbled just over 2% on the day.
With Tuesday’s 2% decline on the S&P 500, the benchmark index is back below the 2,900 level while the VIX is back above 33 after a brief stent below 27 on Tuesday. That kind of reversal in the VIX was discussed for it’s potential in our Daily Market Dispatch publication on Monday and prior to that in the Finom Group trading room with our Premium and Master Mind Options trading members, as follows:
“The VIX closed at its lowest level since late February this past week, declining to below 28 by the end of the trading week. Having said that, are infamous 10-day ROC has found levels typically associated with a near-term bounce in the VIX. As such, Finom Group recognizes the potential for the VIX to decouple from its typical inverse relationship with the S&P 500.“
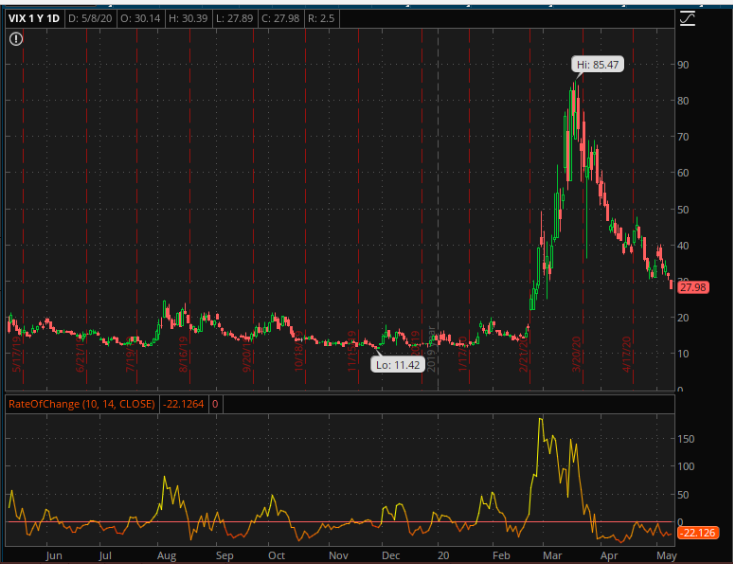
The bottom chart identifies the 10-day ROC whereby it doesn’t like to stay below the -20 level for very long before popping back up above the 0-bar, even if ever so briefly. Keep in mind our verbiage outlining the potential for the VIX to rise absent the S&P 500 declining. The inverse relationship between the 2 indexes is only viable 85% of the time, not 100% of the time.“
In further analyzing the VIX of late, we understand that it has fallen severely since it achieved a record closing high level just above 82 back in late March. Additionally and according to the latest data from DataTrek, the VIX is doing something it almost never does; here’s what it says about the next 1-3 months for the S&P 500:
- The CBOE VIX Index is down 58% over the last 30 trading sessions. It closed at 65.5 on March 27th and 27.57 Monday.
- A 30-day decline in the VIX of 50% or greater is extremely unusual; it has only happened 15 times since the start of the modern VIX in January 1990.
- Eight of those occurrences (53% of the total) are in the last three weeks.
- Here are the other instances, and where the S&P traded in 1-3 months after those outsized deltas:
August 8th, 2016: next month: +0.02%, next 3 months: -1.9%
February 7th, 2019: +1.6%, +6.6%
October 6th, 2015: +6.0%, +0.5%
January 6th, 2009: -7.0%, -10.6%
November 26th, 2014: +0.8%, +1.8%
March 20th, 2018: -1.7%, +1.9%
August 9th, 2016: -2.4%, -0.8%
- The average S&P 500 1-month and 3-month returns of those non-2020 “down +50% VIX” occurrences: -0.4 across both timeframes. However, if you exclude 2009 the averages for the remaining 6 occurrences are +0.7% over the following month and +1.4% over the next 3 months.
Takeaway: a rapid decline in the VIX, such as what’s just occurred, typically portends further modest gains for the S&P 500 over the next 1-month (+0.7%) and 3 months (+1.4%).
The outlier that’s excluded, 2009 is, however, worth noting and is suggested to be of little concern. The date of that 50% drop was January 6th. Options prices around calendar year ends typically undervalue volatility because the last 2 weeks of any year are usually very quiet, and the VIX is the Implied Volatility imbedded in options tied to S&P 500 Futures. It takes a few days for options prices to reset once the calendar turns, so the January 6th, 2009 print was an anomaly in our book.
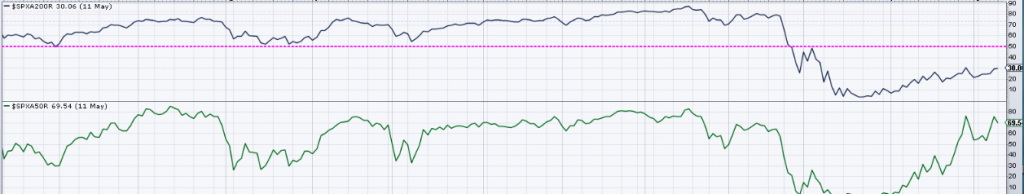
As we started this trading week, breadth had materially improved from the past trading week and with the S&P 500 finishing up more than 3% on the week. Roughly 70% of S&P 500 stocks were back above their 50-DMA, and that’s up from 0% about 6 weeks ago. Having said that, still just 30% of S&P 500 stocks were above their 200-DMA. This serves to indicate that most stocks have recovered from the lows but still have not eclipsed this widely followed long-term breadth barometer. (Top panel 200-DMA, bottom panel 50-DMA)
Regardless of the improved breadth coming into the trading week, the S&P 500 has proven reluctant to break-out of the top of it’s relief rally trading range for the last 3 weeks. In fact, the 2,800-2,900 area has been a much traveled level for the benchmark index over the last year or so.
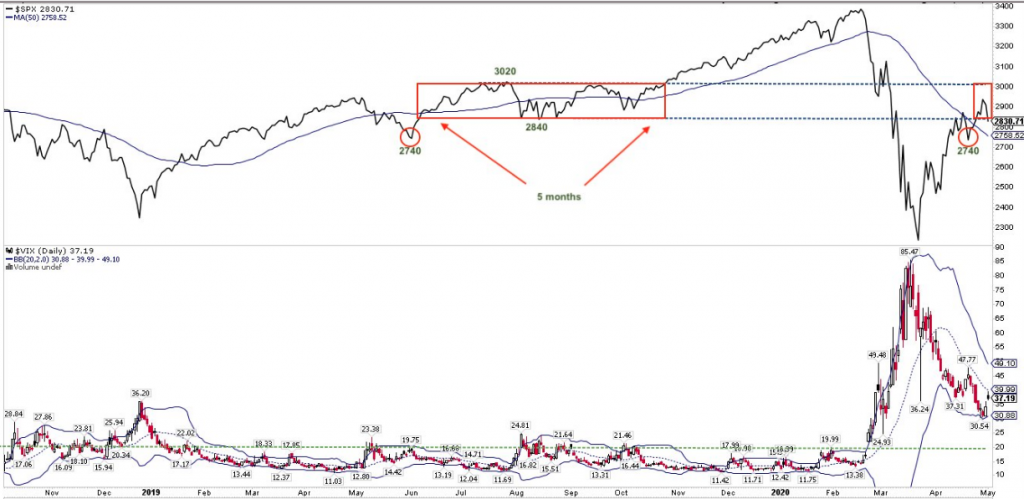
As shown in the chart above, the S&P 500 spent a goodly amount of time in this trading range from April of 2019 – October of 2019 and before finally breaking out of the range. The left side of the chart identified with a rectangular box shows that we remain inside this range now for 3 weeks and likely need a positive catalyst to fuel a break-out once again. If the S&P 500 stays within the boxed range, look for the top of the box to be achieved; if it goes below, look for the circles identified in the 2,750 area which could lead to additional risk-off.
Again, the index likely demands a catalyst to rise and close above the former relief rally high of 2,959. What that positive catalyst might be remains to be seen, if any, but it could come from additional fiscal relief being proposed by the U.S. Congress and outlined below.
Democrats in the House of Representatives unveiled their proposal for a new stimulus package that calls for a second round of $1,200 stimulus checks. The legislation, named the Heroes Act, includes another round of “more substantial economic impact payments.” That second round of checks would be $1,200 per family member and up to $6,000 per household.
The proposal comes as the U.S. government is still in the process of sending out its first round of stimulus payments authorized by Congress through the Cares Act. Those payments are for up to $1,200 per individual or $2,400 for married couples, plus $500 for children under 17. That first round of payments targeted low- to middle-income Americans.
Heading into Wednesday’s trading session, bond yields continue to revert from last week’s gains and equity futures are pointing to another down day in the 5:00 a.m. hour. While the trend has been kind to bulls and tormenting to bears, seeing how there is arguably a disconnect between the market and the economy, equity market liquidity remains an obstacle for trend reversals. As we can see from the Deutsche Bank chart below of S&P 500 future contract quantity size per bid/ask, liquidity has improved, but remains near record low levels.
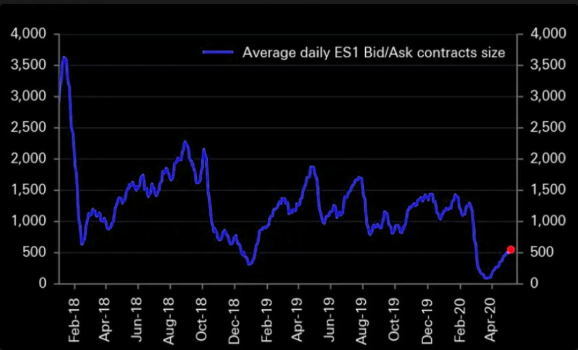
This serves as a reminder that while central banks can provide credit markets will all the liquidity in the world, and they seemingly have, it lends little to no liquidity to the equity markets. In no way, shape or form do we deny the sizable monetary stimulus impact on confidence, but confidence is not impacting liquidity.
Finom Group continues to discover that while the market remains rangebound, commentary, analysis and forward-looking models for the S&P 500 are vastly differentiating. Some analysts and strategists are of the opinion that the relief rally is commonplace and typical of bear markets. Others are of the opinion a new bull market has commenced.
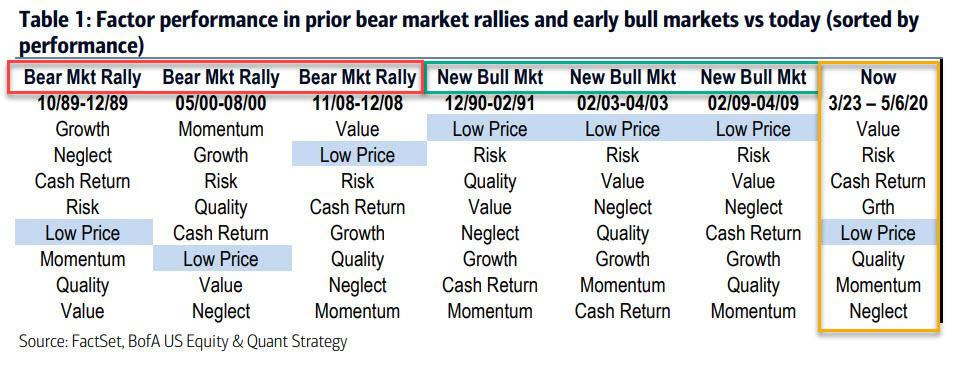
In determining whether March marked the beginning of a real bull market (like March of 2009, March of 2003 and Jan of 1991) or a bear market rally (Nov 1989, June 2000 and Dec 2008), BofA’s quant team notes that factors can help. Consider that during the early stages of each of the prior real bull markets, the bank’s Low Price factor, read “dollar stocks”, or “distressed equities”, was the best performing factor, but did not lead in bear market rallies.
Alternatively, prior bear market rallies saw mixed leadership, and “Low Price” traditionally was outperformed by such factors as Value, Momentum and Growth. Since 23 March lows, Value (Price/Book and Fwd P/E) and Risk (Estimate Dispersion and Beta) have led markets. But it is the mediocre performance of Low Price stocks, i.e. distressed equities from the bottom, which to BofA suggests that this is just another bear market rally.
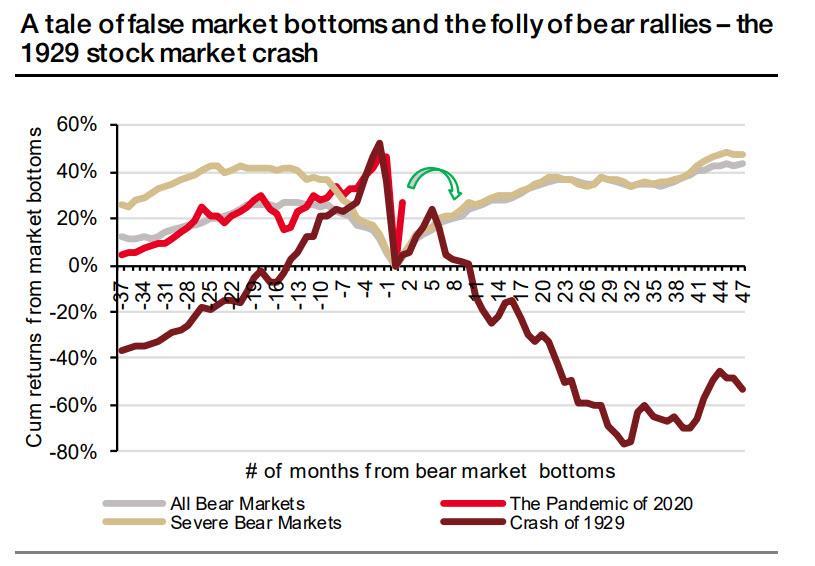
BofA’s conclusion is built further by a recent report from SocGen’s Solomon Tadesse, who notes that “after a record low in March, the market has surged in short order, registering a stunning 31% gain in a matter of a month. Given the overall negative undertone from the economic challenges ahead, the dramatic reversal of global markets after the pandemic lows is more puzzling, as it also implies an all clear victory against the silent enemy and a return back to the pre-pandemic normality.”
Solomon Tadesse goes on to state the following:
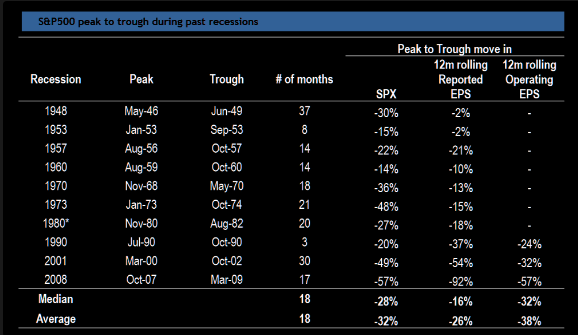
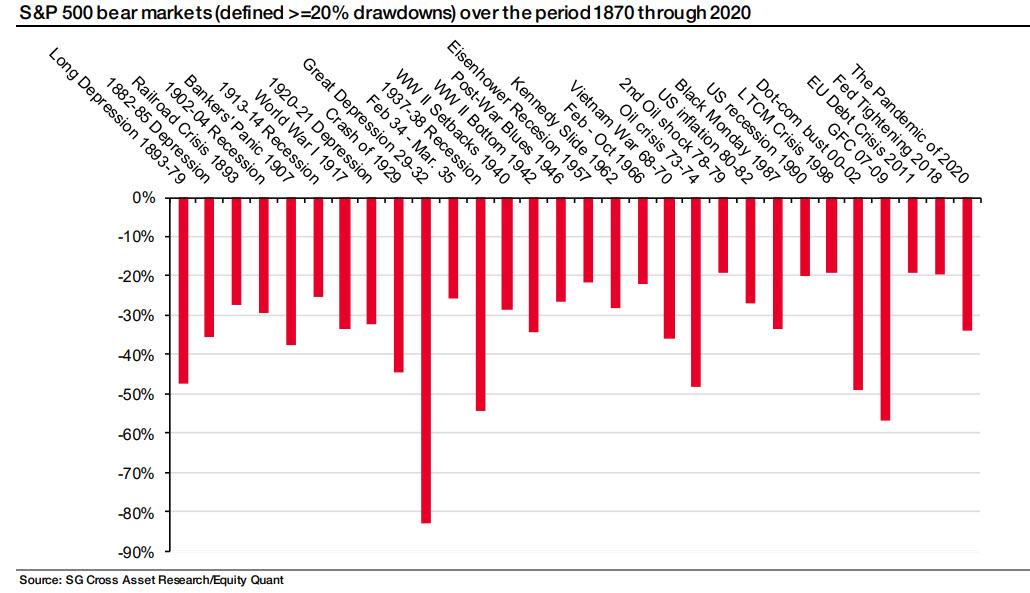
“Moves of such magnitude have been observed in the past, furious overshoots such as the current one tend to be – almost entirely – bear market rallies, because a look through the annals of market history and a study of bear markets in the last 150 years reveals that a return to recovery from a bear market bottom, both cyclical downturns and sudden market crashes, has often been gradual, with frequent adjustments along the way, reflecting the weight of uncertainty surrounding economic recovery out of the ashes of crises.“

“…based on an exhaustive analysis of bear markets of the last century and half, under the most conservative scenario – that the market has indeed reached cyclical bottom in the March sell-off – the S&P 500 would finish at about 2715 by year-end, a 7-8% cumulative correction from the current level of 2,939.”
“With the current fallout from the complete shutdown of economic life in terms of disruptions in supply chains and collapse of aggregate demand, as well as the uncertainty on the post-lockdown path to recovery, new market bottoms are possible, although the unprecedented massive policy response could provide the backstop to a worsening case of deflationary spiral.”
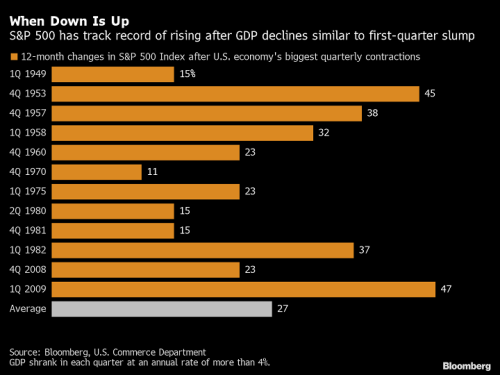
It’s kind of a mixed message or what we call “covering all the bases” by SocGen’s analyst. In other words, it lends itself to a wide range of possibilities for market performance going forward. For this reason, in part and as everyone seems to have a base, best and worst case forecast, we lean on history to offer probabilities. It’s often said or retorted that since there has never been such recessionary and bear market conditions as they’re are today, history doesn’t lend itself to determining probabilities going forward. We couldn’t disagree with that sentiment any more, even if we tried. The reason we disagree is largely due to human behavior proving quite constant, even in the face of severe adversity. The Fight or flight human instinct or means for which to combat adverse scenarios doesn’t really change all that much.Given the aforementioned, here is what Keith Lerner, chief market strategist at SunTrust Private Wealth Management discovered about past severe Q1 GDP declines:
- Buyers of U.S. stocks after the economy shrank in the first quarter have history on their side. Gross domestic product contracted at an annual rate of 4.8% in Q1 2020 (revisions to come), marking the 13th quarterly decline of more than 4% since 1949, according to data compiled by Bloomberg. After each previous instance, the S&P 500 Index gained more than 10% during the next 12 months. This track record helps explain a “market-economy disconnect” seen lately, Lerner wrote in a report last week.
The only issue we have with this factoid of historic Q1 GDP declines and 12-month returns thereafter is based on what happened in April 2020, just last month. Recall that this past April proved one of the strongest in history, after the worst Q1 drawdown in history of 20% in the S&P 500. Recall from Finom Group’s Research Report back on April 11th, noted below:

“This past week, the market was up more than 12%. Do you see what I’m getting at here? If you have a fear of missing out (FOMO), it doesn’t seem like you won’t get another opportunity. The S&P 500 has already accrued the 1st monthly average return and quite a bit more, after a down 20% Q1 period. It has almost generated a return that isn’t usually achieved until after the following 2 quarters (6 months). The market may have gotten ahead of itself with its usual and expected relief rally. Nothing is guaranteed, of course, but we might see some consolidation in the coming weeks given a careful review of this study and an already strong April. Patience and discipline will likely be rewarded, but we’ll also look to trade what the market delivers going forward.”
So if we take the April monthly gain and combine it with SunTrusts historic data noted above, we’ve already achieved the 12-month returns post dramatic Q1 GDP declines. It becomes increasingly clear as to why so many analysts and strategist remain of the opinion that the relief rally has gotten ahead of itself and demands consolidation. Having said that, most of the same analysts and strategists admit that there has never been the magnitude and rapidity of fiscal and monetary support to compare with the present day.
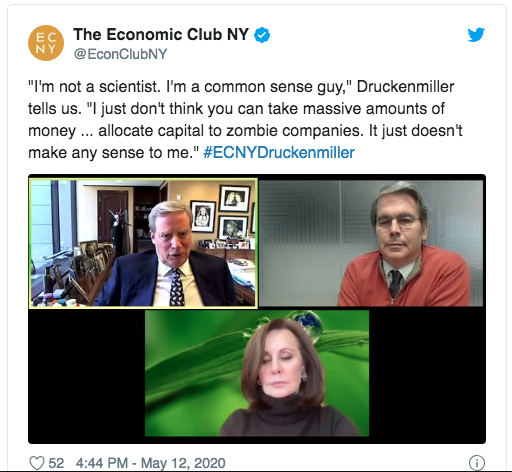
One might say the unique circumstances surrounding the market and economy are quite dizzying for investors, be them novice, intermediate or seasoned veterans of the markets. Hedge fund manager Stanley Druckenmiller told the Economic Club of New York on Tuesday that, “The risk-reward for equity is maybe as bad as I’ve seen it in my career,” according to the organization’s Twitter account.

“The government stimulus programs won’t be enough to overcome the economic problems. It makes no sense for the market to jump so much when optimism emerges around certain drugs like Remdesivir (“I don’t see why anybody would change their behavior because there’s a viral drug out there”) and, most concerning, that “there’s a good chance that we just cracked the credit bubble that’s the result of free money.”
“The consensus out there seems to be: Don’t worry, the Fed has your back. There’s only one problem with that: our analysis says it’s not true.”
“While traders think there is “massive” liquidity and that the stimulus programs are big enough to solve the problems facing the U.S., resulting in stratospheric P/E multiples, the economic effects of the coronavirus are likely to be long lasting and will lead to a “slew” of bankruptcies.
“Drucknemiller said that the Fed’s $3 trillion in stimulus programs aren’t likely to spur future economic growth: “It was basically a combination of transfer payments to individuals, basically paying them more not to work than to work. And in addition to that, it was a bunch of payments to zombie companies to keep them alive.”
Guys like Druckenmiller, who have consistently underperformed the 20-yr rate of return on the S&P 500 are always found for concern over market movement. This is not to say that the concerns are moot or inconsequential, but rather Druckenmiller is found taking a hyperbolic move in markets and juxtaposing or comparing it to the potential ramifications from COVID-19 with his own brand of hyperbole. For every move in the market, there will be an equal adversarial view of that move.
Moreover, market breadth is less hyperbolic and delivers more truth than sentiment over market price and/or trending price. For this reason, we revert/rely to some degree on the commentary delivered by way of monitoring S&P 500 Equal-Weight performance. And it hasn’t been favorably recently. We may have actually seen the limitations for an S&P 500 break-out achievement by way of the SPX Equal-Weight performance. For this analysis we simply look at the daily price action between the Index ETFs like SPY (Cap-Weighted) and RSP (Equal-Weighted).
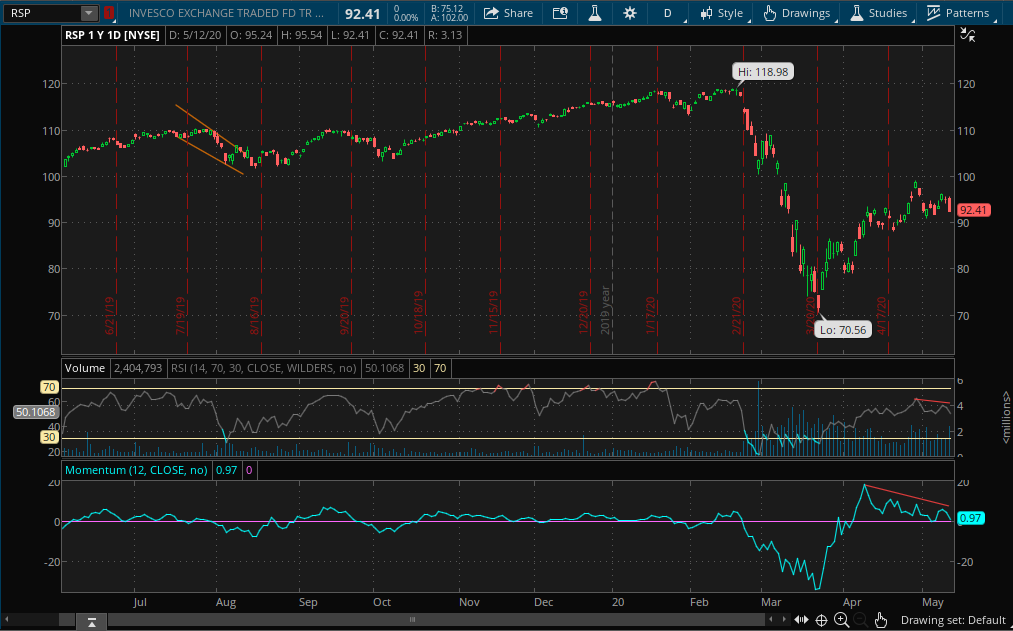
The chart of the RSP identifies that after a series of higher highs through April, the Equal-Weight ETF has seen lower highs for price, RSI and Momentum. This chart continues to stress that fewer stocks are lending favorably to the recent run in the S&P 500 back above 2,900. Without more stocks participating, future price consolidation, as warned by many analysts and strategists, may prove inevitable. Thus far, during the 7 week relief rally, the market has performed consolidation of time, but not so much in terms of price. Nonetheless, even the identified variables in the chart don’t guarantee any future outcomes, given the low-liquidity environment and jump-risk associated with headlines.
Another breadth factor eyed for assessing the strength or weakness of the current market trend is outlined by LPL Financial. The firm denotes that the S&P 500’s 20-DMA has been closely watched by investors in recent months, as the index has traded off the average, first as resistance in late March and more recently as support.
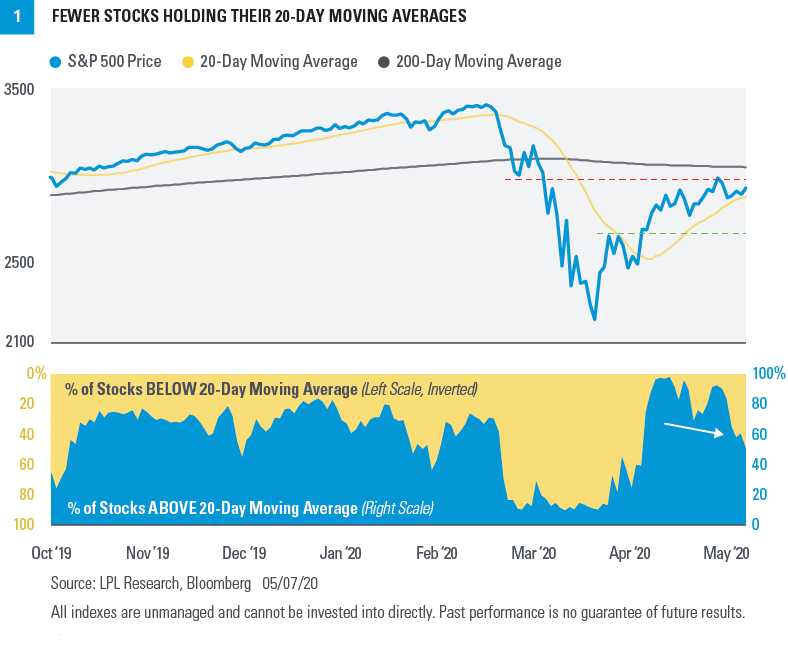
“This metric can also be applied to individual stocks. On April 14, a record 99% of the components in the S&P 500 traded above their respective 20-day moving averages, a bullish long-term signal showing the strength of buying in equities. As the S&P 500 went on to make a new high in late April, however, fewer stocks remained above that moving average. In recent days that number has fallen to 47%, the lowest since April 3, which tells us that recent gains are being led by fewer stocks. In fact, the top five stocks in the index now have a positive year-to-date return, while the overall index is still down nearly 10%.“
With that, we leave you with further market and economic considerations from Lisa Shalett, chief investment officer, Wealth Management division at Morgan Stanley.
“We believe that the U.S. economy is set for a “U shape”—or even a “V shape”—recovery, where economic activity will bottom, perhaps very soon, and then recover steadily.
Some other forecasters expect a recovery shaped like a “W,” or even an “L,” in which the economy slumps again, or worse, reaches a low point and then stays there for a while. The tension between these views is one reason why stocks have been in the same narrow range for the past three weeks. Below are three key economic questions that could determine the shape of the recovery:

- Will city and state governments run out of cash? This is an emerging concern for investors, and municipal-bond prices have fallen as a result. Local and state governments employ 13% of the U.S. labor force and are facing plummeting tax revenue and mounting COVID-19-related expenses. However, I expect an additional federal aid package to stave off deep cuts to government payrolls and keep municipal finances afloat until the economy recovers.
- Will damage to the labor market persist? While unemployment in the U.S. reached a staggering 14.7% in April, weekly claims for first-time unemployment benefits have fallen for the past few weeks. Although still elevated, the current rate is half of the peak that occurred for the week of March 28. The return to full capacity in hard-hit consumer sectors, such as retail, restaurants, hospitality and entertainment, may still be a year away, but other industries should see organic growth. Hiring is up for health-care workers and lab technicians, contact tracers, as well as warehousing, logistics and delivery personnel, as more industries adapt to business models built around social distancing.
- As states open up, will consumers start spending? Whether or not it is prudent, reopening has begun in most states—about a month ahead of expectations. I don’t want to sound callous, but my read is that, even if there is a resurgence in coronavirus infections, there may be little political will for a return to lockdowns, as long as hospital capacity isn’t stretched to crisis levels. Recent research I’ve seen shows that while the composition of consumer spending might shift (less dining out, more ordering in, for example), total level of discretionary dollars spent is unlikely to change. That suggests there will be new winners and losers, but that overall levels of consumption will come back with employment.
“To be sure, there are many unknowns, and while my forecast leans bullish on the economy, I still think markets will stay in the same recent range until there is more clarity.”


