
After the S&P 500 fell nearly 7% from its all-time high, Tuesday’s snapback rally might find investors more upbeat about putting capital back to work. Tuesday found all the major indices higher by greater than 2% and with the Nasdaq (NDX) leading the way, up 2.65% to end the trading session. It was just a day ago that the Nasdaq fell more than 120 points on various tech company oriented regulatory investigation headlines, but what the headlines taketh, the market giveth back with a 194 point rally. Such a rally on Wall Street must be heralding richer economic conditions and herald the “all clear” for more market gains to come, right? Not so fast says Finom Group’s Seth Golden.
“Tuesday’s market rally shouldn’t come as any surprise and we wouldn’t be chasing it given what was hit the hardest also rallied the hardest. That’s the tell tale sign of a dead cat bounce. It certainly lends itself favorably for investor sentiment, but the reality is that everything plaguing the market before Tuesday is still looming over the market, tariffs, falling oil prices and an inverted yield curve. None of those variables has been resolved for the better; the only thing that changed was the price of the market and individual stocks. Such a rally was warranted given the oversold conditions and the S&P 500 14-day average RSI falling below 40 Monday.”
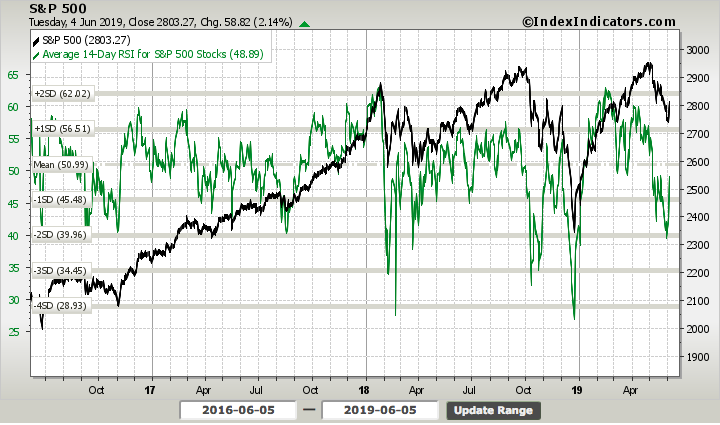
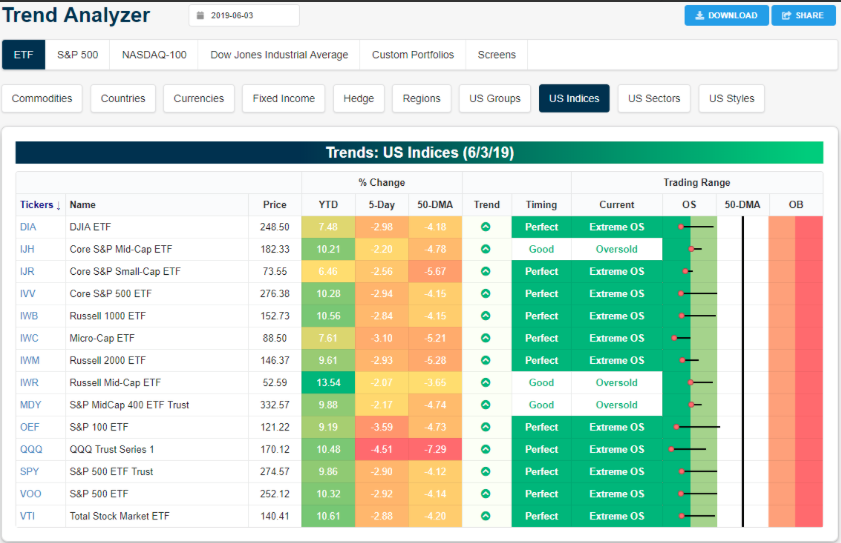
In addition to the RSI being that low, which by the way has been much lower, all the major index ETFs had also fallen into oversold territory as outlined in the Trend Analyzer by Bespoke Investment Group.”
As the market aims for a 2-day rally, we would feel remiss if we didn’t congratulate the U.S. economy for achieving the longest expansion cycle in history. The U.S. economic expansion began in earnest back in July 2009 and has run 119 months. The formerly longest expansion cycle in U.S. history began in April of 1991 and ran up to February 2001.
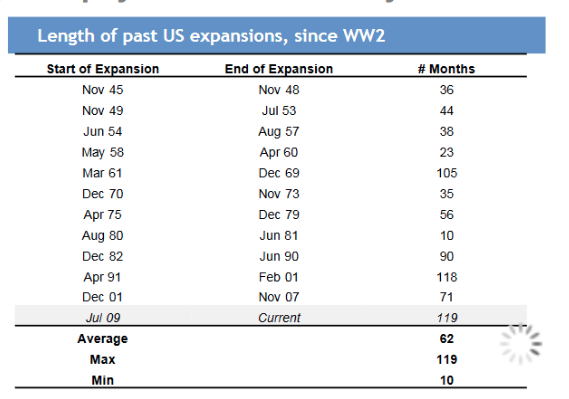
It’s unfortunate that the world recognizes 2001 as having expressed a recession. According to the National Bureau of Economic Research(NBER), which is the private, nonprofit, nonpartisan organization charged with determining economic recessions, the U.S. economy was in recession from March 2001 to November 2001, a period of eight months at the beginning of President George W. Bush’s term of office. It proved to be the shallowest and shortest recession in history. Additionally, the 2001 recession doesn’t satisfy the truest shorthand definition of a recession, which is “a fall of a country’s real gross domestic product in two or more successive quarters”.
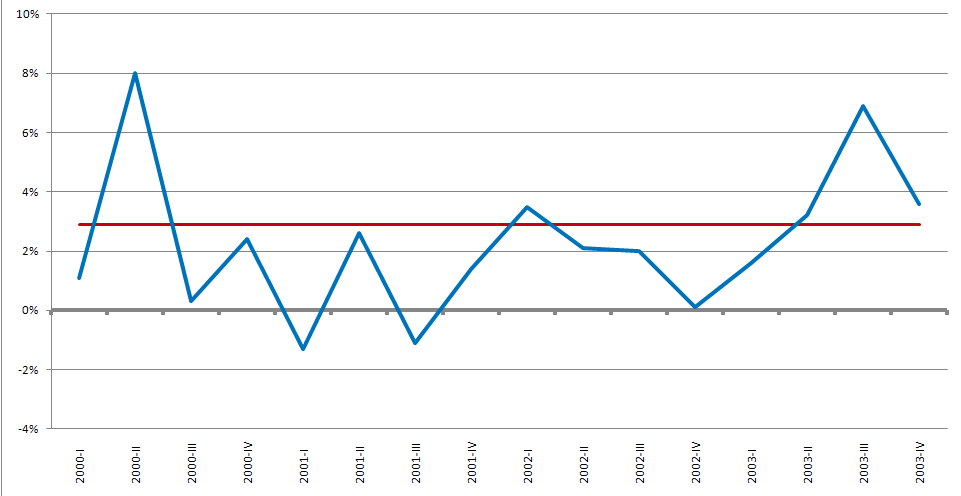
The Labor Department estimates that a net 1.735 million jobs were shed in 2001, with an additional net 508,000 lost during 2002. 2003 saw a small gain of a mere 105,000 jobs. Unemployment rose from 4.2% in February 2001 to 5.5% in November 2001, but did not peak until June 2003 at 6.3%, after which it declined to 5% by mid-2005. For comparison sake, today’s unemployment rate is 3.6 percent.
While we congratulate the U.S. economic feat of strength and accomplishment over the last 119 months and after a 2%+ market rally, the following chart recognizes the Q4 2018 S&P 500 market pattern.
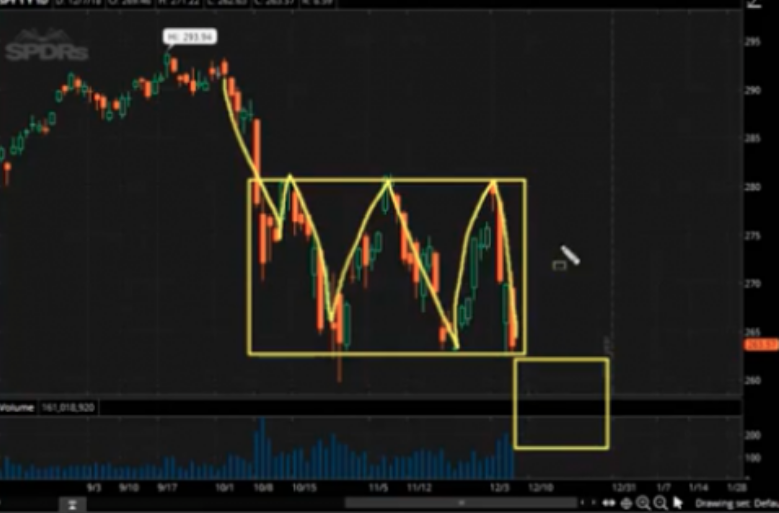
As shown in the box-shaped chart representation highlighted at the top end by the S&P 500 level of 2,800 and the bottom level of 2,650, the benchmark index is mirroring a similar pattern today.
The S&P 500 broke down and into the S&P 500 Volatility Box when it fell below 2,800. It found a low level around 2,730 before bouncing significantly and recapturing the 2,800+ level at the close yesterday and just as it did the on 3 separate occasions in Q4 2018. Given the recognizable repeat thus far, with the S&P 500 closing above 2,800 on Tuesday, investors may be better served to recognize the difference with today’s market activity in comparison to Q4 2018. The main difference is the assumed Fed and Trump “puts” that serve to backstop market declines.
The Fed put is an imaginary support mechanism believed to represent the Fed’s willingness to ease economic conditions should the economy warrant easing. In other words, the Fed is expected to cut interest rates should the economy slow and be found incapable of reaching any of the Fed’s 2 mandates, employment or inflation. At present, the inflation mandate, which it has offered to be a symmetric mandate, has failed achievement and remains at depressed levels. This mandate coupled with recent manufacturing data offers the Fed rationale to cut rates. But the market place has long since priced in at least 2 rate cuts by year-end. The reasoning for the marketplace action and/or forecasting are largely due to trade feuds that have persisted since 2018 and their apparent impact on global trade and global economic conditions. To these points of interest, many Fed officials have begun the shift in messaging away from the current pause in Fed monetary policy activity with regards to rates and toward a rate cut.
Fed Chairman Jerome Powell spoke at the start of a two-day conference at the Chicago Fed looking at big questions, whether the central bank should adjust its policy framework, find new policy tools and alter how it communicates to markets.
“I’d like first to say a word about recent developments involving trade negotiations and other matters. We do not know how or when these issues will be resolved. We are closely monitoring the implications of these developments for the U.S. economic outlook and, as always, we will act as appropriate to sustain the expansion, with a strong labor market and inflation near our symmetric 2 percent objective.”
The Fed chairman stressed in his remarks that the central bank would respond if there are more surprisingly low inflation readings in coming months. Core inflation is currently running a bit below the Fed’s 2% target.
“In this setting, a similar low-side surprise, if it were to persist, would bring us uncomfortably closer” to a scenario where the economy falters and the Fed might have to push short-term interest rates back to zero to try to spur growth. My FOMC colleagues and I must, and do, take seriously the risk that inflation shortfalls that persist even in a robust economy could precipitate a difficult-to-arrest downward drift in inflation expectations.”
The comments from Powell found equity markets accelerating to the upside on Tuesday and were dovetailed with the Vice Chairman Richard Clarida’s comments echoing Powell’s sentiment.
Federal Reserve Vice Chairman Richard Clarida said the economy is in a good place but he and his fellow central bankers are willing to take action if conditions change.
“We will put in policies that need to be in place to keep the economy, which is in a very good place right now, and it’s our job to keep it there.”
Though noncommittal about the future of rates, he said he will be watching current conditions, in particular the trade war and the inverted yield curve in the bond market, for clues about where the Fed should go next. If conditions change, he said that would influence his decision-making.
As it were, the Fed Chair and Vice Chair comments on the potential for cutting rates served to validate the notion of a Fed put and the equity markets had their largest 1-day rally since January 4, 2019. In referencing the S&P 500 Volatility Box above and the recent market rally, CNBC’s Jim Cramer suggests the market isn’t quite out of the woods just yet.
“Yesterday, the proprietary oscillator I follow hit negative 5, signaling that the market had gotten oversold, which is why I told you it was time to buy. That’s the real reason we could explode higher today on some chatter from foreign officials and the Federal Reserve — the market was like a coiled spring.”
Still, Cramer warned viewers to not be too bullish because the environment is still volatile. The host worries that the market has a “ridiculously short memory.”
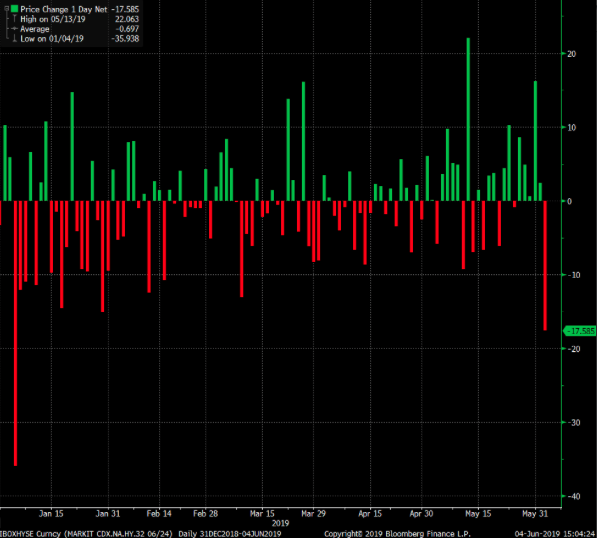
On a side note, the market’s biggest 1-day rally since January 4th was also the biggest 1-day drop since January 4th for high yield credit default swap spreads.
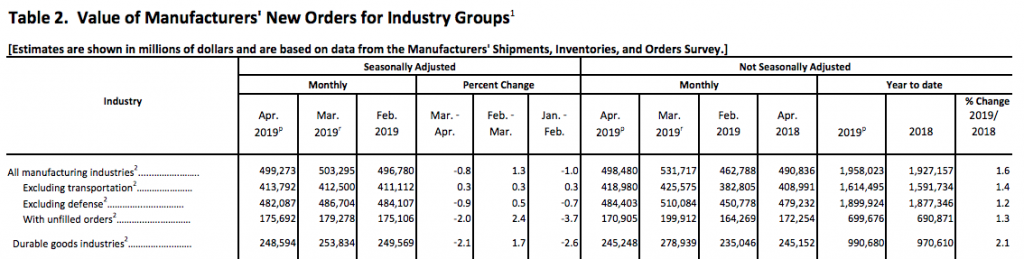
In addition to all the Fed talk and headlines on trade suggesting that GOP leaders might vote to block the White House Administrations tariffs, if implemented on Mexican imports, investors had very little economic data to contend with on Tuesday. Factory orders in the U.S. fell sharply in April for the second time in three months, adding to mounting evidence of a broad slowdown in a key segment of the U.S. economy.
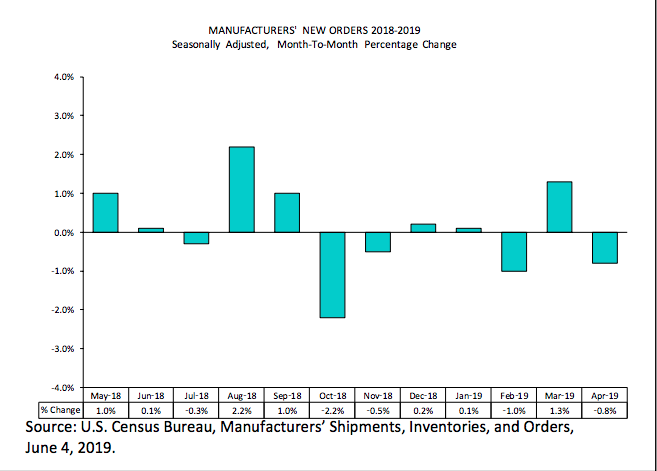
Orders dropped 0.8% in the month, the government said Tuesday. Economists polled by MarketWatch had forecast a 0.9% decline. While the headline decrease in orders is recognized MoM, it is important to recognize that the YoY data represents an increase in both durable and factory new orders.
The focus on economic data will accelerate midweek and through the end of the week as labor and employment data highlights the calendar. At 8:15 a.m. EST on Wednesday the latest reading on ADP private sector payrolls will be delivered. Later in the day, the Fed’s Beige Book will be released.
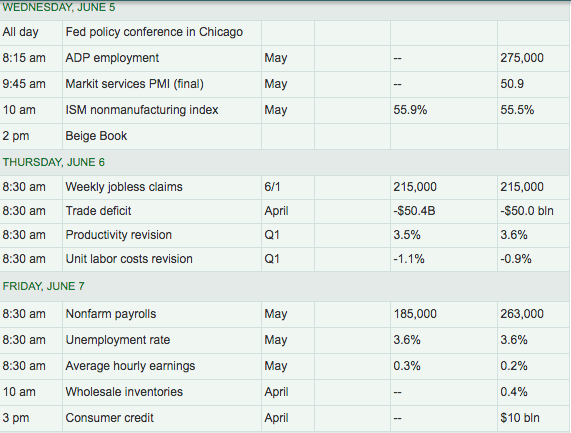
The consensus estimate for the ADP private sector payroll report is currently 175,000 new jobs to have been created in the month of May, down from 275,000 in the month of April. Of course, the most important economic data regarding the labor market will be delivered on Friday by way of the Nonfarm Payroll report. Current estimates show a forecast of 185,000 jobs to have been created in the month of May with the unemployment rate remaining unchanged at 3.6 percent.
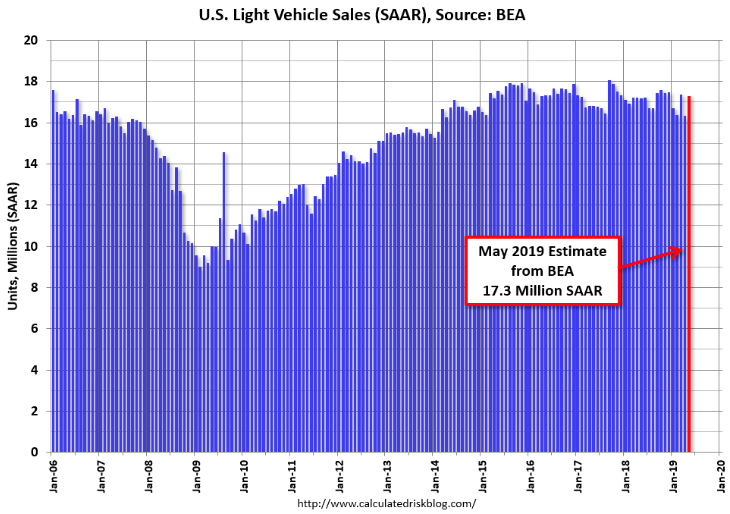
One piece of economic data that largely skirted under the radar this week was auto sales data. Major automakers on Monday posted higher U.S. new vehicle sales for May, the first increase for 2019 as a strong economy and upbeat consumer sentiment fueled demand. U.S. new vehicle sales through April had fallen 3%, fueling expectations of a weaker year for automakers in 2019 than last year.
The BEA released their estimate of May vehicle sales on Tuesday. The BEA estimated sales of 17.31 million SAAR in May 2019 (Seasonally Adjusted Annual Rate), up 5.9% from the April sales rate, and up slightly from May 2018. For all the consternation and concern surrounding vehicle sales in 2019, the numbers have continued to trade sideways and near cyclical highs. The following graph from Bill Mcbride shows light vehicle sales since 2006 from the BEA (blue) and an estimate for May (red).
Our last point on the weekly economic data is with regards to the weakest economic data already delivered earlier this week by way of the declining ISM manufacturing index. The ISM manufacturing index has been declining for the last 9 months and since the announced tariffs on China in late July 2018. The following chart is compares the S&P 500 and the ISM manufacturing index.
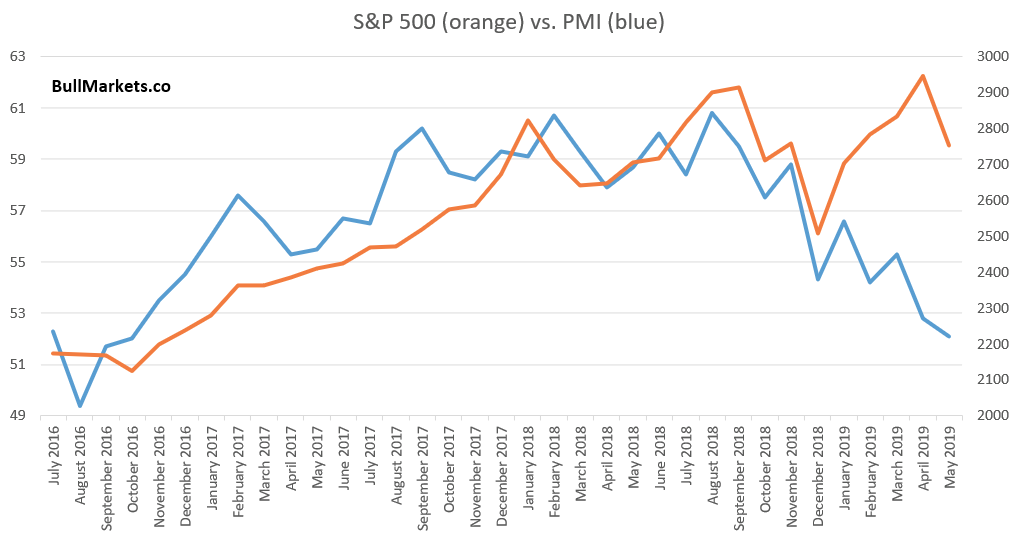
As we can see from the chart, there is a divergence between the two indexes. Having said that, it should be noted that the S&P 500 can diverge from most every chart and largely because it is the broadest reading on the health and strength of corporate earnings derived from a multitude of economic readings/indicators/indexes. For this reason we can understand that while any particular economic indicator can be up or down 50% percent of the time, the S&P 500 is up more than 75% of the time historically. In other words, the S&P 500 has many underlying inputs while the ISM manufacturing index is just one indictor. Nonetheless, we aim to discover what it means or forecasts for future returns when both the ISM and S&P 500 are both moving lower. Here’s what happens next to the S&P 500 when PMI falls more than -8 over the past 9 months, while the S&P also falls more than -5 percent.
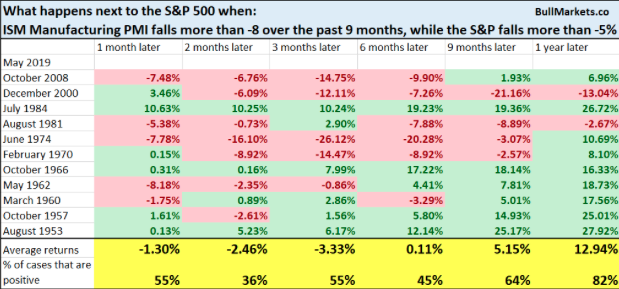
It’s clear from the table above that when PMI and stocks decline together, that is not a bullish sign for returns over the next 3 months. Manufacturing remains a large component of the global economy and as such it weighs heavily on global equity markets.
As we close out this Wednesday morning’s daily market dispatch we are forced to recognize a few things at play in the market. Firstly, we’re not out of the woods just yet and even with a continued rally on Wall Street set to take place Wednesday at the open. Crude oil prices are still falling and the S&P 500 has a very tight correlation with crude oil prices as the sector has large YoY swings in earnings given the large YoY swings in crude oil prices.
Secondly, the threatened Mexico tariffs remain front and center this week with Mexico’s trade delegates meeting U.S. trade representatives on Wednesday. Headlines from the meeting will likely be revealed in the afternoon hours and could prove to either roil or lift markets further.
Lastly, and this is a big one folks, the Fed seems to have regained its feel for markets. Finom Group’s Seth Golden had highlighted this issue back in 2018, suggesting that Fed Chairman Powell lacked a feel for the market and it was apparent in the failed messaging during the September 2018 FOMC meeting and through the Q4 2018 period.
“We can certainly find fault in the Fed’s messaging and failure to guide market expectations, as former Fed leaders have been able to do.“
It was the lack of feel for the market that was identified through its failed “autopilot” message surrounding rates and its balance sheet. Such terminology was also coupled with the messaging on inflation whereby Powell suggested that the Federal funds rate was a long way from neutral. It was a disaster in Fed messaging not seen in many years. But now… the messaging seems to be on par with what the market desires and expects.
A predictable central bank is one of the underappreciated hallmarks of a strong, stable market. Problems arise when no one can be sure what the Fed will do, when it will do it and by how much. That’s largely why stocks tumbled at the end of last year and for much of May. With the bond market pricing in multiple reductions in rates this year, Powell “must have felt compelled to at least lighten up on the Fed’s stubborn resistance to rate cuts,” FTN Financial chief economist Chris Low wrote in a note to clients.


