
Monday proved a rather volatile trading day, but one would not have truly recognized how volatile it was by simply reviewing the end result in the major indices. The Dow Jones Industrial Average (DJIA) was down by more than 100 points going into the final 30 minutes of trading, but finished higher by roughly 5 points. The S&P 500 (SPX) had a 32-point swing intraday from a high of 2,762 in the morning before double-tapping 2,730 in the late afternoon and finishing down 7.6 points at 2,744 on the day. The tech-heavy Nasdaq (NDX) took a beating Monday, down more than 1.6%, as various investigations and probes maligned many of the biggest names in the FANG realm. Alphabet (GOOGL), Amazon (AMZN), Facebook (FB) and even Apple (AAPL) have all been named and notified of regulatory investigations into their respective business operations. Alphabet’s Google division, Amazon and Apple are reportedly under investigation by the Justice Department, while the Federal Trade Commission is said to be investigating Facebook. Late Monday, the House Judiciary Committee also said it would investigate competition in the tech industry. What does it matte if China steals intellectual property rights and dumps certain goods in the U.S. at devalued prices when the U.S. government is willing to exact similar damage to its own domestic companies, based on the scale of their dominance?
- Apple was the most recent to face such a headline, with Reuters reporting Monday that the Justice Department has “been given jurisdiction” for a potential probe of Apple.
- Earlier Monday, The Wall Street Journal reported that the FTC, which already is investigating Facebook for privacy violations.
- On Saturday, the Washington Post said e-commerce behemoth Amazon could face intensifying antitrust scrutiny from the FTC, though it was unclear on what basis.
- The Wall Street Journal on Friday reported the Justice Department is laying the groundwork for opening a federal antitrust investigation of search giant Google. The FTC conducted a broad investigation of Google in 2013 but did not take action.
With tech stocks in focus and succumbing to market pressure of significance, bond yields still received a good deal of attention. Yields continued their decent on Monday with the 10-yr. Treasury falling to nearly 2.06% intraday. The spread between the 3-mnth and 10-yr. Treasury yield continue to widen the inversion from 8 bps 10 days ago to roughly 25 bps currently. The rate of the 10-yr. Treasury yield decline has been as equally concerning as the level and inversion.
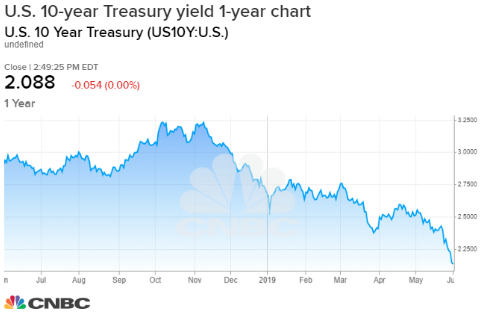
For context, the 10-year yield was at 2.55% at the beginning of May and many strategists believed the Fed would be raising interest rates this year, and the 10-year would be above 3 percent. Now the 10-year is bordering on 2% and much of the long end of the yield curve is beneath the Fed Fund futures rate.
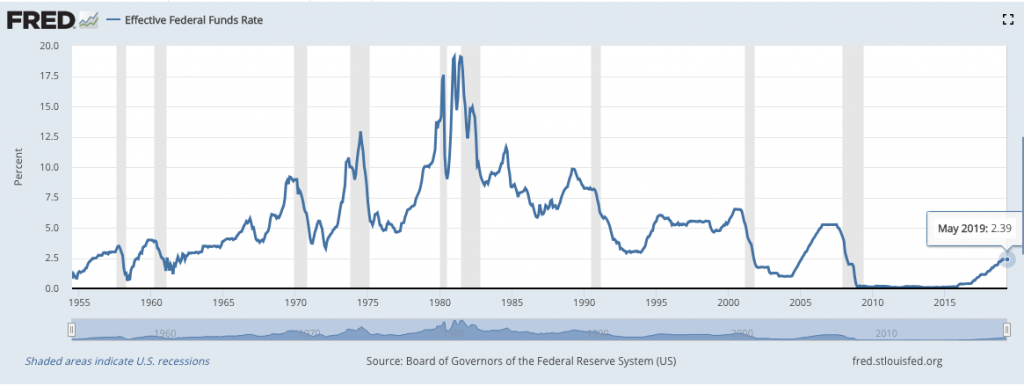
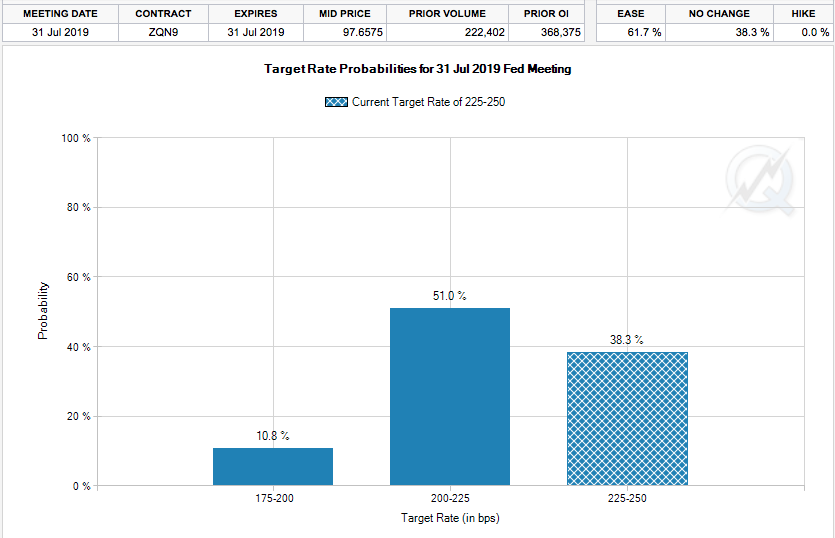
The offshoot of declining yields as a result of slowing economic growth and trade war fears has seeped into the markets by way of forecasting the probability of a future rate cut. It was only a couple of months ago that a single rate cut was being priced into the market by December 2019. With escalating trade feuds and waning global PMI data, the market is now pricing in 2 rate cuts and a greater than 60% chance of a rate cut of .25 bps as soon as July 2019.
Finom Group suggested just this weekend that if the rate cut projections were to come to fruition, Fed officials would need to adjust their messaging post haste.
“The market is clearly calling for a Fed rate cut if not 2 cuts by year’s end. Such a move would also demand a shift in the Fed’s language in the very near future if not the very next FOMC 2-day meeting.”
Given our analysis and the market increasingly pricing in a Fed rate cut, the Fed is doing just as it should; the Fed is beginning to discuss a rate cut. James Bullard, president of the St. Louis Fed, said the resolution of trade conflicts is likely to be more difficult than previously believed, a development that could chill business investment and add pressure on a U.S. economy whose growth has already waned since last year.
The Fed “faces an economy that is expected to grow more slowly going forward, with some risk that the slowdown could be sharper than expected due to ongoing global trade regime uncertainty,” Bullard said in a speech in Chicago.
Aside from the trade disputes, Bullard said the case for a rate cut was also strengthened by persistently low inflation below the Fed’s 2% target. He contended that a recent inversion in the Treasury yield curve suggests the current level of interest rates is “inappropriately high.”
Last week, Fed President Rafael Bostic mirrored Bullard’s comments and these suggestions of qualifying rate cut decisions was also considered by another Fed member on Tuesday. Trade uncertainties are high on the minds of investors and businesses, but they’re not the only risk facing the U.S. economy right now, said Mary Daly, president and chief executive of the Federal Reserve Bank of San Francisco.
The global economy is slowing and the circumstances surrounding how the U.K. eventually leaves the European Union have also affected economic activity, Daly told CNBC’s “Street Signs” on Tuesday. “I don’t want us to get too focused on only trade when there are these other looming uncertainties that also need resolution.”
Daly said for now, the biggest risk facing the U.S. economy is uncertainty affecting business sentiment. She warned on Monday that the American economy — which is the largest in the world — could be in danger if business sentiment and economic data end up “getting out of sync.”
“What really keeps me up at night is the data and the mood getting out of sync and, eventually, the possibility that the mood becomes the self-fulfilling prophecy of the data. In December last year, economic data releases were “good” but the mood among investors and businesses was “bad.”
With the aforementioned messaging already starting to change from the noted Fed Presidents, more Fed messaging will likely prevail on Tuesday. Fed Chair Jerome Powell speaks Tuesday, and Fed Vice Chair Richard Clarida will appear on CNBC.
In speaking directly on the 10-year retreating throughout May and into June, many analysts have taken down their forecast for rates and the 10-yr Treasury bond specifically. J.P. Morgan Chase strategists cut their forecast for the benchmark 10-year Treasury yield to 1.75% at year-end, after President Donald Trump’s threat of tariffs on Mexico prompted fears that the economy will weaken further and the Fed will have to cut rates this year. The firm’s prior forecast had been 2.45 percent.
- “Until recently, our base case scenario was that the increase in tariffs would contribute to a further slowing in capex spending this year but that it would not translate to an outright deterioration in the economy. However, trade related headwinds to the growth outlook have continued to build, and our economists believe that the latest developments this week are likely to have lasting damaging effects on business confidence and should thus prompt the Fed to respond.”
The analysts said the firm expects a 25 basis point rate cut in September and another in December. The firm also trimmed its third-quarter GDP forecast by a quarter point to 1.5% growth. It expects second-quarter growth of 2 percent.
Jim Caron, portfolio manager at Morgan Stanley Investment Management, said he sees the 10-year falling below 2% on heightened uncertainty, but not way below, since he is also not anticipating a recession. But he, like others, says the bond market is now reflecting a much slower growth environment than some forecasts might reflect.
- “1.85/1.90 to me is within the realm of reasonableness. There’s no magic numbers here. It’s really a question of if you downgrade growth, downgrade inflation expectations, your Fed expectations and risk premia. All of that is pointed down for high quality fixed income, so prices are going up.”
Strategists said the fact that the Mexican tariffs are not tied to trade issues makes them even more random, and risky.
- “It shows that he sees this as a tool that can be used for broader policy purposes, and you can have a trade agreement in place, and he will still feel like it’s appropriate to make a one off adjustment to tariff policy. And he’s relatively unchecked on the grounds he’s using these tariffs,” said Mark Cabana, head of U.S. short rate strategy at Bank of America Merrill Lynch.
“The bottom line is all of this makes it difficult to be an investor because I am now looking at extraneous items, outside the market. To make an informed economic decision, which is making it very difficult [and] why you become more defensive. You raise more cash and you basically start to become more defensive.”
But in terms of the President using tariffs as a tool, even members of the Republican Party are beginning to push back on this exercise, which has been fully implemented yet but is threating to be pushed forward, against Mexico and the U.S. importers, by June 10, 2019.
Officials in both parties as well as trade experts told POLITICO Monday that the president may have to declare a second national emergency in order to invoke trade powers under the International Emergency Economic Powers Act.
And just as Congress voted to block Trump’s first national emergency to fund his border wall, lawmakers may be able to vote to overturn any new tariffs that Trump imposes.
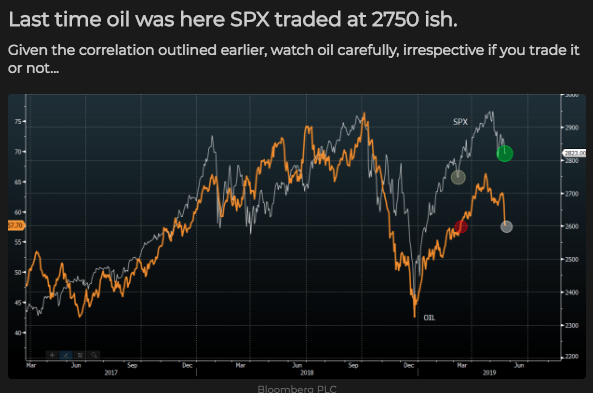
With the possibility of thwarting new tariffs by acts of Congress and/or Senate, the U.S. equity futures markets are pointing to a sharply higher open on Tuesday. Having said that, the trading day has many hours ahead of itself and even with futures and bond yields rebounding, crude oil prices continue to tumble lower in the early morning. As many market participants recognize, there remains a high correlation between the price trajectory of crude oil and the S&P 500.
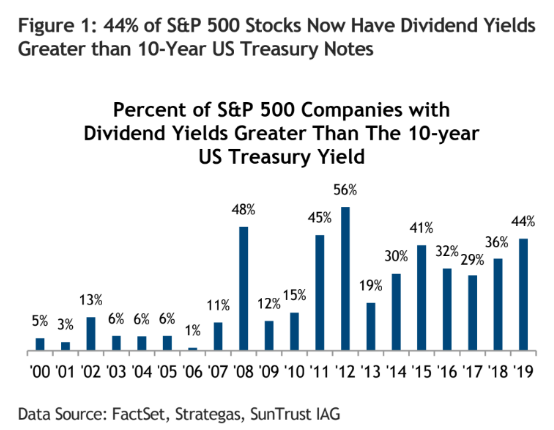
With all the focus on rate cuts and yields falling, there are some benefits that may prove to backstop equity market declines near-term. The hunt for yield is always a real exercise among portfolio managers and as bond yields fall, the yield becomes less attractive, assuming equity yields remain higher. Keith Lerner, chief market strategist at SunTrust Advisor Services, says stocks are still attractive compared with bonds because equity dividends are richer. He said, “44% of stocks in the S&P 500 now have dividend yields above that of interest rates. This compares to just 26% a year ago and is among the highest levels during the bull market.”(See chart below):
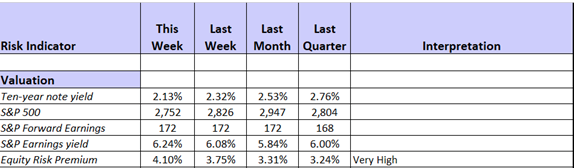
We can review the same hunt for yield and where the greatest yield is presently residing with respect to risk premium in the following table by Jeffrey Miller of NewArc Investments.
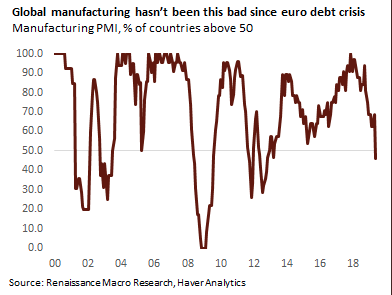
As mentioned earlier, PMI data has weakened around the world in 2019. This is a sign of economic growth slowing with trade feuds escalating and resulting in curtailed business spending, as sentiment wanes. Mary Daly noted the factors surrounding the self-fulfilling prophecy and as the trade feuds escalate, we are seeing the early results for a potential self-fulfilling prophecy at play and with global equity markets in retreat through May. Not all countries have reported PMI data, but global manufacturing PMIs are not having a good month. In May, just 46% of countries tracked by Renaissance Macro have PMIs above 50, the lowest since 2012. Based on this breadth measure, global manufacturing is contracting for the first time seven years.
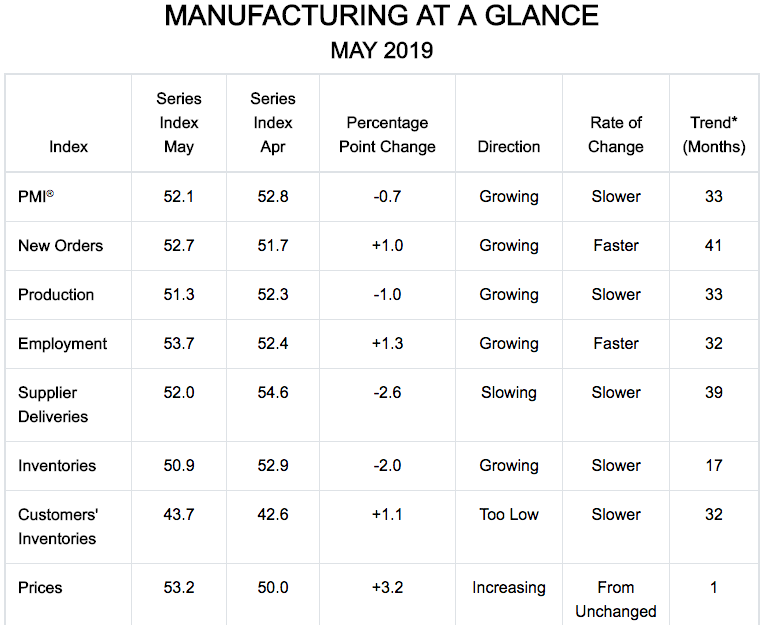
With respect to U.S. manufacturing data, the picture is somewhat mixed but has weakened in 2019. The Institute for Supply Management said its manufacturing index slipped to 52.1% last month from 52.8% in April. Economists surveyed by MarketWatch had forecast the index to total 52.6 percent.
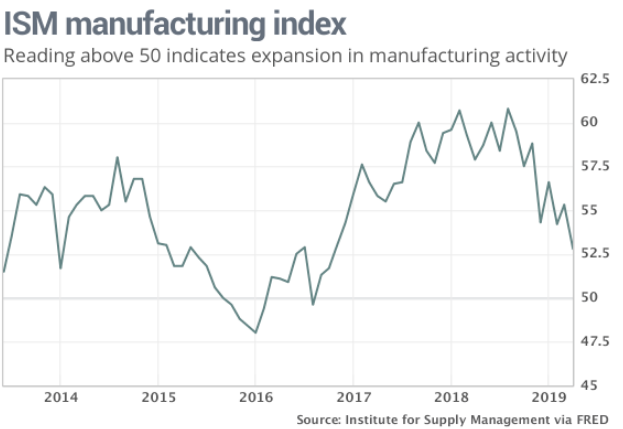
The index has fallen to the lowest level since the month before Donald Trump was elected president.
The production index slipped to 51.3%, the lowest reading since August 2016. The index for supplier deliveries fell to 52% from 54.6 percent. Yet new orders rose slightly, taking some chill out of the report, and employment also rose.
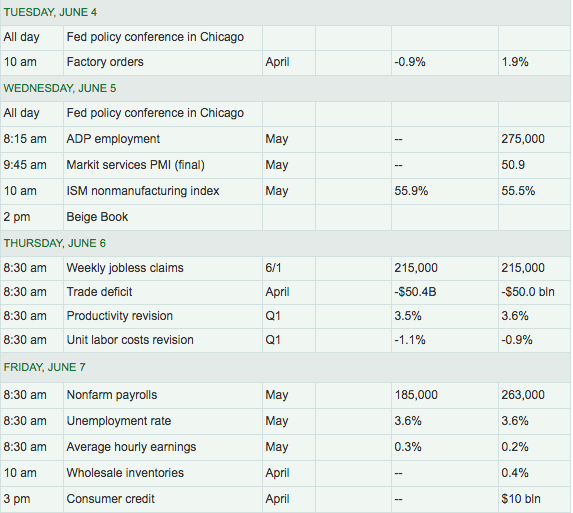
Tuesday’s economic data schedule is light, with just Factory Orders on the docket. Most investors will be maintaining a watchful eye on crude and the bond market in order to gauge outcomes in the equity markets. Additionally, all ears will be honing in on additional messaging from Fed officials regarding rates and the economic outlook. There remains a healthy and relevant amount of economic data due out later this week and culminating with Nonfarm Payroll data on Friday.
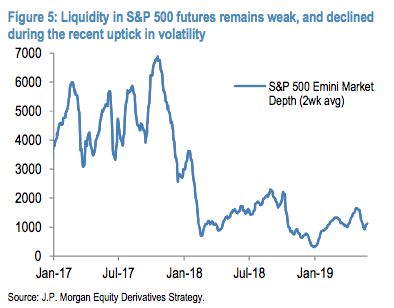
Regardless of all the noise and market movement on Monday, the VIX actually rose only .15 points to 18.58 and has been declining on Tuesday morning. Market liquidity conditions remain weak in 2019 and through May, declining in response to the pickup in volatility this past month. This limited liquidity is helping drive larger price moves on limited flows (e.g., the market is down ~6.5% from its peak despite limited deleveraging).
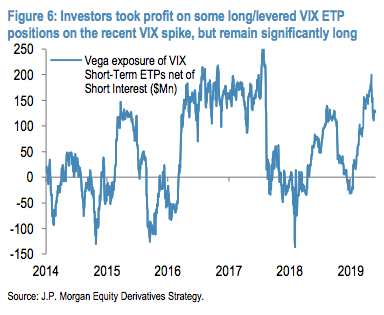
But even with market liquidity remaining at relatively low levels, the VIX spikes have been muted. VIX-ETPs have seen positions pared this month, but remain significantly long when compared to short positions (VEGA). As we discussed in past notes, we expected investors to take profit on (what were, in April) very long VIX positions on any VIX spike, and these unwinds would be a headwind to the spike itself. Conditions played out to this forecast so far, with ~$750Mn withdrawn from long and levered VIX-ETPs since Trump’s May 5th tweet, as the VIX spiked into the low 20s, but has yet to revisit those levels since and even with greater market declines.
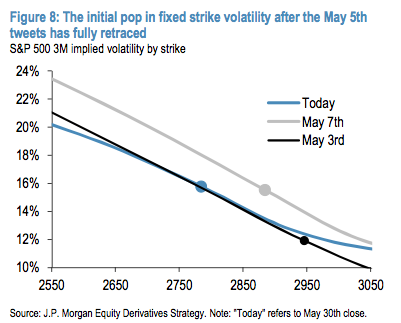
S&P 500 implied volatility increased following the re-escalation of the trade war and transition to a short gamma regime, with most points along the S&P 500 VOL surface trading near their top quintile over the past 3Y. Put wing skew flattened over the past few weeks, as the increase in fixed strike VOLS shortly after May 5th has fully retraced, but the downside tail was re-priced lower as shown in the following chart from J.P. Morgan Chase’s quant team.
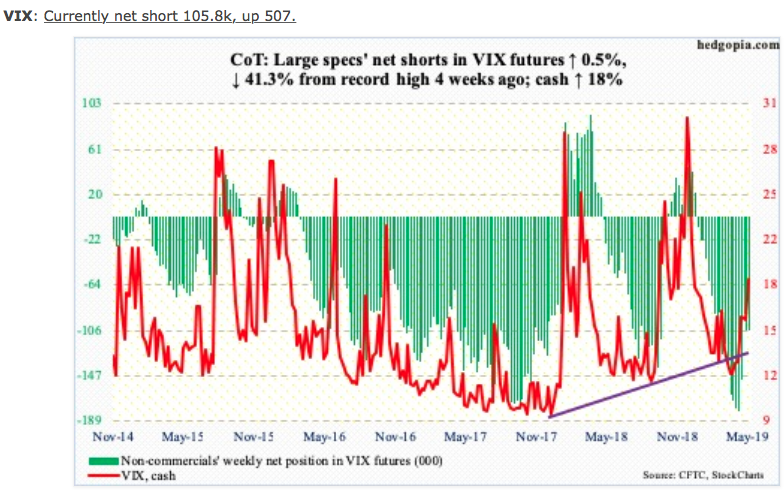
With all the angst and hyperbole surrounding noncommercial VIX futures short positioning in April surging to record levels, such positioning has relaxed of late. A good many short VIX futures positions have been disposed, without proving out another Volmageddon-like event as was heralded by Sven Henrich.
Did the VIX rally in May and more than 2 months after Henrich’s warning, yes. Was it as fearful an event as characterized in his warnings, no! While Henrich’s errand exercise of charting an oscillating, stochastic process is known, Finom Group recommends analysis on the total VIX complex positioning, which tends to offer a better forecasting track record for what proves to be the inevitability of a VIX spike. And with that being said, Finom Group continues to trade what the market delivers and Monday delivered some realized market volatility as VIX-ETPs moved up, down and all around. Our latest trade is indicated in the screenshot below and delivered to Premium members via our private Twitter feed.
While the market appears to be aligning for the hope of interception of future tariff implementation, investors shouldn’t perceive the pre-market open futures as a “tell” on the totality of the trading day. We anticipate another roller coaster day in the markets.


