
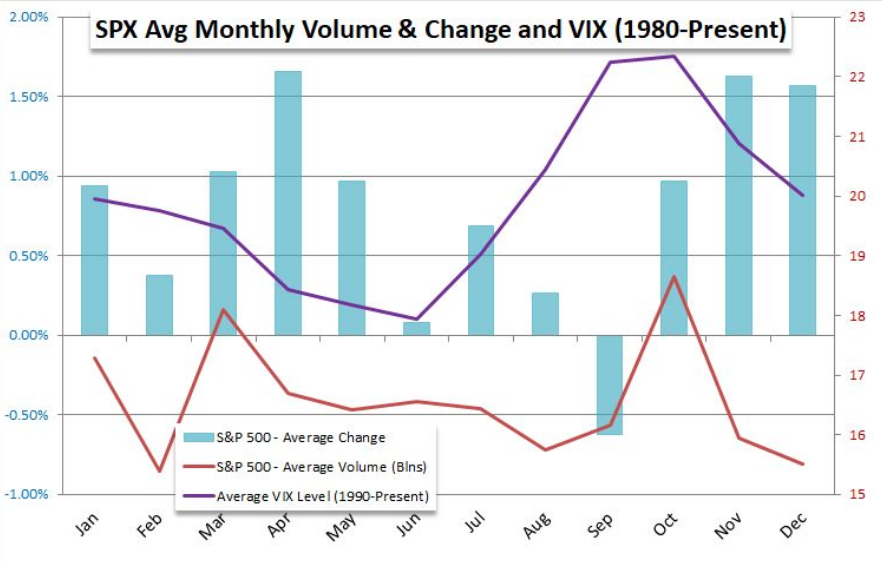
A strong market rally the last few trading days of September and through the first week of October has been the result of investors possibly looking through the typically volatile October month and post the November 3rd election. Maybe, possibly, perhaps? Nonetheless, October has gotten off to a strong start. In looking at the chart below, we can see that October is not a bad month for stocks, despite some outsized market downturns that have taken place in October in decades gone by. The VIX, like the S&P 500, tends to have wild October performances as well.
Despite recent market performance as the monthly calendar turned from September to October, we can’t dismiss the historical data and we should reference the election year data. Historically, October is the worst month of the year for stocks during an election year. But this is 2020 folks, right? We’re beyond Thunder Dome, right? (For you 1980s movie buffs)
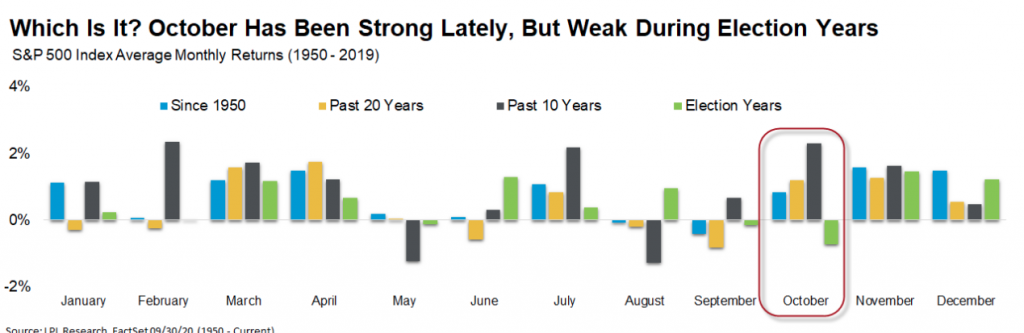
The chart above from LPL Financial does suggest that even as the market has started strong in October 2020, it may not end up that way. If one listens to their daily newsfeed, they are more inclined to look at the strong start as a bull trap as well. I’d offer that investors shouldn’t allow the daily headlines to dictate their positioning in the market, and investors would be better off looking through the near-term trees and focus on the long-term forest for the trees. And look at what happens with a minor adjustment to our time frames in the chart below:
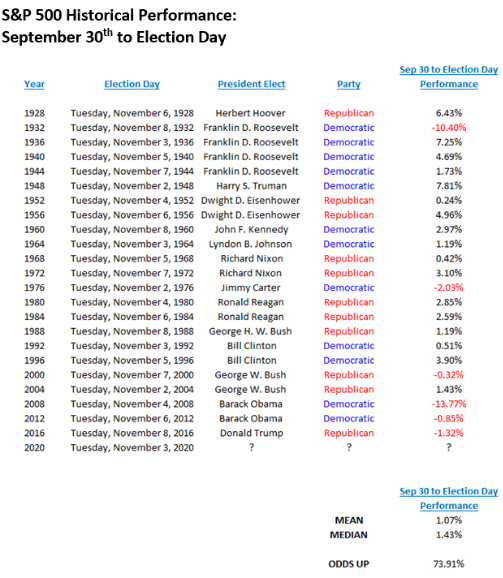
See what happens when we move slightly beyond October election years? Elongate your time horizon and the benchmark returns prove more favorable.
October, for the stock market and investors, is known as Jinx Month and has historically carried the label of the Surprise Month. The term “October surprise” dates back to Ronald Reagan’s 1980 campaign associated with the Iranian hostage crisis; but there has been a long history of notable news events late in election seasons, including:
- Gore vs. Bush contested election in 2000
- Indictment of Reagan’s Defense Secretary Weinberger associated with Iran-Contra in 1992
- Nixon’s Secretary of State Kissinger declaring he believed “peace is at hand” re: Vietnam War in 1972
- Lyndon Johnson halting U.S. bombing of North Vietnam in 1968
- Israel’s invasion of Egypt in 1956
- Assassination attempt on Teddy Roosevelt in 1912
- Hamilton’s denunciation of Adams in 1800
Since we’re in an election year, let’s focus on what many investors are greatly considering going into and through the election. Is the incumbent going to win reelection or are the Democrats going to sweep and rule over a unified government. The latter poses some fears for investors, given the potential for taxes to go up, but let’s keep in mind that there are always offsets to most any policy that proves a headwind for the economy and/or the stock market.
Moreover, even with a Democratic sweep, if the Senate majority is only slightly in favor of the Democrats, the filibuster rule may prevent meaningful change to tax policy. In fact, at this stage, the Senate race is close to a toss-up based on recent polls/analysis. In terms of the filibuster, Democrats may vote to eliminate it; but there is a lack of unanimity among Democrats for the collection of tax proposals, while many of the tax proposals don’t affect the majority of taxpayers.
Regardless of who wins the election, even if contested after the November 3rd date, investors shouldn’t find themselves investing along party lines. Leave that bias to other lifestyle factors. Having said that, the historic data of who sits in the White House is pretty clear. Since 1900, the stock market has performed better when Democrats sit in the White House than when its inhabitant was a Republican.
As you can see in the first two bars in the chart below, if an investor had invested $10,000 starting in 1900, but only had it in the Dow when Republicans were president, it would now be worth nearly $99k. On the other hand, that same $10,000 would have grown to nearly $430k if it was invested only when Democrats were president. Seems like an obvious decision to make then? Look closer! That same $10,000 in 1900 would have grown to more than $4.2 million if the investor had remained in the market the entire time, regardless of which party has presidential power.
Staying Invested vs. Investing in Single Party

Just stay invested folks. The average trader is likely going to do themselves more harm than good by trying to hedge for any potential election period volatility, drawdowns and roller coasters in the market that may come thereafter. Weather the storm and understand the nuances that will normalize into 2021. But for those of you who want more details on the markets performance/President…
The table below shows every president since 1900, color-coded by their party affiliation, and the Dow’s performance during all four years of each election cycle. Don’t just look at the averages at the bottom though; look at the range of outcomes. Assuming you know your history, it’s clear that there have been significant impacts on market performance that had little-to-no relationship to the party in the White House (some examples include WWII, the Crash of ’87, 9/11 and the Global Financial Crisis).

Picking up on our former topic of a potential Democratic sweep…. Now let’s simply assume, let’s assume that Biden wins, taxes go up and everyone’s perturbed in the short run that taxes would rise. This table from Societe Generale suggests the impact on the S&P 500 if Joe Biden won the election & the Democrats swept both houses of Congress.
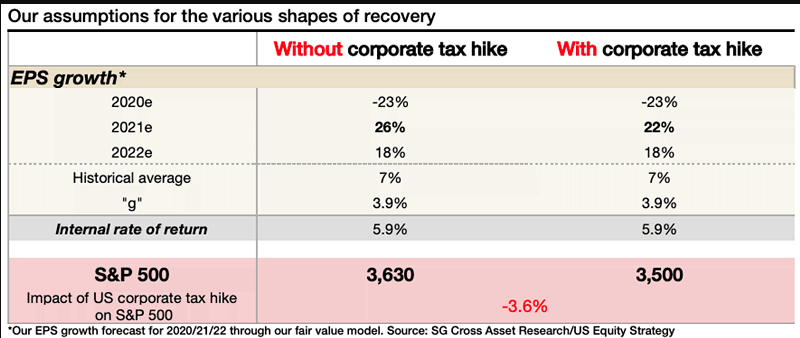
Again, that’s assuming Joe Biden wins and there is a Democratic sweep of both Houses. Does it look so bad when we look at the potential earnings drawdown for 2021 of roughly 4 percent when compared to no tax hike? I’d be ok with a 4% impact to EPS in 2021 and no impact thereafter. More than likely, however, this won’t even prove to be the outcome as offsets to the tax hikes such as economic stimulus and the removal of tariffs would buffer the impact from higher taxes.
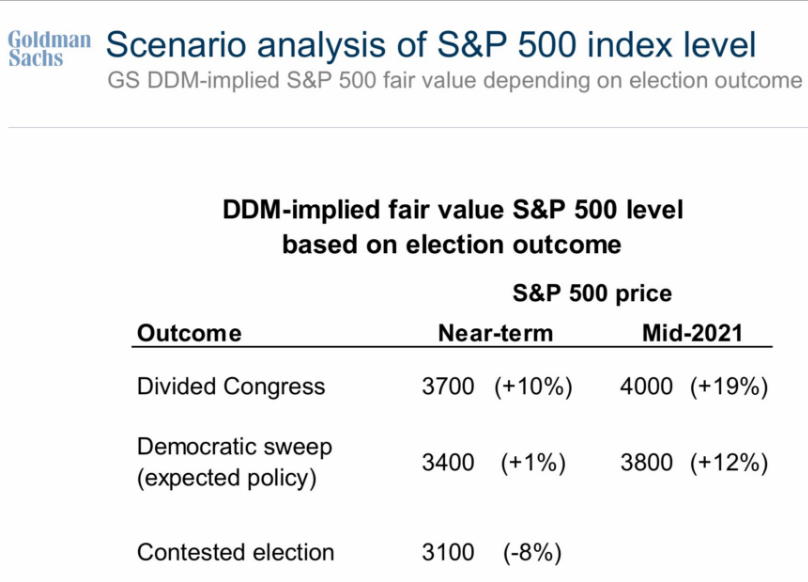
For those of you who want a little more detail here’s the latest projected post-election market performance from Goldman Sachs’ model:
Everyone is going to have an opinion about the election, the potential heralding of a chaotic outcome and its impact on the economy and market. Here’s the real truth as defined in the historical data and in the following comment: We’ve often said that the economy impacts elections more than elections impact the economy. The data simply doesn’t lie in this regard!
The table below looks at every election year since 1900 and whether there was a 20% stock market decline and/or an economic recession (yellow for yes, green for no).

There were 14 election years during which there was a bear market and/or a recession. In nine of those cases, the incumbent president lost the race, while a lesser five were won by the incumbent. All six election years since 1952 that were accompanied by a bear market and/or a recession saw the incumbent lose. This does not bode well for the incumbent in 2020, which had both a bear market and a recession a few short months back.
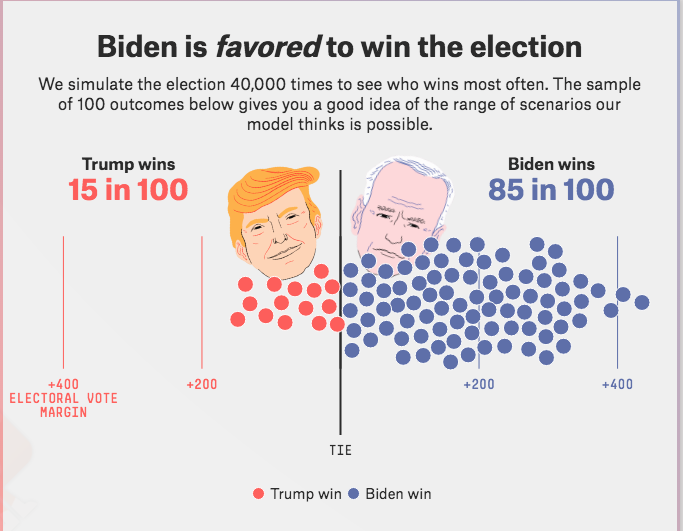
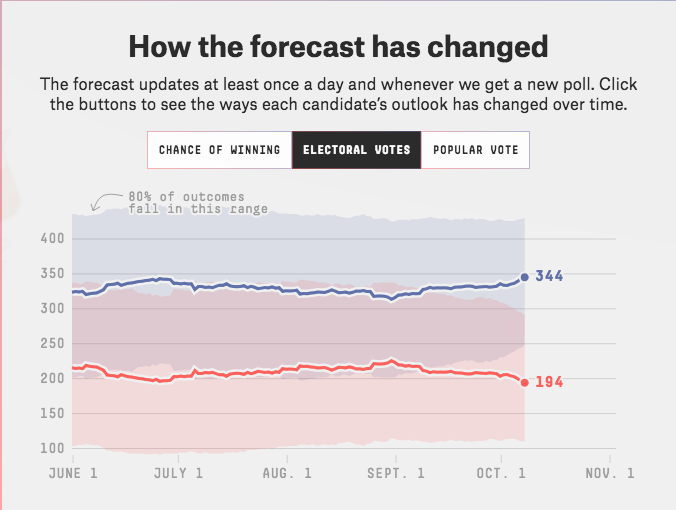
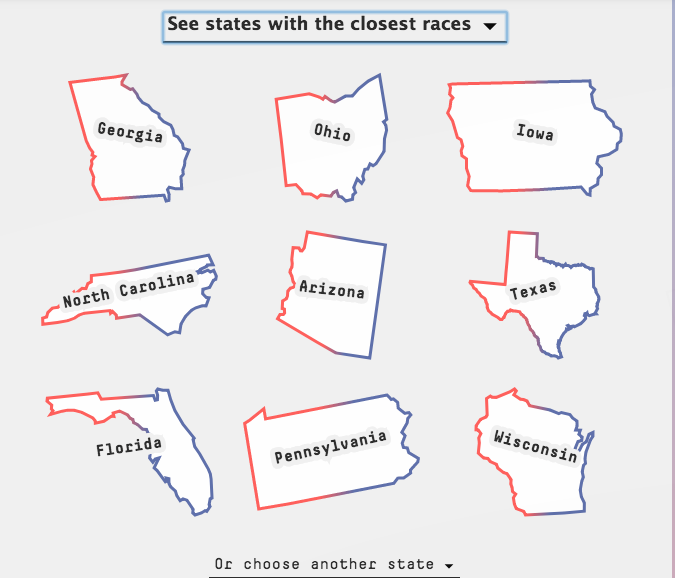
In looking at a wide variety of polls to-date, there does appear to be a strong lead for the challenger, who is also seen flipping key battleground states. The following polls were generated through the popular voting aggregation site fivethirtyeight.com .
You can avoid all of this noise by simply recognizing that the market, regardless of who the President and what party holds which house, moves higher over time. Politics don’t play a large role in the market but for brief periods.
With each dip in the market, investors are delivered a market message. I certainly hope investors have heard that message for each dip/consolidation. On Tuesday, we saw what happened when the market responded to the headlines. Keep in mind that investors didn’t respond, the market did by way of algorithms.
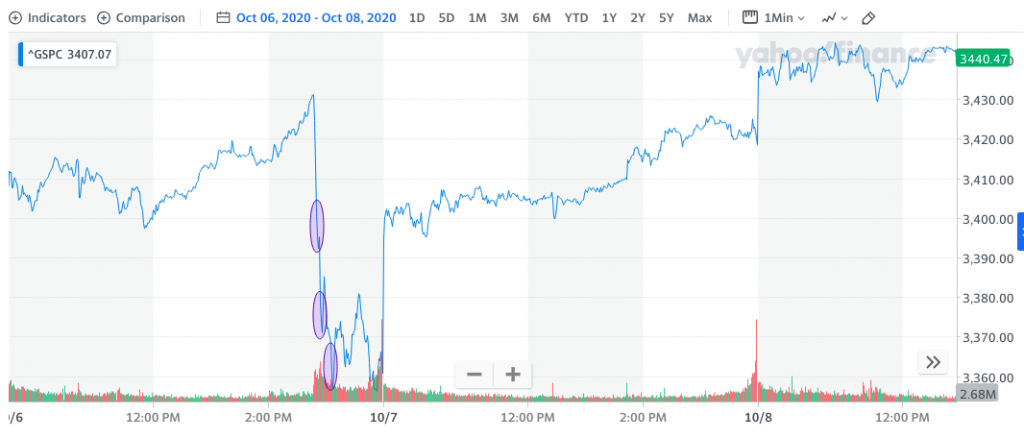
As discussed on Wednesday, in our recent article, “The tweet and decision by the President confounded many and found algorithms at work once again. We can see a similar, but more precipitous, 3-wave algorithm footprint in the S&P 500 having triggered on Tuesday afternoon.“
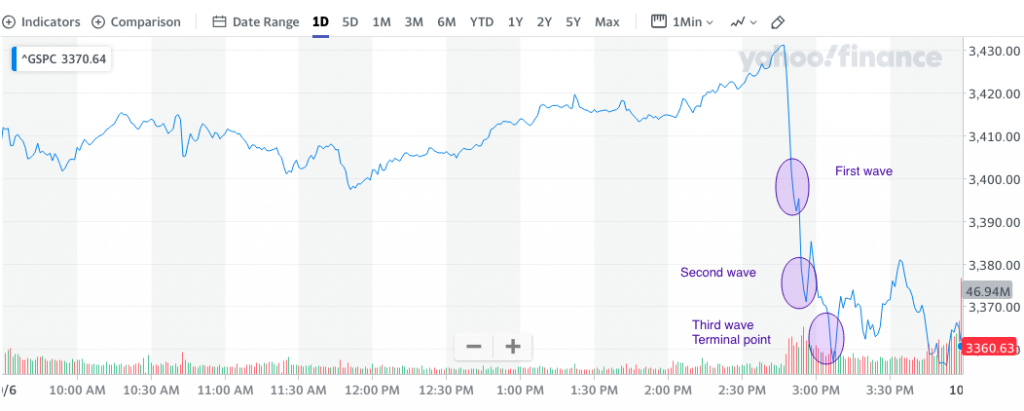
After the dip on Tuesday afternoon, what happened next was only surprising to those who hadn’t been reading the market’s message for months now. Keeping in mind that breadth leads price and the S&P 500 A/D line just made a new high, the market quickly recaptured almost all it had lost from the aforementioned decline during the following trading session.
“Yea but that’s because Trump said he would accept a skinny bill for personal checks and $25 billion to bailout the airlines. That’s why the market rallied the next day and Thursday.”
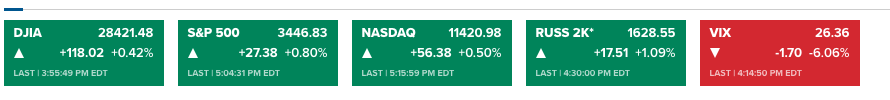
It’s funny how just 2+ weeks ago everyone was convinced that SoftBank’s tech-whale trades were why the market had rallied from July through August, Now the rally, and since there has been no headlines on SoftBank or anything else to fill the void, it must be that the market is rallying on hopes of fiscal relief. Where one news story cycle leaves off, another one attaches itself to price action. And let me remind investors that over the last 2+ weeks of negotiations between the House Speaker and Secretary Treasurer Steve Mnuchin there has yet to be one positive development; not one! Where’s the logic in suggesting the markets rebound and resumption of the uptrend is due to a lack of positive fiscal relief efforts. Furthermore and as it pertains to a “skinny, targeted relief bill”, the House Speaker declared today that there would not be such a bill without a more broad relief bill to come thereafter. Does that sound like a positive development? Nonetheless, equities finished at the HIGHS of the day and the VIX, the so-called fear gauge, finished at the lows of the session.
These are the markets’ messages folks. The market is willing to see through the noise, the headlines, the uncertainty and trust that the upcoming earnings season will prove strong. The market is willing to trust that another fiscal passage will be forthcoming, if not before the election than as a result of the election and possibly slowing of economic growth in the Q4 2020 period. The market can be proven wrong, but that is a rarity despite the pundits drumbeating of errand price action week-after-week.
The market has also been sending messages on down days and in the way of market leadership, something I encourage investors to monitor during all market conditions and especially coming out of a bear market. As Finom Group offered in its weekly Research Report to subscribers/members, we desire to see small caps lead the way out of a bear market. That is historically how new bull markets are formed and validated.
“I like to see small-cap index outperformance as it tells a tale of the index, which is heavily weighted by Financials, performing as we expect coming out of a bear market and/or recession. Small caps tend to lead, not lag. If we go all the way back to the bear market trough in March, is this what we see taking place from the small-cap index?“
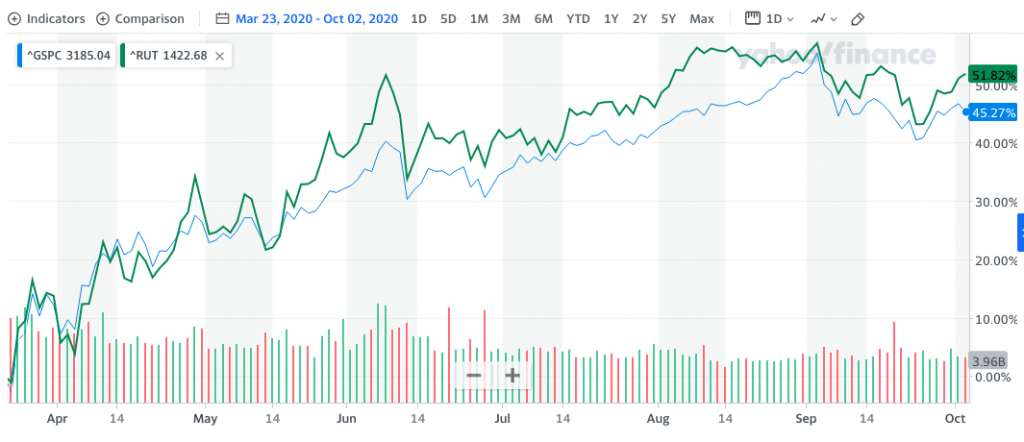
As we can see from the S&P 500 and Russell 2000 index performance since March 23rd, the Russell is leading the large-cap index by more than 6 percentage points.”
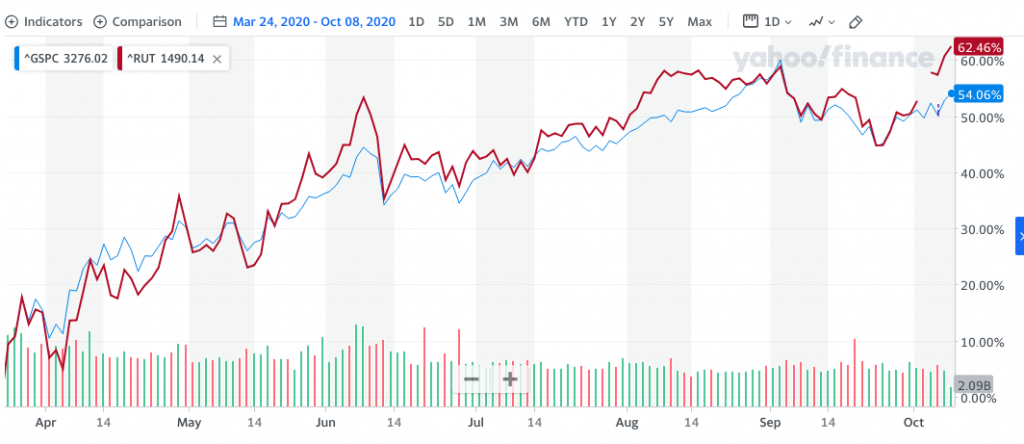
If we fast-forward to Thursday, we can see that small-caps have continued their outperformance with respect to its large-cap brethren. The performance spread now favors the Russell 2000 by more than 8 percentage points.
Coming into Thursday’s trading session, the Russell 2000 has rallied more than 10% in just 10 trading days. That’s the strongest 10-day rate of change for the index since the Spring and coming off the COVID crash lows, according to Bespoke Investment Group. While there have been plenty of other instances where the Russell 2000 saw a stronger 10-day rate of change, what makes the current period unique is that while most big rallies in the Russell 2000 have come after sharp declines, that wasn’t the case this time around. (See below from Bespoke Investment Group)
“The lower chart shows the Russell 2000’s 10-day rate of change going back to the start of 2018. In the rally off the March lows, the Russell 2000 had previously been down more than 30% over a 10-day period, and before that the 10%+ rally in early 2019 followed what was a 12% decline just before. The most recent rally, though, has been different. At no point in the last 50 trading days has the Russell 2000’s 10-day rate of change seen a decline of more than 5%. In other words, while most prior big short-term rallies have been a snapback from a prior decline, there was no big drop to snap back from this time around.”

Small-caps are sending a message to investors. But there’s more that relates to the large caps for investors to uncover/discover. I often look for breadth to validate a market move. Does it have to, no! Price is what it is and during an uptrend breadth is of lesser consequence than when the market is downtrending. Recall that the market recently put in an interim top on very good/strong breadth. With that being said, as the market has rebound from a September low of 3,206, it has done so on improving breadth.
Keeping in mind that the S&P 500 never broke down to its 200-DMA and found support around the June highs of 3,230s, the percentage of stocks trading above the 200-DMA have had the opportunity to increase with the indexes rebound. That is exactly what has taken place.
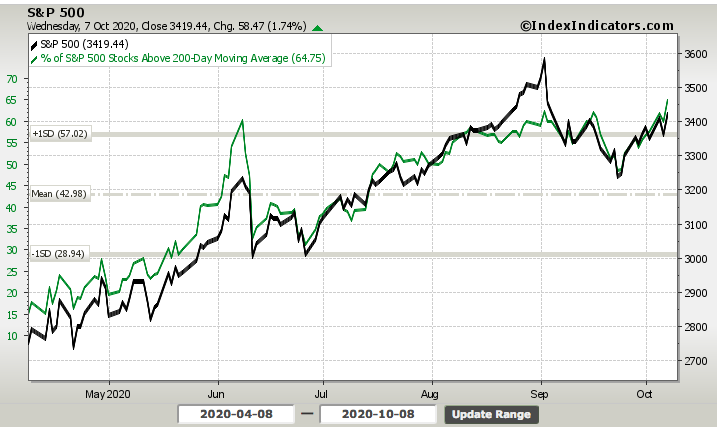
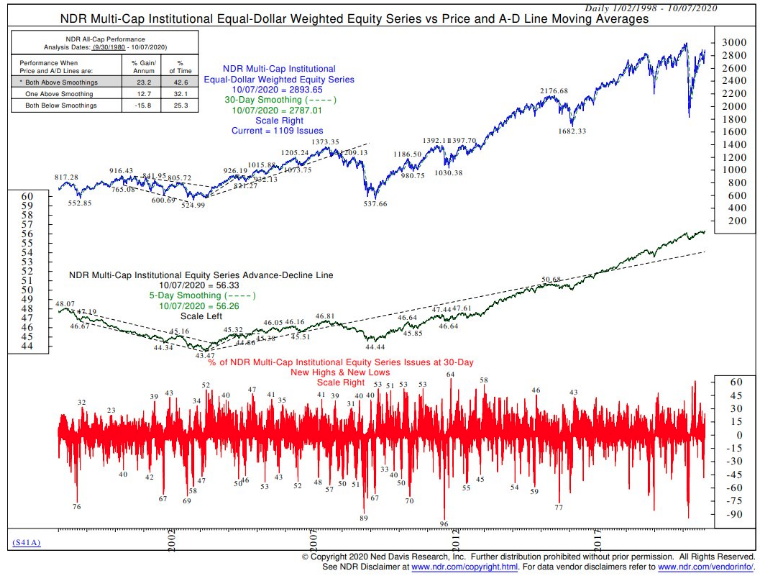
A closer look at the chart representation of breadth above identifies that Wednesday’s market close came with the percentage of stocks trading above their 200-DMA at a post bear market high. This resumption of the uptrend is taking place with many stocks performing, not just a handful but bucketsful of stocks. Well look at that, bucketsful is a word! Nonetheless, Ned Davis Research’s Ed Clissold offered the firm’s own breadth indicator with the following commentary to boot:
“Our common-stock only Advance/Decline Line hit a record high on Thursday. Hard to call the technical action of the last few days anything but bullish.”
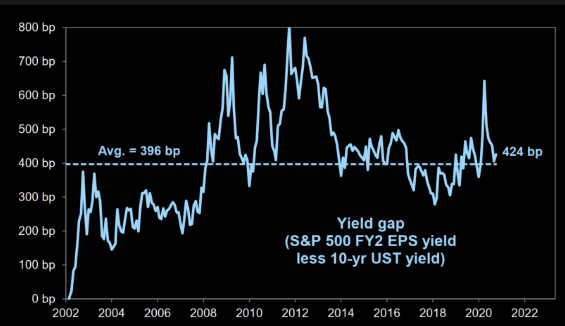
We can run through a goodly amount of breadth indicators, but trust that most represent the same as that from above. And don’t get me wrong, I get it. The “it” doesn’t seem appropriate given all the event risks abound. The it, buying stocks and markets near all-time highs just doesn’t seem right. What I think many investors overlook is the variety of fiscal and monetary supports that remain in place, regardless of the need or want of more fiscal support. Couple that with relative value and… and believe it or not relative valuations of equities is still attractive versus history. Ludicrous you say? Take a look at the following chart from Goldman Sachs which identifies the S&P 500 earnings yield gap vs. the 10-year Treasury yield as being above average. Valuations are never absolute and always relative. In other words, stocks are expensive or cheap compared to “what”?
There are no NEAR-TERM guarantees the market can provide! The so-called analysts, strategists and proposed experts don’t know anymore about the near-term than you or I. When price is bearish, they turn bearish. When price turns bullish, they turn bullish. This is true despite their most ardent credentials and leveraged experience. Case in point is a recent YouTube presentation from StockCharts own David Keller CMT.
See the title? Four minutes into the video, Keller outlines his belief that the market would break 3,200 before breaking above 3,400 again. The video was recorded a week ago, with provided link. Keller didn’t quite get this call right, but it serves my point to emphasize that even the “experts” are often wrong. With that, let’s put a pin in things and close out this daily market dispatch with a last word on fiscal relief negotiations from LPL Financial as follows:
“A compromise on a big stimulus package in Washington could potentially deliver another October surprise, but the odds are against it as Election Day approaches,” said LPL Financial Equity Strategist Jeffrey Buchbinder. “The optics of getting nothing done aren’t great on either side, and there are a lot of close Senate races right now, suggesting there still may be a glimmer of hope for a deal by November 3.”
Still, there is bipartisan support for a deal, moderates on both sides of the aisle are pushing for it, and the need is clearly there (ask Federal Reserve Chairman Jerome Powell), so we remain hopeful that something is passed this year. Unemployment remains near 8%, and many families and small businesses are still reeling from the effects of the pandemic that are not going to end soon unfortunately.
Looking beyond the election, we see these scenarios as reasonable possible outcomes:
Trump wins and Republicans retain the Senate. A deal similar to the Republicans’ offer around $1.5 trillion would be likely but far from assured.
Democrats sweep but keep the filibuster in place. A deal in the $1.5 to $2 trillion range becomes very likely. Without the filibuster, a potential deal may get even bigger.
Biden wins but Republicans retain the Senate. There is a risk of no deal at all in this gridlock scenario, though moderates may come through with a “skinny” deal.
Republican sweep. This scenario would almost certainly lead to a skinny deal including supplemental jobless benefits, small business aid, corporate liability protections, and some COVID-19-related funding. We view this as the most unlikely scenario given Democrats’ stronghold on the House this cycle.
Finally, for those looking for a bill to pass in the lame duck session of Congress if Biden potentially wins, we would argue that the Democrats may wait until Biden takes office to attribute it more to him.


