Forward-thinking investors are likely to perform better than those who are adversely affected by the headlines of the day. While many will be whipsawed out of positions, lose confidence in the trajectory and trend of markets, it’s the calm and rationale investor who maintains a longer-term focus that will likely extrapolate the better discipline and profit from the market. With that being said, headlines have done their best to create poor trading disciplines in recent days and with positive COVID-19 tests littering the White House Administration as well as fiscal relief negotiations falling apart. I have looked at both developments with a “glass is half full” approach, as I believe the noise will subside and markets will ultimately realign to trend with earnings growth trends.
With respect to the recent POTUS and FLOTUS positive COVID-19 test results, I’ve previously disseminated that this should prove a glass half full outcome. With the best theraputics in the world, a positive outcome for POTUS would likely encourage market participants given the success of such drugs. J.P. Morgan’s chief quant strategist Marko Kolanovic recently suggested much the same, but with another perspective:
“In light of recent developments, the positive COVID-19 test for the US President and First Lady, we are not changing our price targets or outlook across asset classes. Our equity outlook remains positive with a (scenario weighted) S&P 500 year-end price target of 3600. Our outlook for styles remains that value will outperform momentum and growth under any election outcome. And our view on sectors is that cyclicals will outperform also under any election outcome. The current development across various scenarios for the President’s illness slightly increases Biden’s chance of winning, which could marginally reduce post-election risks and market uncertainty.”
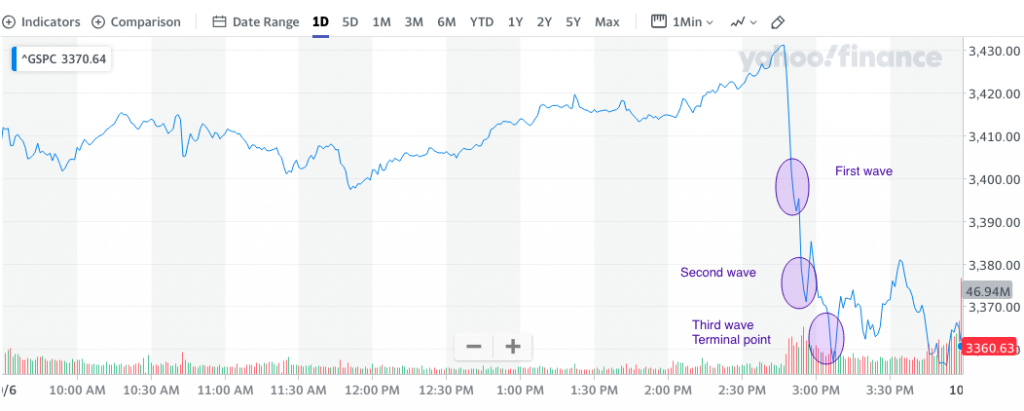
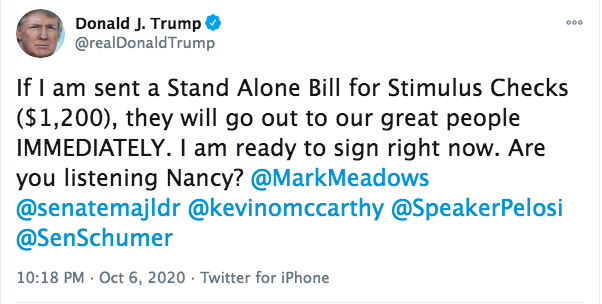
As we are now able to look beyond POTUS’ COVID recovery, given recent developments that find him without symptoms and back at the White House, we are forced to contend with fiscal relief headlines. Keeping in mind that their are always risks of exogenous market headlines, the fiscal relief headlines carry a consideration for algorithms. As we’ve come to recognize over the last decade or so, algorithms carry a significant weighting for market trading volumes and even trends. Algorithms are key-word and level coded (programmed) for the most part. They tend to express a 3-wave life cycle with a genesis, operative and terminal point. You can see how algorithms responded to the September 30 POTUS-COVID announcement in the chart below (left side 3-wave cycle down).
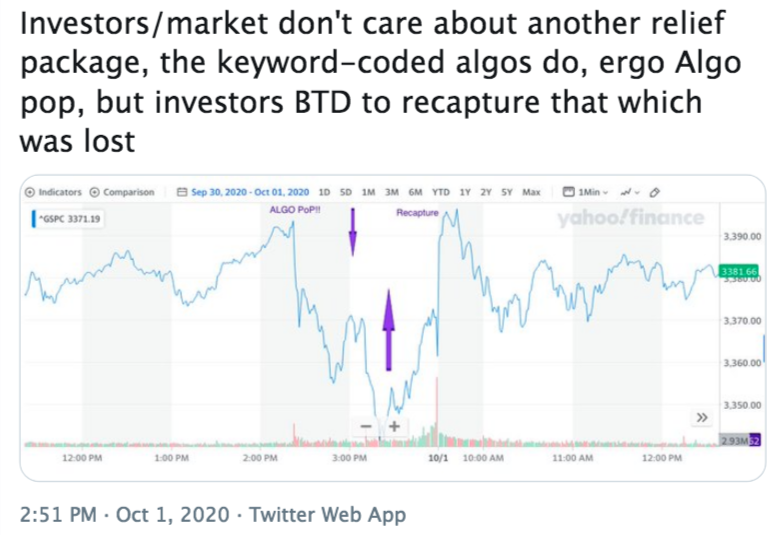
In the tweet screenshot above, we identify how fiscal relief negotiations rocked markets on September 30, by way of key words issued in headlines triggered algorithms. One can see the first wave, second wave and third wave market downturn and before the termination of the algorithmic life cycle. Post that point, more active human interaction found dip buying activity which recaptured that which was lost, and with a 2-day high price for the S&P 500 (SPX), the very next trading session. So while many will promote the idea that the market is affected by fiscal relief deliverance, this is true, but only because the algorithms are triggered through headlines. Investors, by and large, don’t care about fiscal relief as the economic data is not suggestive of “needing” fiscal relief, at least for the near-term. This is evidenced in the chart above, off to the left side, whereby active, human buying retraced every bit of price action executed by the algorithms.
The fiscal relief negotiation headlines once again plagued markets on Tuesday.
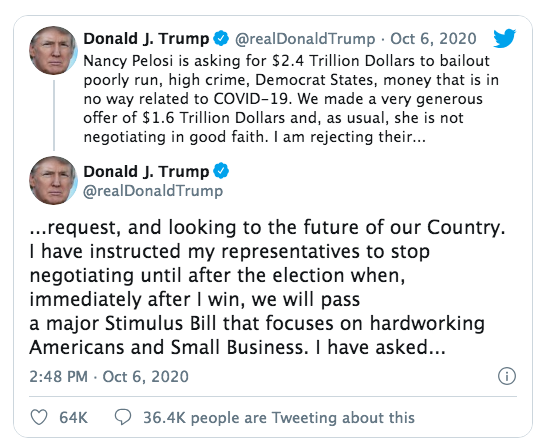
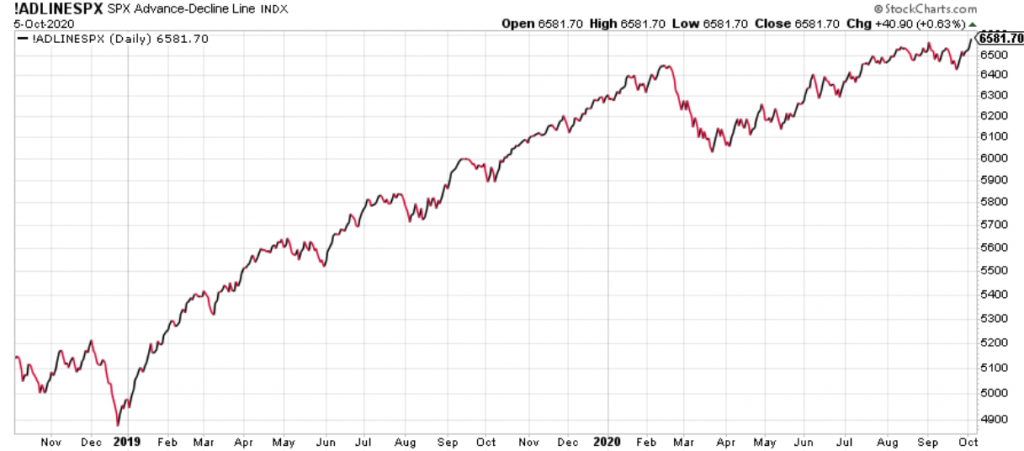
The headline, which broke just after 2:30 p.m. EST on Tuesday rocked markets, which had been benefitting from a resumed uptrend and after a 10%+ correction through the month of September. That trend resumption produced new highs for the S&P 500 A/D line on Monday.
A truism of markets is that for every market dip there is a market message for investors to extrapolate! Last Friday’s market dip offered investors a clear and concise message that Finom Group outlined in its weekly Research Report to members:
“It’s not often that breadth is higher by 2/1 positive in the NYSE, on a day when NASDAQ sinks nearly 3% percent. Industrials, Financials strength helped, but we saw a good push back into defensive sectors on Friday like Utilities and REITS, & this should be watched carefully, along with the late week Technology sector sliding and the Nasdaq once again finishing below its 50-DMA for the week. Nonetheless, take a look at the A/D performance on Friday for the NYSE and Nasdaq, on a day where the Nasdaq was deeply red!
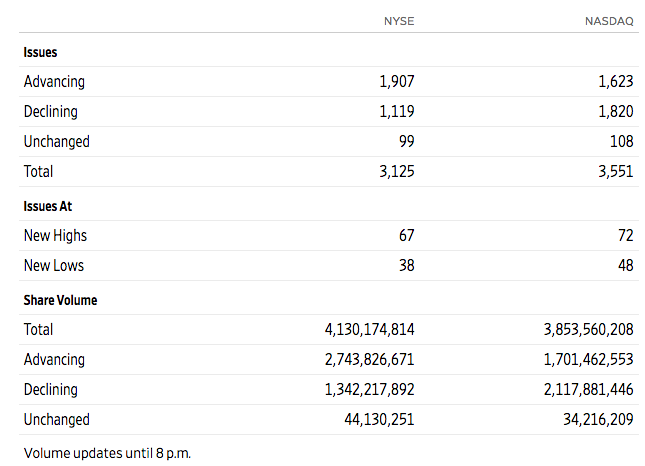
- The NYSE had nearly a 2/1 day with advancers greatly outpacing decliners and more new highs than new lows.
- The Nasdaq was down more than 2% on Friday, yet the A/D was almost even. There were also more new highs than new lows on the day.
- So while the markets had losses for the day, it’s clear that breadth was rally strong and the losses were NOT broad-based.
What took place under the hood of the indexes rebounding as a whole last week may have been more sector and style rotations. Cyclicals ruled the roost for much of the week, but by week’s end defensives came alive and technology took a backseat. Even as Friday’s market decline may have left investors less optimistic about the coming week, it should be recognized that small caps did not decline; the Russell 2000 (RUT) rose .53% for the day. Moreover, the Russell small-cap index outperformed all major large-cap indexes for the week.”
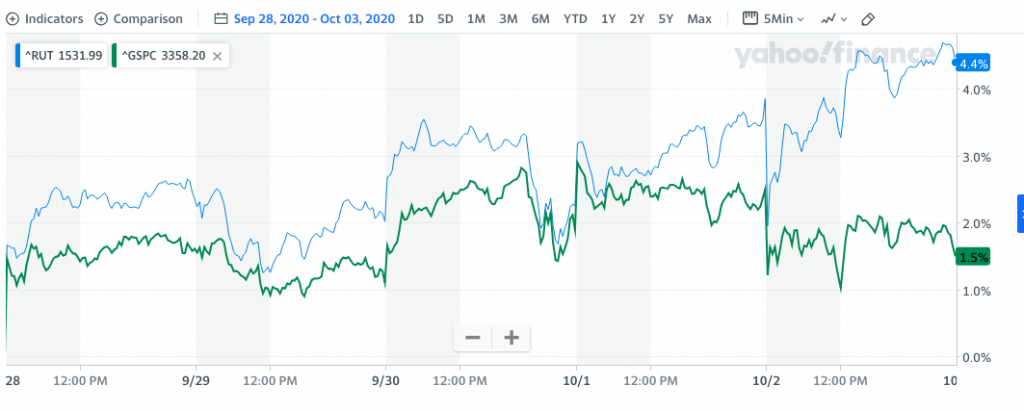
So even as the market responded Friday with large-cap indices finishing sharply lower, small caps rallied and market internals/breadth were stronger than “the tape” would have one assume. Such strong breadth analysis delivered a stronger market performance on Monday, which resulted in the aforementioned new S&P 500 A/D high. Another truism of markets is that “breadth leads price”, which found the S&P 500 being lead by strong breadth on Tuesday, and higher… until the President’s tweet noted above!
The tweet and decision by the President confounded many and found algorithms at work once again. We can see a similar, but more precipitous, 3-wave algorithm footprint in the S&P 500 having triggered on Tuesday afternoon.
The President’s surprise announcement was just that, surprising and as it doesn’t seem to benefit an already troubled reelection campaign. Post the recent debate debacle, on both sides of the campaign trail, the incumbent had lost that much more ground in the reelection bid. Polling shows that the challenger, Joe Biden, had increased his lead over President Donald Trump.
Biden’s odds to win rose back up a bit to 61.2% as of Tuesday morning. Trump was up 4.2% to 35 percent. The Democrat odds to win Senate ticked lower to 63 percent.
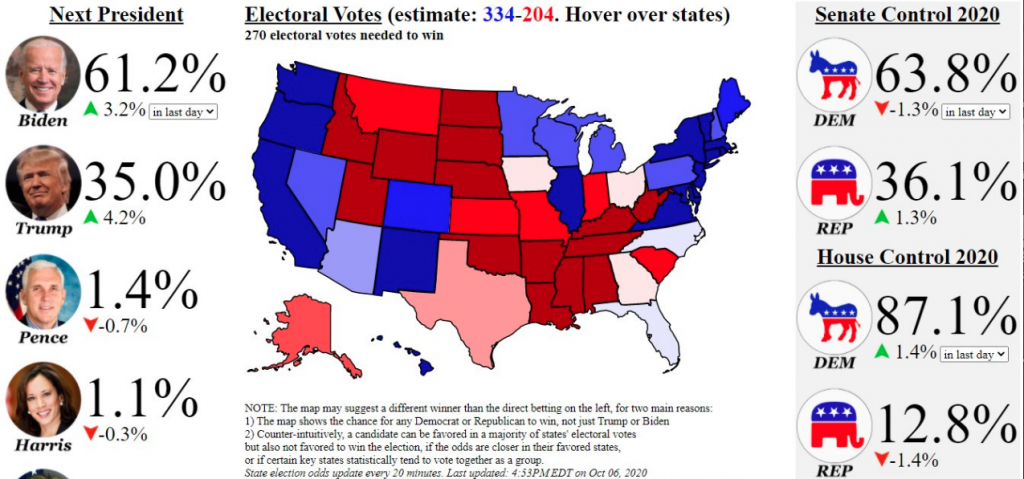
With such a deficit in the polls, again, yesterday’s decision by the President likely didn’t bode well for his candidacy. Other Republican Senators weighed in with disbelief and were found disagreeing with POTUS’ decision.
“Waiting until after the election to reach an agreement on the next Covid-19 relief package is a huge mistake,” said GOP Sen. Susan Collins, who faces a tough reelection battle in Maine. “I have already been in touch with the Secretary of the Treasury, one of the chief negotiators, and with several of my Senate colleagues.”
Anyway one decides to approach the President’s decision on Tuesday afternoon, it appears a miscalculation. But the polls will ultimately represent this as truth or fiction. Time will tell! Having said that, it would seem as though “cooler heads” have prevailed for the moment, as the President was out on Twitter last night, promoting the idea that he is willing to sign on a deal whereby stimulus checks are delivered to tax payers.
As a taxpayer, one has to consider the approach to a “trade deal” the President took throughout 2019. There were a lot of seemingly illogical steps and headlines along the way to a reconciliation point with China trade. Ultimately, the U.S. walked away with a deal in name, but purchase orders of goods and/or service in reality. One might suggest this was a “poor deal”. If this is the case, a taxpayer might be wagering the following question at the polls this November:
“If a poor trade deal was achieved for the U.S. taxpayer, why can’t a poor fiscal relief package be achieved for the U.S. taxpayer?”
Within the question above is the easily understood conclusion one walks away with. The logic dictates that it should be easy to formulate a poor fiscal relief package, given the decision to accept a poor trade deal, but for the sake of politics. This is about politics, not about the taxpayer. That folks, that’s problem. If this were about you and me, Joe Taxpayer, fiscal relief would be forthcoming. Obviously and sadly, this is not about the care for our citizens, but about politics. In my humble opinion, both parties are to blame! But I digress…
I’ve said many a time before, “The market doesn’t care about a stimulus bill.” The market seems resound to the fact one will come, by force or by natural order. The only thing the market questions is when such a fiscal relief bill will come. It’s why, despite negative headlines surrounding a potential deal, the market bounces back after an adverse reaction to the headlines. The market has delivered this message time and time again!
I started off this narrative denoting that forward-thinking investors are likely to perform better than those who are adversely affected by the headlines of the day. We may continue to find elevated market volatility leading up to and through the election, but despite the notions of a contested election, I believe the results will lend themselves to a greater degree of market certainty, which should find volatility declining into year-end. For now, however, the volatility is an added headwind for traders to contend with.
It seems like the ~10% pullback in the S&P 500 from the September 2 highs (3580) to the September 23rd closing low (3237) was a “healthy correction.” That could certainly change if sentiment turns, but as we move through Q4 2020, the market is found with lighter leverage.
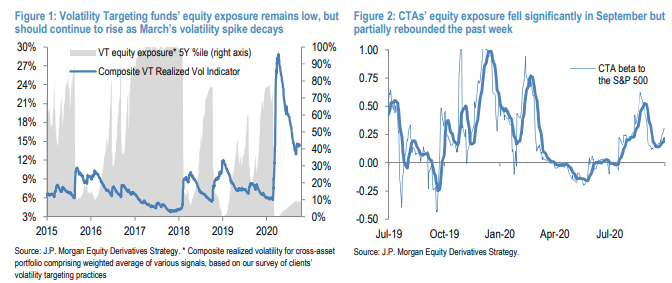
Systematic strategies and macro investor positioning remains low, and was cut further during the Tech/Momentum-led selloff in early September, but rebounded somewhat over the past week as the market recovered. We estimate Volatility Targeting funds’ equity exposure is ~10th %ile based on our model (Figure 1), and these portfolios are adding back to exposure at ~$1Bn/day (after deleveraging modestly in early September), a trend that is likely to continue in the coming weeks/months and provide a tailwind for the market. CTAs cut exposure from ~75th to ~40th %ile during September’s selloff as short-term momentum turned negative for US large caps, longer-term signals flipped negative for small caps and Europe, and volatility rose (since many CTAs apply volatility scaling). However, they have since re-levered back to ~55th %ile as the market partially rebounded over the past week (Figure 2). Short-term (1M) momentum signals are currently negative across equity markets, but will turn positive over the next week for most indices at current levels as we lap the early September sell-off, which could prompt further buying. European equity momentum is currently negative, but there’s a cluster of signals just 2-4% higher that could prompt buying in the region by CTAs if the market rallies. Hedge funds’ equity exposure remains light, with an equity beta in its ~15-20th percentile for both global HFs across strategies and equity long-short funds.
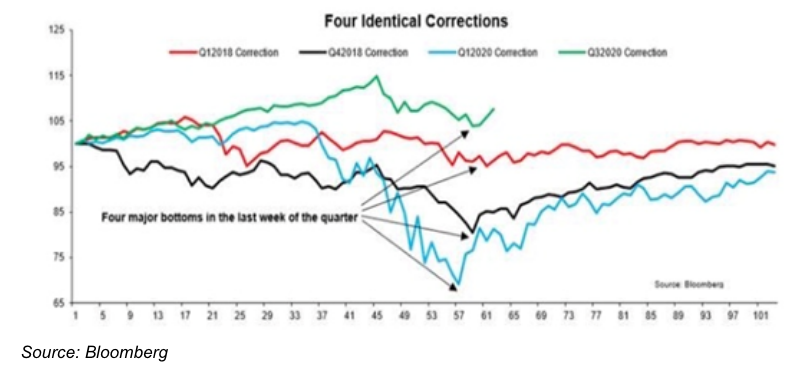
As it pertains to the September swoon, the previous four drawdowns of at least 10% in the S&P 500 were also completed days before the end of the quarter. Late March (Q1) and late December (Q4) of 2018. This year, the S&P 500 rebounded on March and September 23rd, just before the end of the first and third quarters. The March 2020 decline was 34% and the December 2018 selloff was 19.8% on a closing basis.
While we fight through the headlines and a seasonally weak October election history, investors will reflect on that history and possibly continue to position for more market volatility to come. Looking at every presidential election since 1992 (Bush v. Clinton), the average October return for the S&P 500 shows a decline of 2.45% in October. If you eliminate October of 2008, the average is fractionally negative at just -.03 percent. See what 2008 does to the data folks. This is why details matter!
More recently, in October of 2016 the S&P 500 fell 1.94 percent, before the market rallied into year-end and through all of 2017. In fact, the biggest decline in 2017 was just 2.5 percent. In the month before the 2012 election the broad market lost 1.98 percent. While this year has been anything but average, let’s look at some historical averages for perspective. The average close for the VIX Index with nine months in the books is 30.5 percent. If that average holds, it would be the highest annual measure since 2009 (31.48) and 2008 (32.69). The average of these annual averages is 19.51.
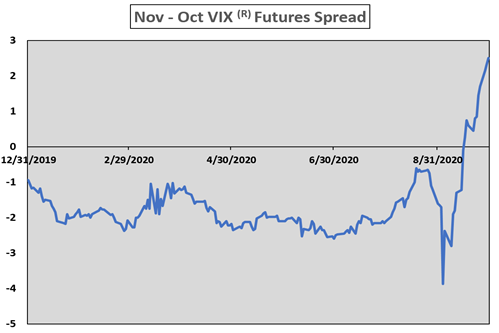
Much has been made of the potential for macro volatility tied to the upcoming election. Both buy- and sell-side participants have alluded to the steepening of the October/November VIX futures spread. Perceived volatility risk has been moving out in time as evidenced by the outperformance of November VIX futures relative to October for most of the past month.
Considerations of a contested election loom large amongst investors, despite limited occurrences. Since the 20th Century there has only been one true contested election that was ruled by the Supreme Court. As recently offered by LPL Financial, both Republicans and Democrats are preparing for that possibility and most likely will have an army of lawyers at the ready. In 2000 there was a smooth transition of power after a Supreme Court decision ended a recount dispute.
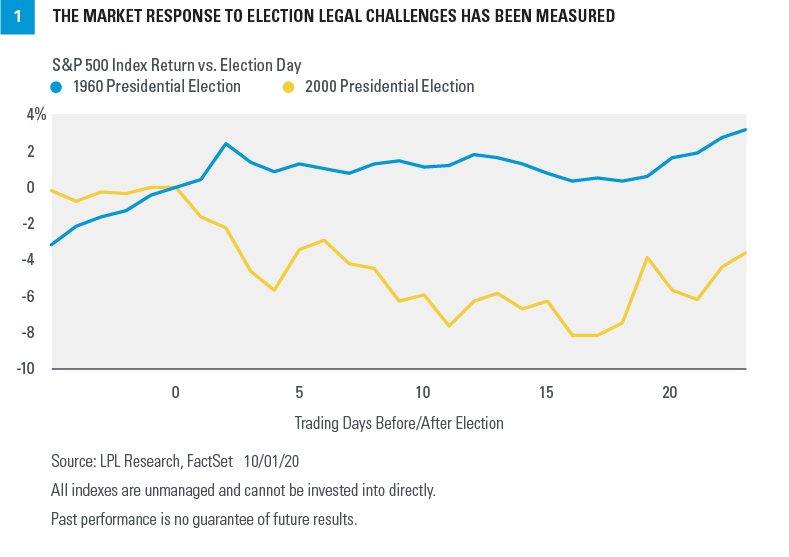
“We empathize with concerns about a hotly contested election result. However, we think it’s important to differentiate the political impact of election uncertainty from the market impact. In most cases, despite the possibility of some market disruption, we believe the stock market will be forward-looking and see past the period of uncertainty. While there is a fair chance that the election result may be delayed slightly, we expect the strength of our political institutions to prevail, for the election outcome to be determined fairly, and for a timely transition of power. Even if the process is bumpier than expected, market risks will likely be tempered unless there’s a political breakdown that threatens lasting damage to the economy or corporate America, and we’re a long way from there.”
At this point, I wish market fundamentals and technicals ruled the roost for investors/traders, but the political has taken center stage for the time being and ahead of earnings season. Ultimately, it comes down to reading the tea leaves of the market, the underlying strength identified in the technicals, fundamentals and within market breadth. Up until 2:30’s algo induced selloff, many technical formations showed the true strength of the market.
The Dow Jones Transports (DJT) recently had a breakout in mid-September, which was followed by a successful retest and breakout to new 52-week highs yesterday. This was before the algos of course.
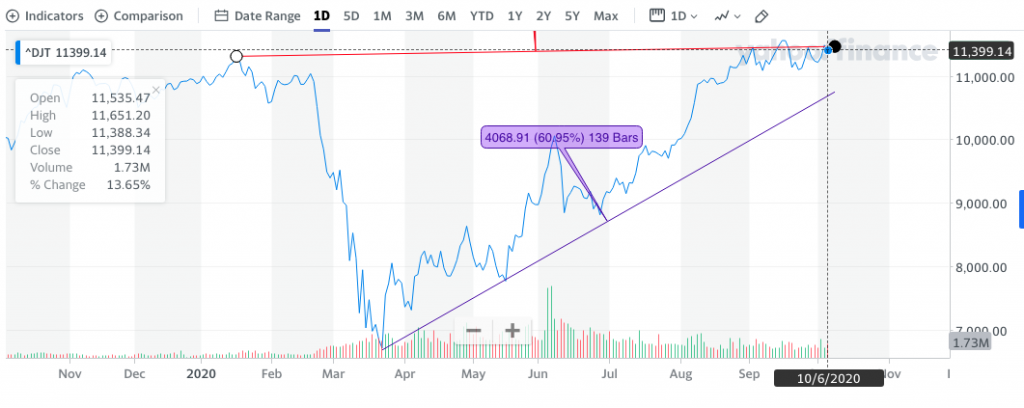
The high of the day for the DJT was 11,651, but the closing value was 11.399! This identifies both the market strength building on Tuesday, and the headlines that trigger the selloff.
Moreover and as recently highlighted by All Star Charts’ J.C. Parets, other sectors of the market have been outperforming during the September correction.
“Home Builders are one of the most crucial industry groups in America. Their performance tells us a lot about the economy, and more importantly insight to the risk-behavior of market participants. To see their continued strength is most definitely a feather in the cap for bulls.
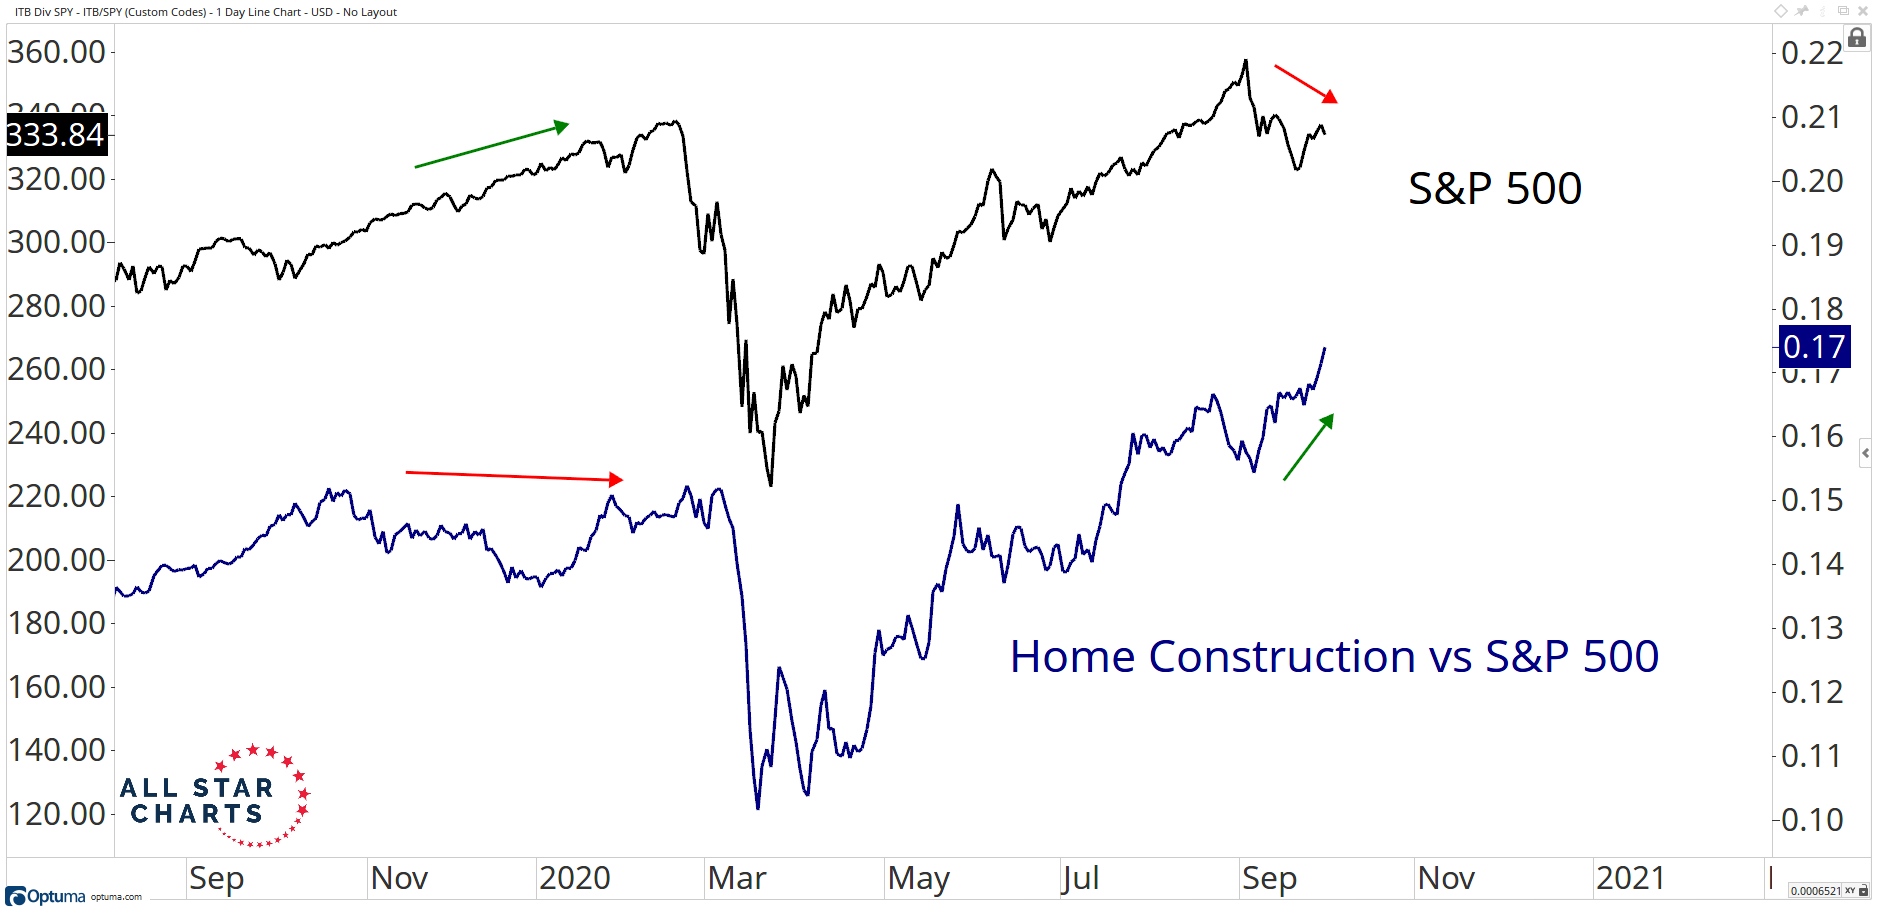
As the S&P 500 corrected in September, Home Builders broke out of a twelve and a half year base relative to the broader market. It seems logical to us that the S&P 500 will eventually follow the Home Builders and the entire Consumer Discretionary sector to make new highs.
In fact, look at how well Discretionary XLY, in general, has performed not just off the March lows, but also over the trailing quarter.

Undoubtedly, small caps and cyclicals have been the underlying and even driving force for markets since late September. Andrew Sheets of Morgan Stanley says markets have still, despite the chaoitc 2020 year that it has been, largely performed like we’re in the start of a new economic cycle.
“We maintain our central tendency–this cycle is more normal than appreciated, and should be treated as such until proven otherwise,” according to the head of cross-asset strategy for Morgan Stanley.
I tend to agree with Sheets’ recognition of an early cycle recovery, consistent and within the context of a secular bull market as well. Bank of America offered much the same, as the firm encourages investors to look beyond 2020: