
The trading week that was ended in a manner that many may have not anticipated. As we read this week’s Research Report, we can’t help but to recall the setup for the trading week that was found with some anxiety surrounding the December 15 tariffs. Investors had a choice to make at the beginning of the week; reduce market risk and/or hedge their market exposures. Fortunately, the most logical and beneficial geopolitical actions took shape, whereby investors could breath a sign of relief and as a phase-1 U.S./China deal was announced. Without getting into the whole “good deal vs. bad deal” debate, investors should rather focus on the removal of the economic headwind as a net positive going forward. With that being offered, let’s dive into a little housekeeping notes below and before getting into the heart of this week’s Research Report.
- Ahead of the Christmas holiday shortened trading week (Wednesday 25th), there will be no Research Report scheduled for release on December 22, 2019. Our final Research Report of the year will be published December 29, 2019.
- Due to the increased membership and services we’ve scaled through the year and expenses associated with scaled initiatives, come 2020 our Contributor Membership fees will moderate higher to account for the aforementioned costs of services. The Contributor Membership fee will increase to $5.99 a month. We remain of the opinion that this pricing still delivers a tremendous value to our members and we appreciate your patronage and dedication to our services, analytics, reports and video archives. Everything we provide, by these means, is aimed at delivering educational and portfolio management value to our members.
- In 2020, we aim to continue scaling our services that will include option market educational services and more.
Since the genesis of Finom Group in December of 2017, we have increased our member total from 228 members to almost 3,000 members. Along with this growth we continue strive to increase our staff to support our future growth. As we approach our 2-year anniversary and the holiday seasons, we offer our most sincere appreciation to all of our members, which is why this week’s Research Report will also be available to our Basic membership level participants. Naturally, we desire all of our members to upgrade to our exclusive content, but until then we thank you all for choosing finomgroup.com as a source for your financial market needs!
All Things S&P 500
Investors are breathing a deep sigh of relief after Thursday’s announced phase-1 trade deal that promises to de-escalate the trade feud between U.S. and China, which began back in July 2018. Coming into the trading week, investors were found buying ample protection, as the markets came under modest pressure. During the first 2 trading days of the week, the S&P 500 (SPX) dropped just under a half percent.
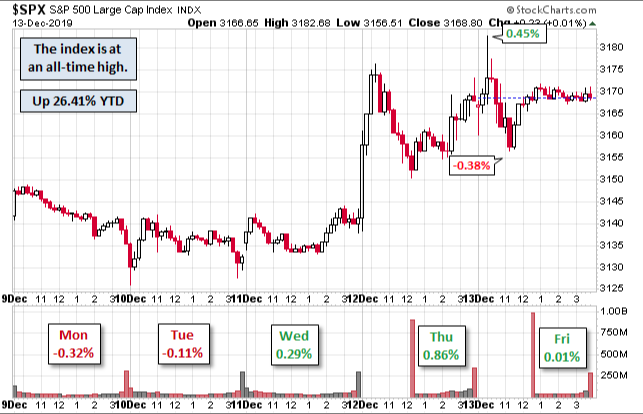
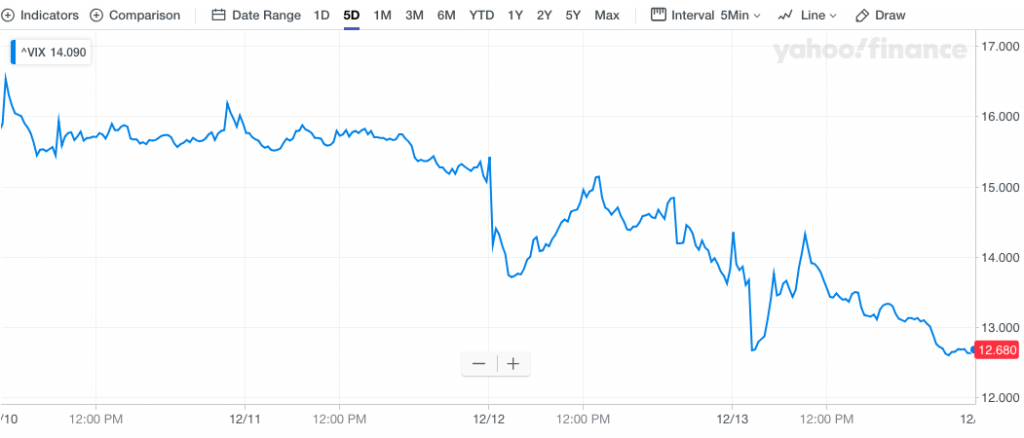
Rumblings came out of the White House Administration by Wednesday, suggesting that trade negotiations were progressing in a promising fashion, while the Fed held true to their “pause”. On Thursday, the White House Administration confirmed that a phase-1 trade deal had been “signed off” by President Donald Trump. The market subsequently rallied on this headline, and as earlier protection was sold off. (See chart of VIX)
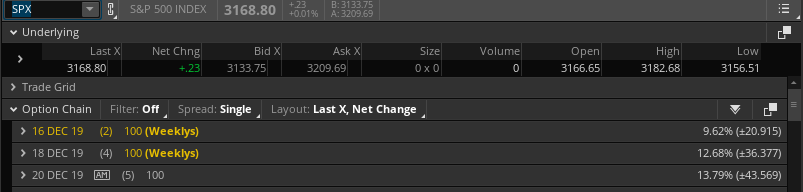
When it was all said and done, by week’s end, the S&P 500 index reached another new high intra-week and closed the week at 3168.80, up 0.73% from last Friday. The S&P 500 is up 26.41% year-to-date with just 2 weeks to go in the trading DECADE! The removal or de-escalation of the U.S./China trade war has now laid the framework for a melt-up through the end of the year, although the coming weeks do represent tax loss selling season. With that being said, anything is possible in a low liquidity market regime. This is something that we can’t discount in the analysis of market performance drivers. As traders, we are always kept “on our toes” by something, although investors are more able to consider that the long-term trend remains bullish. For the sake of further commenting on the low liquidity market regime, however…
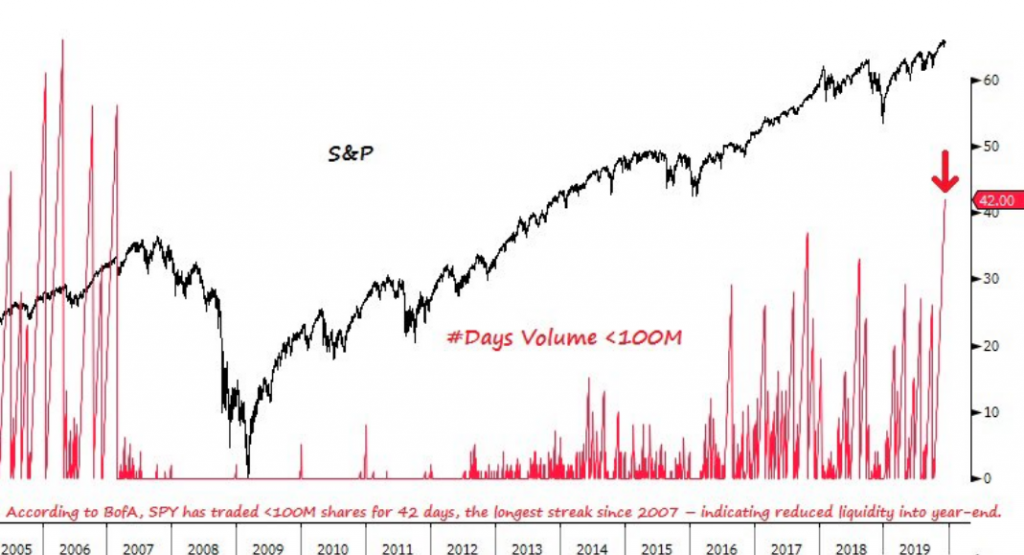
- According to BofAML, the SPY has traded less than 100mm shares for 42 days as of December 12, 2019.
- The longest streak since 2007, indicating reduced liquidity into year-end.
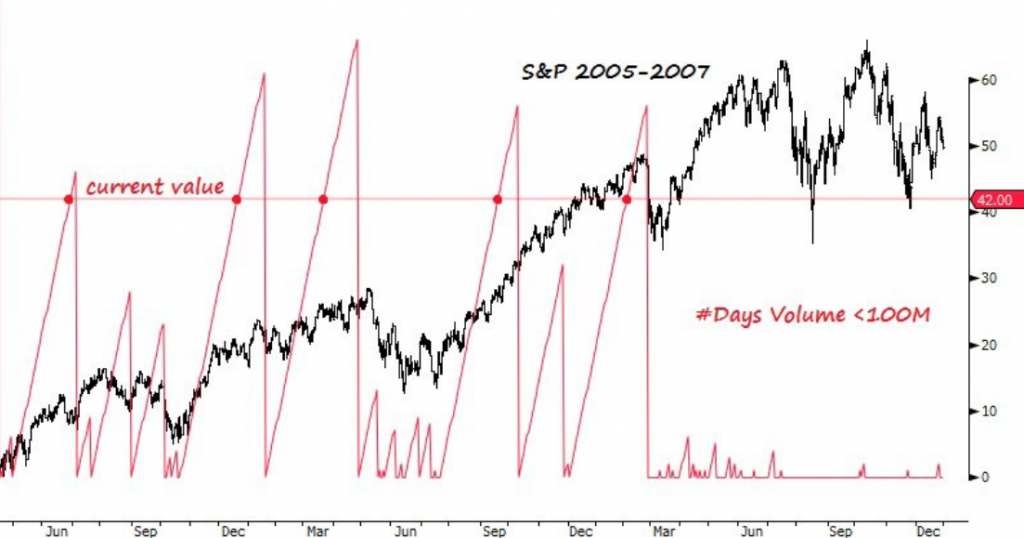
- Importantly, this low volume only happened in 2005-07 and 2016-17. Most cases led to a pullback in stocks.
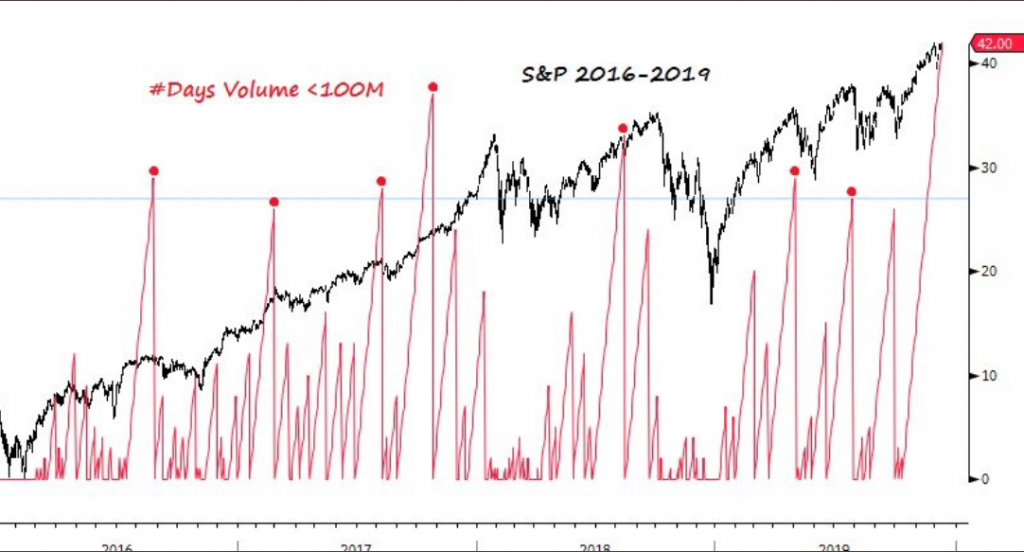
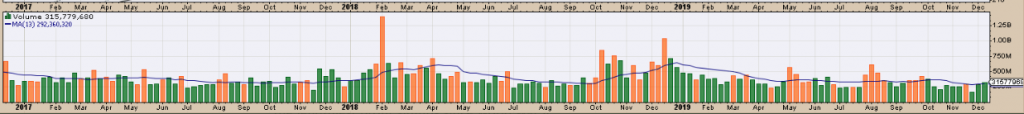
We think the most important takeaway from these charts is that they identify declining volume for equities, but don’t identify the catalyst for a market pullback. Liquidity works both ways. When liquidity is low and the market is trending downward, a countertrend move is extremely difficult to achieve absent a catalyst. When the market is trending higher in a low liquidity regime with the two most heavily cap weighted stocks (AAPL, MSFT) trending higher, it is equally as difficult to produce a countertrend market move. Having said all of that about SPY volume and market liquidity, SPY volume has been slowly improving in December. Still low, but improving as shown in the chart below: (Right most side of chart from Market Musings)
This is where we see the value in the largest exogenous and binary issue concerning investors having found de-escalation a positive development for the market going into the end of the year. And as such, let’s look under the hood of this thing we call the S&P 500 and see if it needs an oil change!
The combined 3 charts positioned below are possibly the most telling signs of an overbought market within the context of strong breadth characteristics (Charts from David Larew). While some suggest they beg for a market pullback, others might say they identify bullish conviction in an otherwise seasonally strong period of the year.
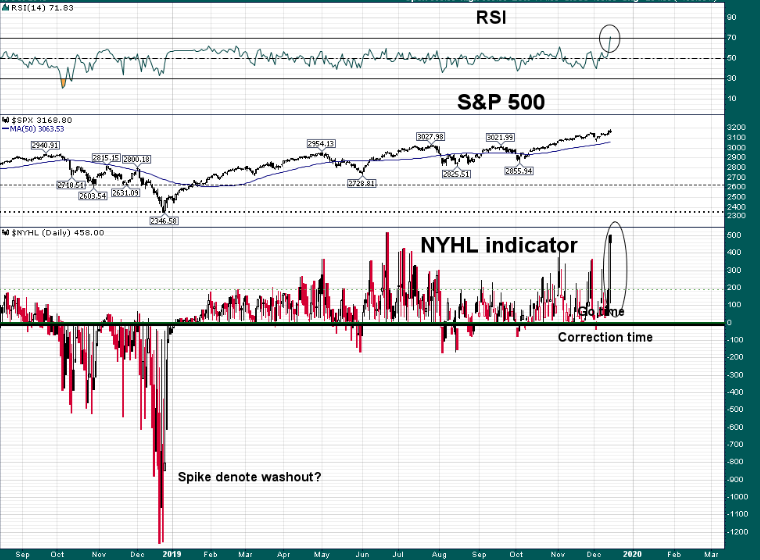
The S&P 500 14-day RSI broke sharply higher this past trading week and now resides in the land of “melt up probabilities”. Combined with a very strong spike in the NYSE new highs minus new lows, both of these two breadth indicators are suggesting the market is rather strong and found with increased buying pressure. If we pullback on the NYSE, however, and just look at the number of stocks hitting new highs we can also see that there is still room to run into the end of the year. At least…?
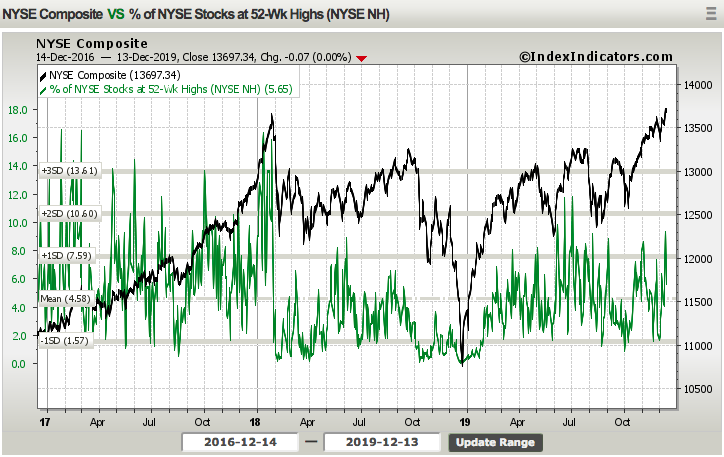
We suggest there is still room to run as the breadth indicator has been higher in the more recent past and through much of 2018. What else? Well since you asked…! Although it is slightly lower than the previous week, the percentage of stocks trading above their 200-DMA remains at a healthy level.
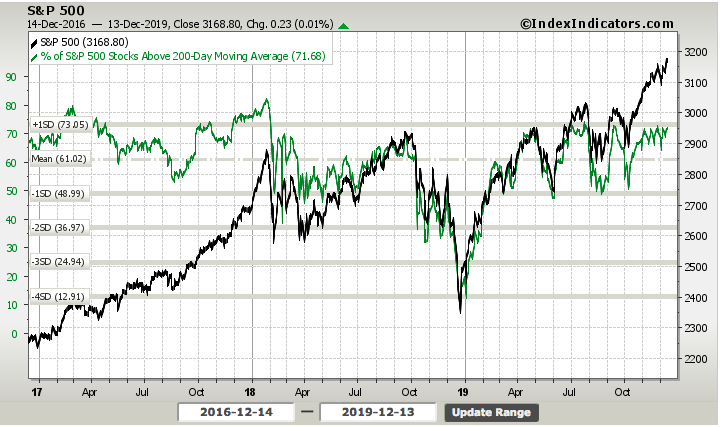
The fact that in spite of the nervousness surrounding the December 15 tariffs, overbought conditions persisting for more than 6 weeks and subdued investor sentiment, the percentage of stocks trading above their 200-DMA has held at strong and constant levels. We like seeing this type of consistency as it demonstrates not just a “buy the dip” execution on the part of investors, but a lack of downside momentum probability existing. It’s not to say something CAN’T bring about a more serious correction, but it’s simply not showing up in market breadth/internals at this time. What else? You guys/gals gotta stop with the questions! 😉
This is where the ammunition comes in handy, as it pertains to… ummm how do we say this politically correct… “disturbing the cantankerous bearish views on the market.” (Pissing off the permabears, chart care of Ryan Detrick)
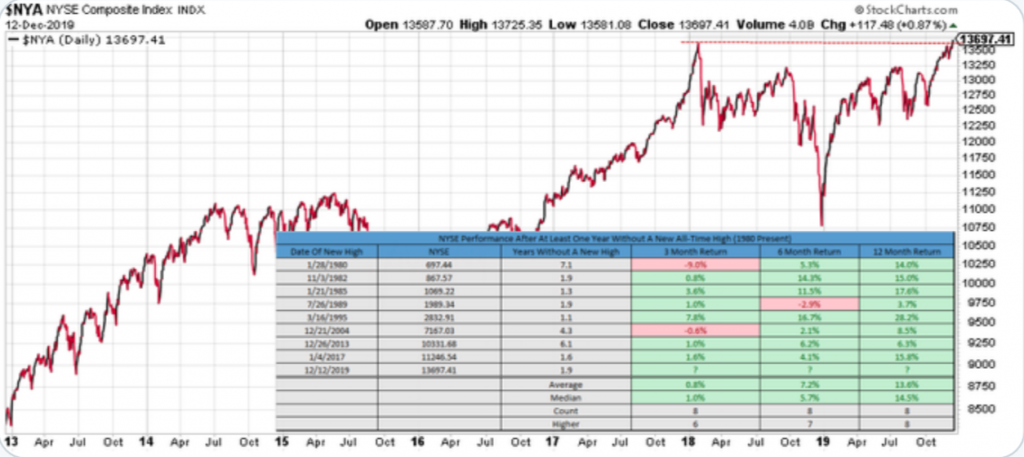
The NYSE has gone nowhere for nearly 2 years, but finally made new highs Thursday of this past week. So what does this mean for the market going forward? Since 1980 and when the NYSE has not made a new high in over a year and then makes a new high, the market is higher 6 months later 7 of 8 times and higher 12 months later every single time. We like those odds!
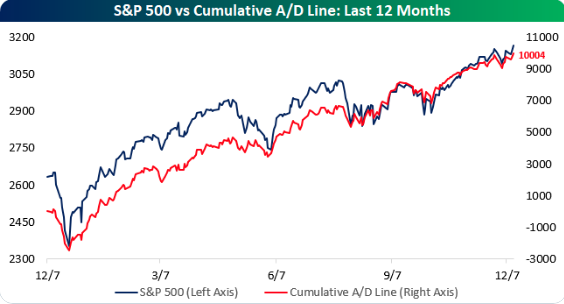
Moreover, least we forget what had taken place recently in other indices and composite indexes. Just this past Thursday, the S&P 500’s cumulative A/D line also hit a new high.
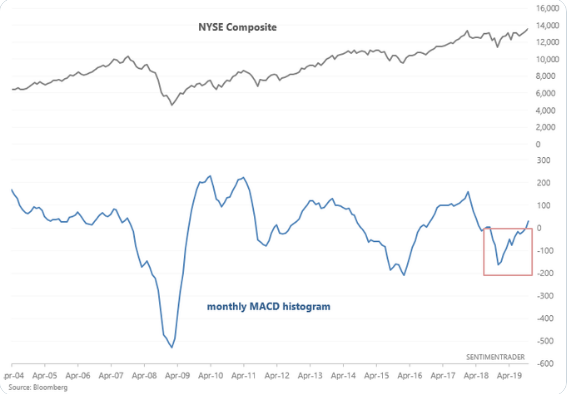
Monthly MACD’s also turned positive for the Dow (DJIA) and NYSE Composite in late November for the first time in more than 1 year. This is bullish for stocks on a longer term basis.
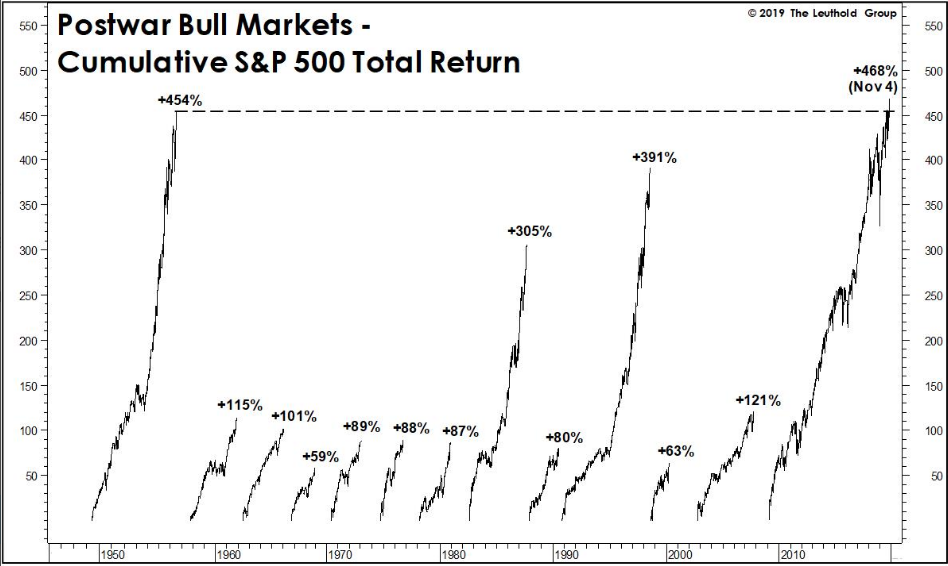
As we’ve been reporting for the last 2 months now, market breadth/internals have identified market strength and a continuation of the uptrend. Records are being set in many indices as well as in certain of the economic data in 2019. As it pertains to the indices and index ETFs, the SPY set another record recently. Its cumulative total return since 3/9/09 is+468% (thru Nov. 4th), surpassing that of +454% attained during 1949-56.
With market breadth/internals still found with strength and now the most impactful binary event having been tranquilized, so to speak, a melt-up into year-end is the most probable outcome. To be clear, this is the most probable outcome, but it is by no means guaranteed. With that being said, we aim to discover what other market analysts and strategists have suggested since the latest announced phase-1 trade deal and with markets at all-time highs.
“Three big geopolitical things are taken off the table — USMCA, phase one and Brexit, and even though we might not like or be fulfilled by phase one, these uncertainties are behind us,” said Sam Stovall, chief investment strategist at CFRA.
We’re getting a running start on the Santa Claus rally. Historically stocks often hit the low of the month in mid-December, before rallying into the rest of the year.“
As it pertains to the mid-December dip, Stovall is correct. The average S&P 500 calendar year does identify a mid-December dip of little consequence. Possibly more importantly is the consistency for which the 2019 market has been trending with the 2013 market, as we’ve outlined this analogue in the past.
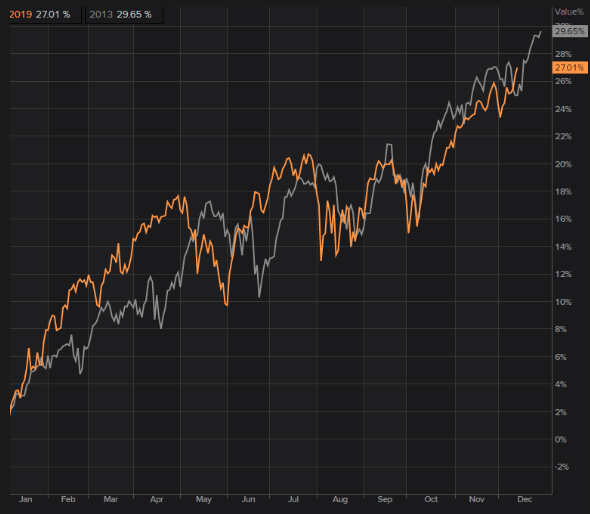
As identified in the chart pairings for the S&P 500 trend, it would appear that in 2013 the market did indeed melt-up into the end of the year.
According to Bespoke Investment Group’s Paul Hickey, stocks generally stage their final push for the year in mid-December, even when the month starts off weak, as this one did.
“You would think you’d see strong performance throughout the month. What we found is almost more so than any other month, December is a very back-end-loaded month, meaning the returns usually come towards the back half of the month.”
Hickey builds his bullish case in a chart that shows the intra-month performance of the S&P 500. He compares the current bull market to the overall trend between 1983 to 2018. Since 1983, December’s first two weeks often see muted returns. Stocks typically don’t break out into a sustainable year-end rally until around Dec. 14, according to Hickey’s data. That’s around the end of next week. It remains to be seen if a melt-up is what is in store for traders/investors this calendar year. If market breadth/internals are any indication… Now let’s see what Michael Hartnett of Bank of America Merrill Lynch had to suggest about a market melt-up:
“Market primed for Q1’2020 risk asset melt-up; Fed & ECB still adding liquidity, Conservative Party majority (Brexit resolution) & reports of phase one US-China trade deal to resolve main two global macro tail risks & remove lingering US$ & GT10 risk premiums…
…..we continue to expect returns to be front-loaded in 2020 (targets SPX 3333 by March 3rd, GT10 2.2% by Feb 2nd).”
This past week the weekly expected move jumped up to $42/points. The S&P 500 failed to achieve the expected move to the upside or downside, staying inside the weekly expected range. For the coming week, the weekly expected move has moved higher at $46/points. We’ll see where it resides on Monday morning as the options are further calculated.
Weekly Economic Data
The economic data calendar was rather light of market moving data. Consumer prices have stabilized over the last few months and started to move off of depressed levels. .
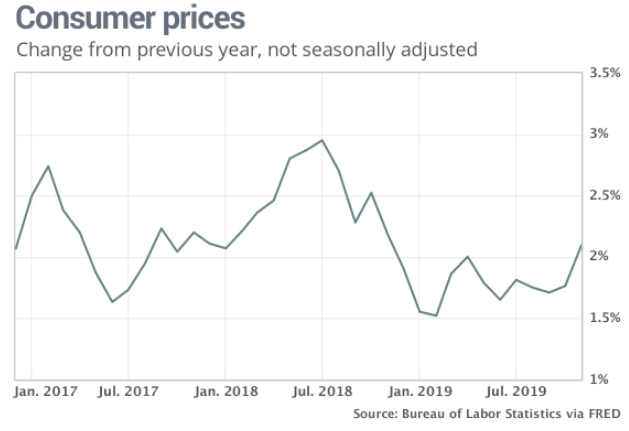
The consumer price index (CPI) rose 0.3% last month following an even bigger increase in October, the government said Wednesday. Economists polled by MarketWatch had forecast a 0.2% advance. The recent spike lifted the increase in the cost of living over the past 12 months to 2.1% from 1.8%. That’s the highest level since November 2018. Nonetheless, current readings are in keeping with a disinflationary environment and not cause for concern.
Beyond the CPI data, the Fed was able to deliver on its pause for rate activity and generally dissuade fears of future rate hikes until 2021. Every quarter, members of the Federal Open Market Committee forecast where interest rates will go in the short, medium and long term. These projections are represented visually in charts below called a dot plot.
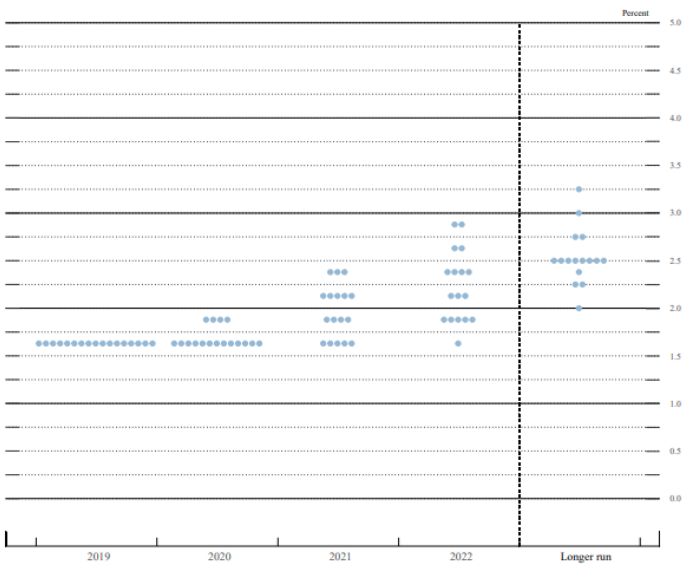
Based on the projections for rates in the dot plot above, a rate hike would not be delivered until 2021. On Wednesday, this revelation brought about some investor confidence and gave rise to markets even in the face of a looming tariff deadline announcement. Speaking of those tariffs that won’t be realized, the newly announced phase-1 trade deal has been outlined as follows:
- As part of the deal, the U.S. canceled plans to impose fresh tariffs on $156 billion in annual imports of Chinese-made goods, including smartphones, toys and consumer electronics that were set to go into effect Sunday. The U.S. will also slash the tariff rate in half on roughly $120 billion of goods affected on Sept. 1, from 15% to 7.5%.
- U.S. tariffs of 25% would remain on roughly $250 billion in Chinese goods, including machinery, electronics and furniture. In exchange, officials in Washington said China agreed to increase American agricultural purchases by $32 billion over previous levels over the next two years.
- Agricultural purchases would increase to $40 billion a year, with China working to raise it to $50 billion a year, U.S. Trade Representative Robert Lighthizer told reporters at the White House. The farm purchases would be part of total additional exports of $200 billion over two years, said Mr. Lighthizer, who didn’t provide specifics.
- Mr. Lighthizer also said China made specific commitments on intellectual property, including counterfeiting, patent and trademark issues and pharmaceutical rights, as well as on preventing the forced transfer of technology from firms entering the Chinese market.
- Mr. Lighthizer and Chinese Vice Premier Liu He are expected to sign the deal in early January, with the pact entering into force 30 days later.
With the trade deal concessions and path forward to implementation announced, here is what Goldman Sachs’ chief economists had to say about the deal, which it found lacking or beneath its baseline scenario.

“The most important development is that the White House has agreed to reduce September 1 tariffs .. from 15% to 7.5%. While this signals a clear shift in the direction of US-China trade policy, .. the reduction is only half as large as our baseline assumption.
There is still some uncertainty regarding the status of this agreement, as it appears once again that some technical and legal details are still in flux.“
As it pertains to the phase-1 trade deal, here is what Finom Group’s chief market strategist Seth Golden had to say:
“Market participants shouldn’t get bogged down with the details of the proposed deal. There’s too much of that to go around. What’s most important is the validation of de-escalation. That’s what the business community wants. That’s what is most important in order to get the manufacturing sector growing again. Sure, it seems as though a trough in global PMIs has been found, but truth be told we don’t know if the recent global PMI readings are a factor of front-loading ahead of the December 15 tariffs or greater belief in the global economic rebound in 2020. With this announced deal and subsequent signage of the deal, businesses can once again invest with more confidence, knowing what their expenses are going to be on goods produced. It’s been a long time since the business community could say they had confidence in this regard.
Secondly, simply removing the issue from daily media headlines may prove to have a stimulative impact on consumer sentiment and spending as well. We tend to overlook the pervasiveness of media narratives on the subject of trade relations, but when we look at the latest retail sales and even certain of the consumer sentiment surveys, it becomes clear that the consumer is indeed conscious of the macro-issues. While the consumer has been delivering the biggest support to GDP growth in 2019, it has been seen slowing in recent months. Remove the trade angst from their many burdensome considerations and we may see some animal spirits come back to life and that Personal Savings rate moderate lower.
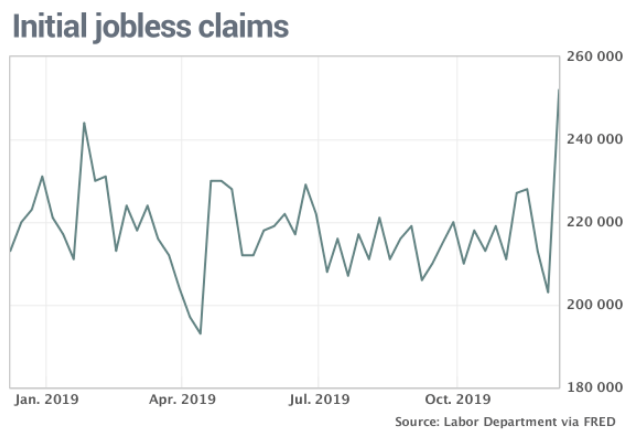
Getting back to the weekly economic data; much has been made about the jump in weekly initial jobless claims. Initial jobless claims jumped 49K to a seasonally adjusted 252K in the first week of December., the government said Thursday. That’s the highest level since September 2017.
Jobless claims often gyrate during long holiday seasons that start after Thanksgiving. Laid-off workers wait longer to file claims, unemployment offices are closed more often and companies add and drop temporary workers. Poor weather can also skew the numbers.
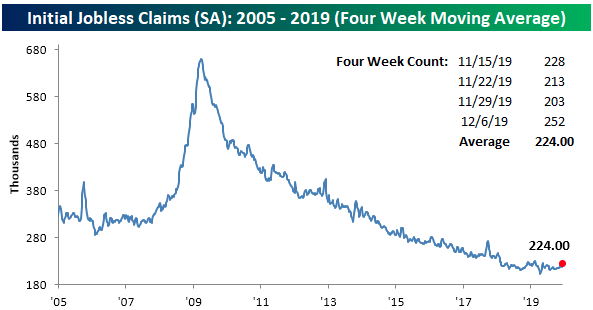
The Thanksgiving holiday, which falls in different weeks each year, appears to have thrown off the government’s process of adjusting jobless claims for seasonal swings in employment. The holiday took place on Nov. 22 in 2018 and on Nov. 28 in 2019. For this reason, we look to the 4-week moving average as a better gauge of jobless claims. The 252K sent the average 6.25K higher to 224K. That is the largest one week increase since the first week of May when it rose by 7.75K. Similarly, the last time the four-week moving average was as high or higher than the current reading was on May 10th when it rose to 225K.
While at first glance this massive increase in the context of relatively flat claims over the past year may seem like a concern, it’s simply a seasonality issue, as Thanksgiving arrived later this year. As shown in the chart below from Bespoke Investment Group, the current week of the year has historically been the most volatile for seasonally adjusted (SA) initial jobless claims. The standard deviation for the weekly changes is at 26.98, nearly double the average standard deviation (13.96) for all weeks of the year.
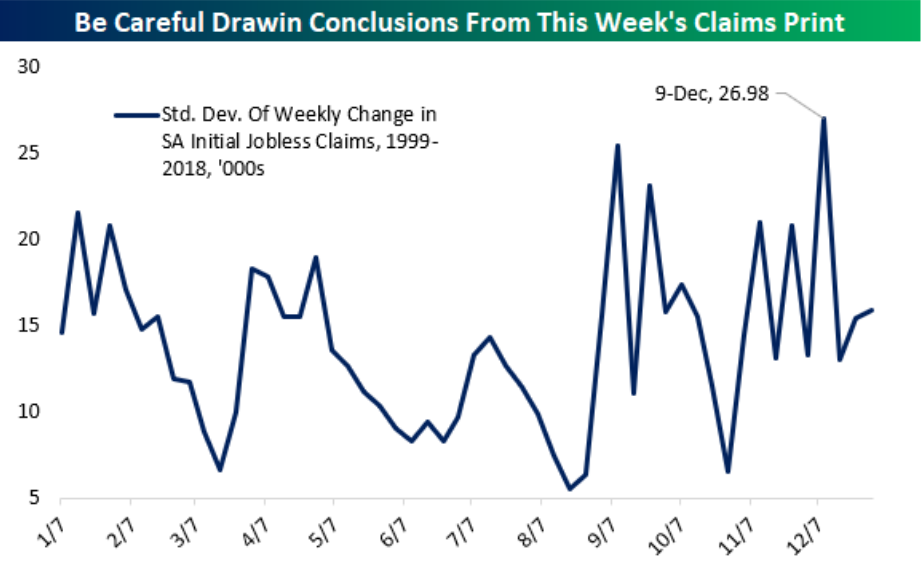
Given the anomaly outlined in the charts that coincide with the seasonality impact, we would expect initial jobless claims to moderate lower as we enter the new calendar year.
Monthly retail sales culminated the economic data for the week ended December 15. Retail sales edged up 0.2% last month, but economists polled by MarketWatch had expected a 0.5% increase. October retail sales were revised modestly higher from .3% to .4 percent. Additionally, and what gets overlooked in the headlines, is that retail sales grew 3.3% YoY, which is an acceleration from October’s reading. It’s key to recognize that while the MoM number gets the headline, investors should identify the strength or weakness in retail sales over a longer time horizon.
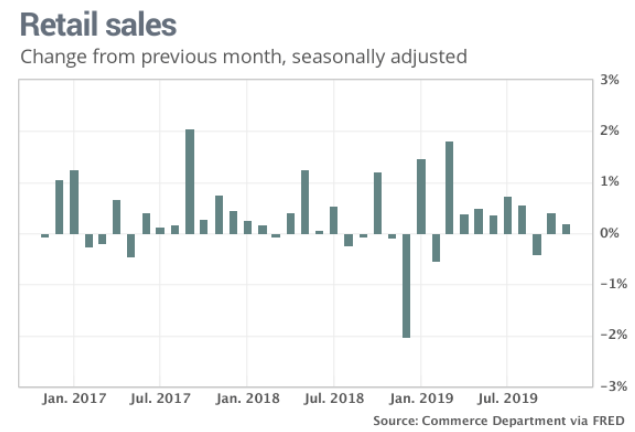
We assign some of the shortcomings in the November retail sales to align with a shift in the Thanksgiving and Black Friday weekend calendar year. A late Thanksgiving pushed the first big weekend of holiday spending into December. Cyber Monday took place on Dec. 2.
The 2019 holiday season is likely to be stronger than it was last year, when retail sales fell slightly in November and even more sharply in December as a government shutdown pervaded consumer psyche. Nonetheless, the labor market is robust, unemployment is low, stocks are at record highs and consumer confidence has rebounded after a late-summer lull.
When we dig down into the category-specific retail sales, we see where the weakness was concentrated.
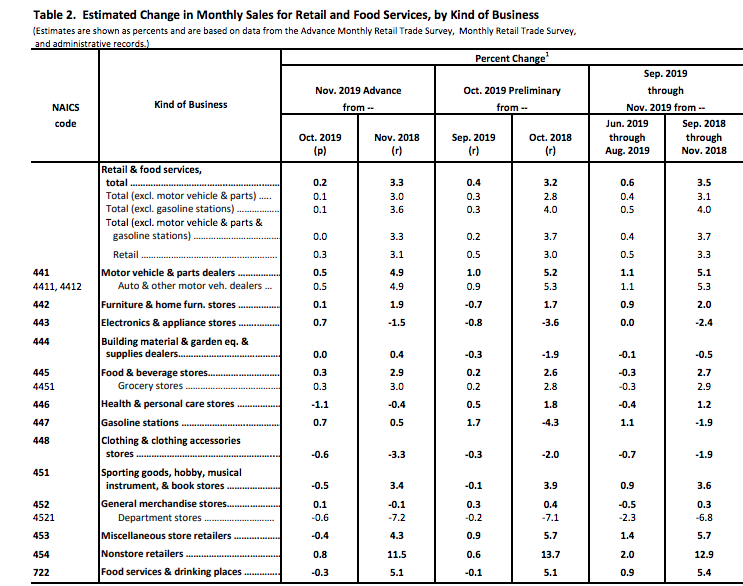
Sales fell at department stores, restaurants, clothing stores, pharmacies and outlets that sell sporting goods. The declines at restaurants and health-care stores were the biggest in almost a year. But it’s the department YoY declines that were the greatest.
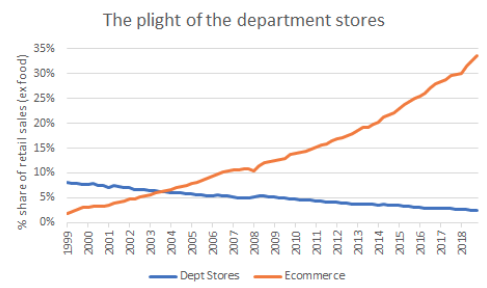
Declining department store sales is nothing new, as it has been persistent over the last 6-7 years. Having said that, the rate of deterioration has seemingly accelerated from 2017-2019. Department store chains like Macy’s (M), J.C. Penney (JCP) and Kohl’s (KSS) have all felt the brunt of declining metric performance along the lines of gross profit margins, sales and operating profit over the years. And where are those margin dollars and profits going? A quick glance at the categorical sales in the table from the Census Bureau above shows that Nonstore retailers are gobbling up that which has been lost from department store retailers. Nonstore retail sales grew .8% MoM and a whopping 11.5% YoY in the month of November. And as a percentage retail sales, the chart below identifies a bleak outlook for Department store retailers.
Finom Group remains of the opinion that retail sales will continue to grow through 2020, absent an exogenous shock to the economy. The labor market is robust, unemployment is low, wages are rising at a healthy pace, household debt to discretionary spending income remains at the best levels in 60 years, stocks are at record highs and consumer confidence has rebounded after a late-summer lull. These are all the healthy inputs for a continued strong retail environment. Nonetheless, we still see a continuation in the deterioration of Department store sales performance and share price going forward.
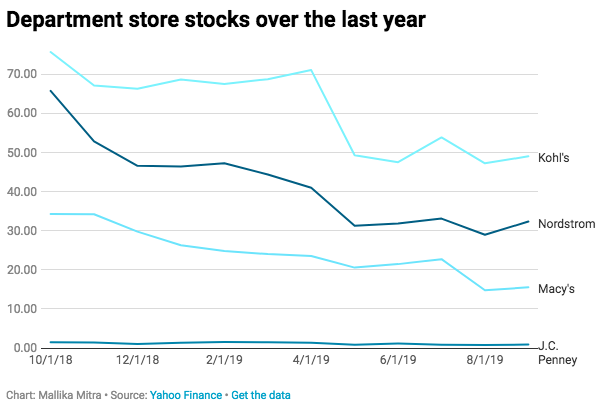
Kohl’s may present the best opportunity for a short play amongst the department store retailers in 2020, as we believe the share price has not discounted the trend in its metrics, fully.
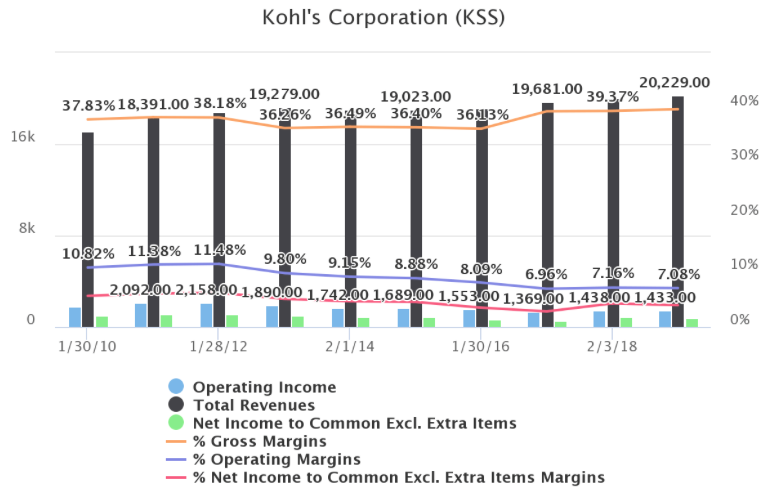
Kohl’s operating and net profit margins have been declining for years. Operating margins are now about 7%, and net profit margins are now roughly 4%. In the years after the Great Recession, the company had operating margins of about 11% and net profit margins of about 6%. So, the current margins represent a significant deterioration in profitability. We’ll keep an eye on this department store retailer alongside the others.
For the coming week, the economic data calendar starts to get a lot heavier, as investors will be receiving data surrounding the state of both manufacturing and housing.
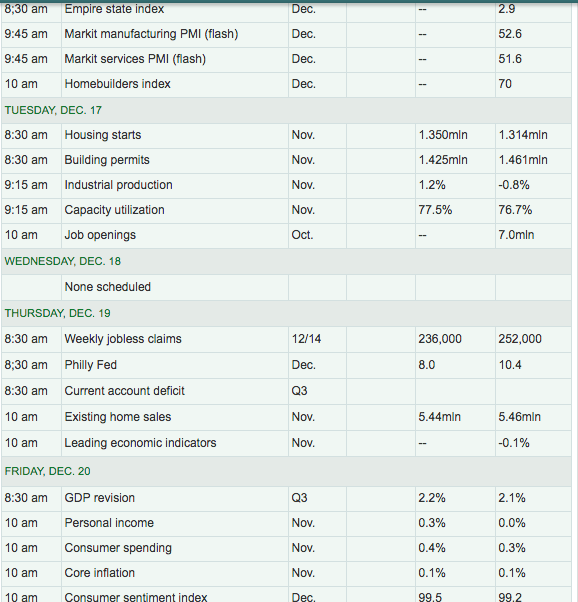
The data-packed week will certainly play a role in developing Q4 GDP forecasts. Here is where some of the regional Fed forecasts and big money center banks are forecasting Q4’s GDP thus far:
- From Merrill Lynch:The retail sales data nudged 3Q and 4Q GDP tracking a tenth lower to 2.1% and 1.5% qoq saar. [Dec 13 estimate]
emphasis added - From Goldman Sachs: Following today’s data, we lowered our Q4 GDP tracking estimate by one tenth to +1.8% (qoq ar). [Dec 13 estimate]
- From the NY Fed Nowcasting Report: The New York Fed Staff Nowcast stands at 0.7% for 2019:Q4 and 0.8% for 2020:Q1. [Dec 13 estimate]
- Atlanta Fed GDPNow: The GDPNow model estimate for real GDP growth (seasonally adjusted annual rate) in the fourth quarter of 2019 is 2.0 percent on December 13, unchanged from December 6.
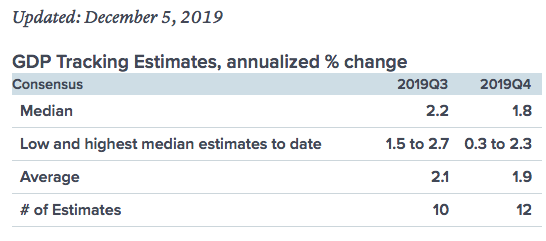
- CNBC Rapid Update: See graphic table below:
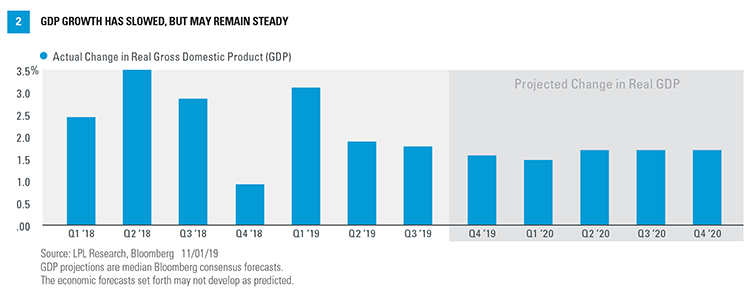
Throughout 2019, Finom Group has offered that the economy has expressed a growth slowdown from 2018. Nonetheless, the growth slowdown still achieves trend-growth pace (1.7-2.3%) and does not point to a recession in 2020. The main component of support and driver of economic growth has been and is forecasted to be a healthy consumer with a healthy household balance sheet. While debt levels naturally rise alongside working age population growth and a low unemployment rate, disposable income has proven to grow above and beyond debt servicing levels. The chart below is possibly the most important and relevant chart that defines the strength of the consumer and underlying support of economic growth for the foreseeable future.
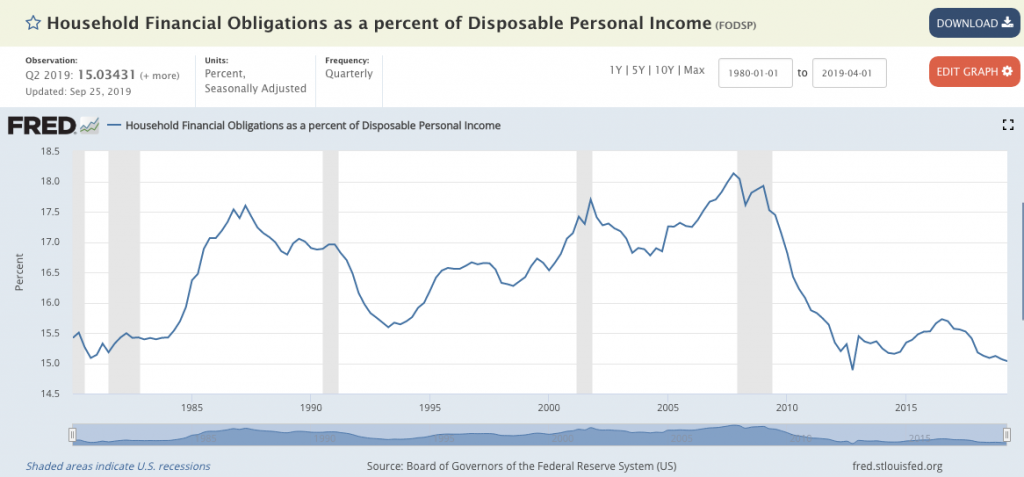
Household financial obligations (debt) as a percent of disposable income is at 60-year lows. The consumers balance sheet is strong and found with rising wages in a low inflation environment where credit is free-flowing. Oh and before we forget, on Friday, the final reading on Q3’s GDP will also be delivered.
Fund Flows No Longer Stink
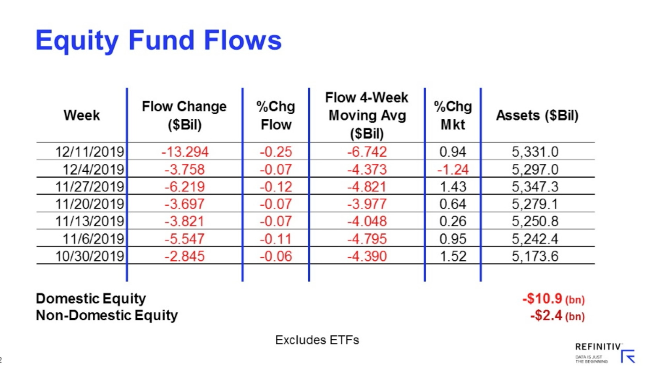
For our long-term members, that’s probably the first time you’ve seen that heading leading into our discussion about fund flows. That’s largely due to the fact that we’ve had a rather robust streak of inflows here in the final quarter of the year and decade. So let’s take a look at what Lipper weekly fund flows had to report in this regard.
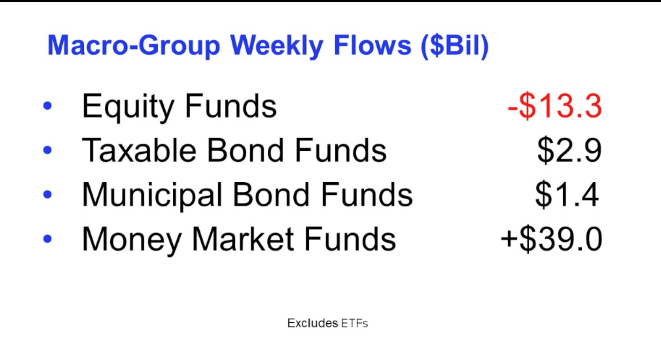
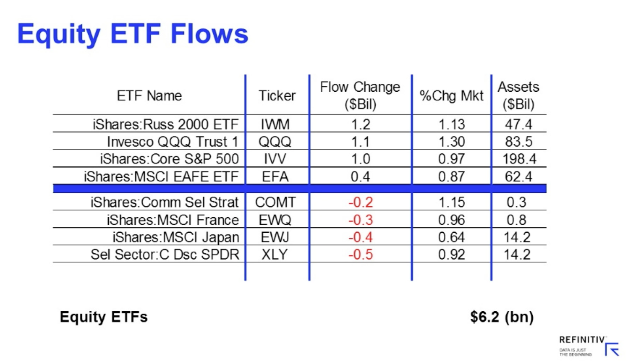
For the ninth week in a row, equity ETFs witnessed net inflows, attracting $6.2 billion for the most recent fund-flows week. Authorized participants (APs) were net purchasers of domestic equity ETFs (+$5.8 billion) for the third consecutive week. Meanwhile, non-domestic equity ETFs witnessed net inflows for the eleventh week running, though they took in just $340 million this past week. iShares Russell 2000 ETF (IWM, +$1.2 billion) and Invesco QQQ Trust 1 ETF (QQQ, +$1.1 billion) attracted the largest amounts of net new money of all individual equity ETFs. At the other end of the spectrum, Consumer Discretionary Select Sector SPDR ETF (XLY, -$476 million) experienced the largest individual net redemptions, and iShares MSCI Japan ETF (EWJ, -$351 million) suffered the second largest net redemptions of the week.
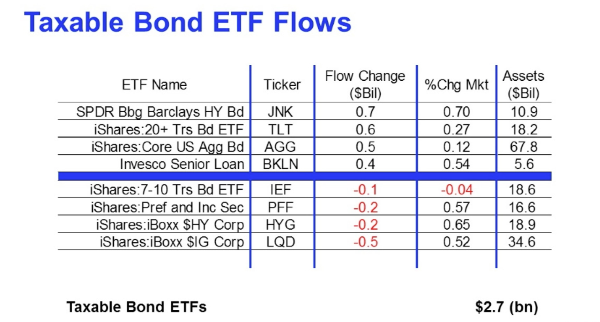
For the third week in four, taxable fixed income ETFs witnessed net inflows, taking in $2.7 billion. APs were net purchasers of corporate investment-grade debt ETFs (+$1.5 billion) and government-Treasury ETFs (+$738 million) while being net redeemers of flexible ETFs (-$150 million) and international & global debt ETFs (-$67 million). SPDR Bloomberg Barclay High Yield Bond ETF (JNK, +$651 million) and iShares 20+ Year Treasury Bond ETF (TLT, +$603 million) attracted the largest amounts of net new money of all individual taxable fixed income ETFs. Meanwhile, iShares iBoxx $ Investment Grade Corporate Bond ETF (LQD, -$500 million) and iShares iBoxx $ High Yield Corporate Bond ETF (HYG, -$226 million) handed back the largest individual net redemptions for the week. For the tenth week in a row, municipal bond ETFs witnessed net inflows, taking in $159 million.
Something has been made very clear over the last several years and since the Great Financial Crisis; the average investor no longer trusts Wall Street and no longer chases its performance.

Simply put, with many Americans focused on capital preservation, investment flows are no longer motivated by the chase for performance or FOMO. Moreover and as it pertains who is buying this market and since the Great Financial Crisis, well corporations of course.
- There has been a 9% year/year decline in S&P 500 share repurchases during the first nine months of 2019.
- Goldman Sachs estimate buybacks will decline by 15% to $710 billion during 2019.
- Buybacks will slide by an additional 5% to $675 billion during 2020.
- Buybacks have been the single largest source of US equity demand each year since 2011, averaging $450 billion annually.
Goldman Sachs expects buybacks to continue to decline in 2020 along with general spending among corporations. But this is largely predicated upon the global economic uncertainty that has plagued corporations over the last 18 months. With recent developments, we might expect the veil of uncertainty to recede and witness a level-setting in corporate buybacks as opposed to a decline. But even if we utilize the base case scenario concerning buybacks put forth by Goldman Sachs, it’s nice to see the individual investor come back into the market in recent months. This is identified in the latest monthly update of the Investor Movement Index (IMX) by TD-Ameritrade.
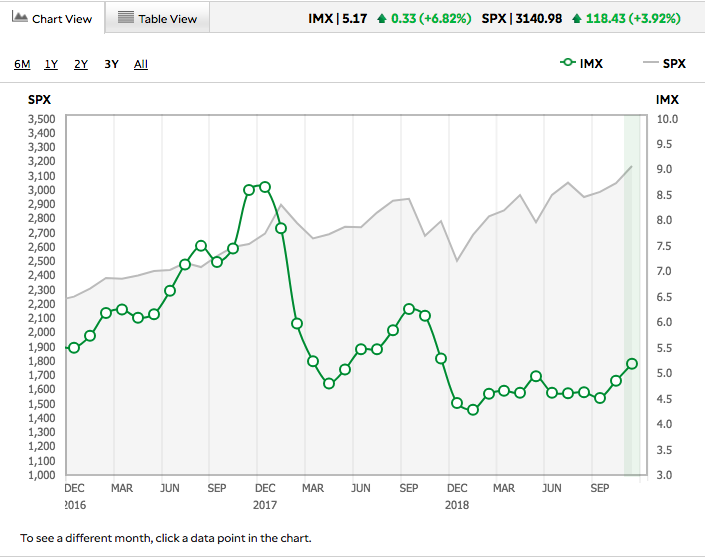
TD-Ameritrade clients were once again net buyers during the period. Less risky assets were in favor, including fixed-income products, while clients increased exposure to U.S. equity markets by buying more ETF products. Net buying in equities with increasing relative volatility also helped push the IMX higher.
TD-Ameritrade clients were net buyers of Walt Disney Company (DIS) during the November IMX period. The stock hit an all-time high during the period as Frozen 2 hit theaters, breaking a box office record for the Thanksgiving weekend, and Frozen 2 toys were popular as holiday shopping kicked off. Microsoft Inc. (MSFT) was a net buy as the company reported its Teams communication app reached 20 million daily active users, and the company received approval from the U.S. Department of Commerce for a license to export “mass market” software to China’s Huawei Technologies. McDonald’s Corp. (MCD) sold off following an earnings miss late last period, and was net bought. Ford Motor Co. (F) was a net buy as it announced plans for an electric F-150 pickup truck, and offered a dividend yield in excess of 6%. Marvel Technology Group (MRVL) reached a 52-week high as the semiconductor company received an analyst upgrade and price target increase with MSFT using MRVL’s ThunderX2 server processor for Microsoft Azure. Additional popular names bought include Beyond Meat Inc. (BYND), Starbucks Corp. (SBUX), and Energy Transfer LP (ET).
TD-Ameritrade clients used market highs to sell some popular names. Big banks Bank of America Corp. (BAC) and Citigroup Inc. (C)both reached 52-week highs during the period as Federal Reserve Chairman Jerome Powell said he was comfortable with the current interest rate stance, and were net sold. Tesla Inc. (TSLA) was net sold as the stock traded above $350 for the first time since January after unveiling its new Cybertruck. General Electric Co. (GE) reached a 52-week high after the company beat on earnings and hired a new CFO, and was net sold. Caterpillar Inc. (CAT) reached a 52-week high as tariff concerns eased, and was net sold. Netflix Inc. (NFLX) was net sold for the third month in a row as streaming wars continue to heat up. Unitedhealth Group Inc. (UNH)was net sold after it increased over 10% during the period as President Trump announced a rule that would require health care insurers to disclose estimate out-of-pocket costs to patients in advance of a procedure, but enforcement of such a rule remained in question. Additional names sold include Facebook Inc. (FB) and Intel Corp. (INTC).
Earnings Outlook
It’s already starting to improve folks. When reviewing FactSet’s Q4 2019 EPS forecast for the S&P 500 it has already been positively revised from last week. Just last week the forecast was calling for EPS to decline during the Q4 period by 1.5% on revenue growth of 2.6 percent. So let’s take a look at the latest forecast from FactSet.
- Earnings Growth: For Q4 2019, the estimated earnings decline for the S&P 500 is -1.3%.
- Earnings Revisions: On September 30, the estimated earnings growth rate for Q4 2019 was 2.5%. All eleven sectors have lower growth rates today (compared to September 30) due to downward revisions to EPS estimates.
- The estimated (year-over-year) revenue growth rate for Q4 2019 is 2.5%.
- Valuation: The forward 12-month P/E ratio for the S&P 500 is 17.8. This P/E ratio is above the 5-year average (16.6) and above the 10-year average (14.9).
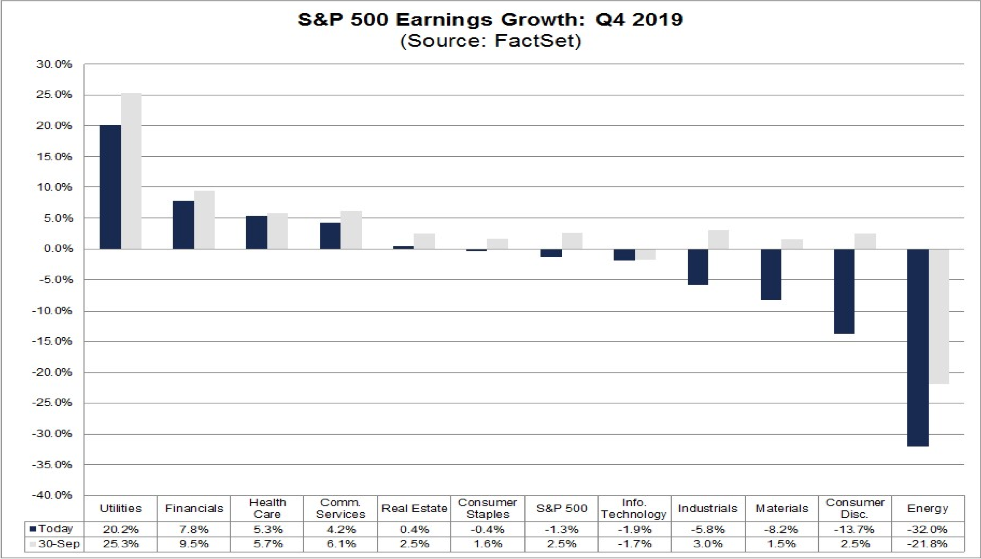
The price of crude oil has risen substantially since November and touched $60 a barrel this past week. The rise in crude oil could provide Q4 2019 results with a boost as the YoY price per crude is more than 15% above the same period a year ago. When we look at the Energy sector earnings growth, it proves to trail only the Consumer Discretionary sector with regards to growth expectations for the Q4 2019 period.
The Energy sector has recorded the second largest decrease in expected earnings growth since the start of the quarter (to -32.0% from 21.8%). Despite the decline in expected earnings growth, this sector has witnessed a 1.9% increase in price since September 30. Overall, 24 of the 28 companies (86%) in the Energy sector have seen a decrease in their mean EPS estimate during this time. Of these 24 companies, 17 have recorded a decrease in their mean EPS estimate of more than 10%, led by Noble Energy (to -$0.08 from -$0.02), Apache Corporation (to -0.12 from $0.12), and Hess Corporation (to -$0.31 from -$0.15). However, Exxon Mobil (to $0.76 from $0.96), Chevron (to $1.59 from $1.81), Occidental Petroleum (to $0.05 from $0.47) and ConocoPhillips (to $0.79 from $1.03) have been the largest contributors to the decrease in expected earnings for this sector since September 30.
Looking forward, here is what FactSet is forecasting in the way of S&P 500 EPS:
- For CY 2019, analysts are projecting earnings growth of 0.3% and revenue growth of 3.8%.
- For Q1 2020, analysts are projecting earnings growth of 5.4% and revenue growth of 4.4%.
- For Q2 2020, analysts are projecting earnings growth of 6.9% and revenue growth of 4.9%.
- For CY 2020, analysts are projecting earnings growth of 9.7% and revenue growth of 5.5%.
While the forecast for Q4 EPS has moved in a more positive direction for FactSet, unfortunately that is not what we have discovered by way of the latest forecast from Refinitiv. Last week, Refinitiv’s forecast called for Q4 EPS to decline by .2% YoY. The forecast has not changed since last week as follows:
- The estimated earnings growth rate for the S&P 500 for 19Q4 is -0.2%.
- If the energy sector is excluded, the growth rate improves to 2.0%.
- The S&P 500 expects to see share-weighted earnings of $335.4B in 19Q4, compared to share-weighted earnings of $336.2B (based on the year-ago earnings of the current 505 constituents) in 18Q4.
Unlike FactSet also, Refinitiv identifies the Energy sector as having the lowest growth rate amongst all S&P 500 sectors. This serves to underscore the relevance of the price of crude here in the month of December and when compared to the same period a year ago. Here is what Refinitiv offers with regards to expectations for Q4 EPS within the Energy sector:
- The energy sector has the lowest earnings growth rate (-34.4%) of any sector. It is expected to earn $13.7B in 19Q4, compared to earnings of $20.8B in 18Q4. Four of the six sub-industries in the sector are anticipated to see lower earnings than a year ago. The oil & gas drilling (-81.5%) and oil & gas refining & marketing (-44.4%) sub-industries have the lowest earnings growth in the sector. If these sub-industries are removed, the growth rate declines to -31.3%.
The Q4 2019 earnings season won’t kick into gear until February of the new year. As such we encourage investors to recognize that while there is an apparent gap in corporate profits relative to the gain in the S&P 500, the market is indeed a forward-looking pricing mechanism. In other words, the market is pricing in a rebound in earning growth, such as has been offered in the 2020 EPS forecast by FactSet and suggested by most market analysts. So when you see a chart from Bank of America Merrill Lynch distributed like this one…
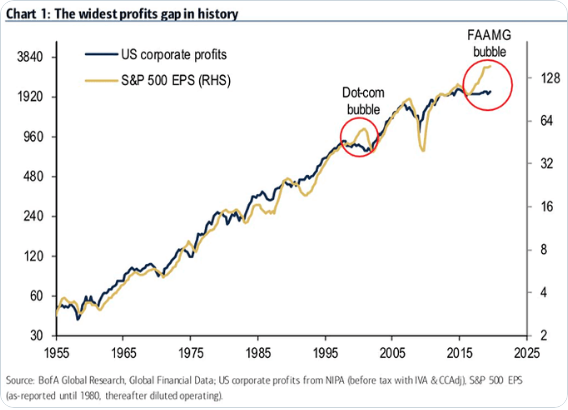
Recognize Three Things In The Chart:
- Dot-com bubble bursting caused the Nasdaq (NDX) to plunge, but not necessarily the S&P 500 or Dow; they slowly grind lower before the 9-11-2001 terrorists attack, which caused these indices to falter.
- The sample size is 2, just 2 folks. That’s hardly enough to create a study of any trend validation.
- Lastly, PE multiples for the S&P 500 grow over time.
Investor Takeaways
The U.S. economy has made it out of a turbulent year in pretty good shape even with a plethora of hurdles placed before it such as a protracted trade war, impeachment hearings, slower global growth, Brexit uncertainty, lower CAPEX spending, a manufacturing mini recession… you get the picture. Gross domestic product (GDP) grew an average of 2.4% in the first three quarters of 2019, higher than the 2.3% average quarterly growth in this 10-year economic expansion, as shown in the chart below. Output growth was helped by strong consumer spending, a modest uptick in government spending, and improved housing sector demand from a year ago. Unfortunately, businesses held onto their cash and non-residential investment dragged on second- and third-quarter GDP. But with a major economic hurdle now removed to a certain degree, some of the aforementioned economic obstacles may have turned into a tailwind for the economy in 2020. (Chart from LPL Financial)
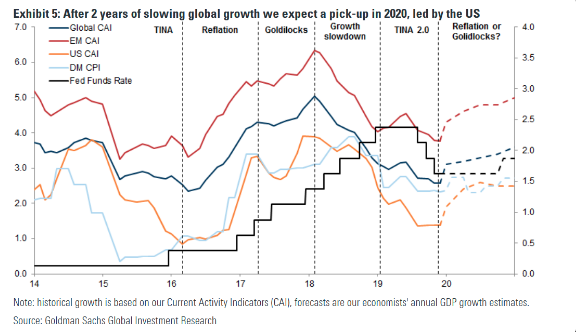
Finom Group forecasts a modest pick up in economic activity in 2020 and with a resumption of global trade volumes. While some analysts are of the opinion that the U.S. economy will prove to be restrained during the upcoming election year, we believe it will lead the global economy once a gain. Goldman Sachs shares this opinion as identified in the chart below:
It’s been said throughout the global and domestic economic slowdown of 2019, that eventually, what has resulted in a mini recession in domestic PMI’s will bleed into the broader economy. The mini recession in PMIs or ISM manufacturing to be more specific is mainly due to economic uncertainty surrounding global trade. This has resulted in a lack of business investment and produced and slowdown in industrial production. So could the slowdown in industrial output and business investment spread to the broader economy? This is extremely unlikely… and why? In the U.S., manufacturing and export activity each account for about 12% of economic output, so the impact of the trade war has been more muted than in other economies like Germany and China. Consumption, which accounts for more than 70% of the American economy, remains reasonably healthy due to strong labor markets combined with wage growth and a consumer which is still borrowing, spending and saving in a healthy manner. .

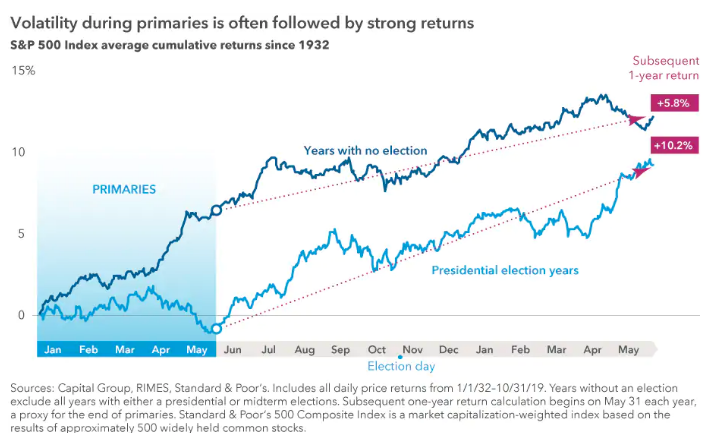
Moreover, the sentiment offered regarding economic growth does not come without its nuances, like market and economic volatility. After all, if we think about the fact that 2020 will be an election year and the candidates are polar opposites, this may cause quite a bit of turbulence as the election timeline draws nearer. With that being said, it is important that investors remember one main point of articulation in 2020: A look at history shows that presidential elections have made essentially no difference when it comes to long-term investment returns. The presidential primaries may bring bouts of volatility, but patient investors have been rewarded regardless of who wins the highest office in the land!
The naysayers and pundits surrounding the economy and market have been found with great error in 2019 and since the beginning of the bull market run. Permabears never learn, as they aren’t necessarily making a market call annually, even though they do predict the end of the bull market annually. What they are really doing is playing the eventuality game; eventually the bull market will come to a halt/end. By playing the eventuality game they can eventually lay claim to “calling the bear market of _ _20“, assuming a bear market is found in the 2020s.
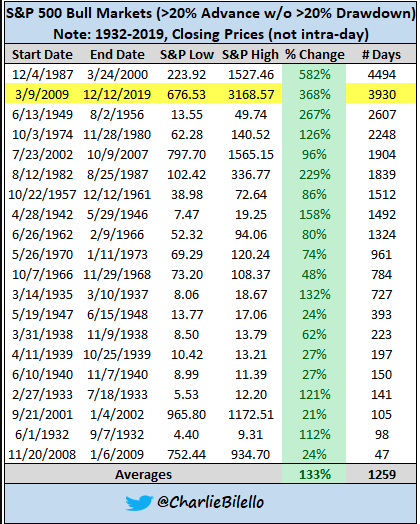
The bull market that began on March 9, 2009 is now 3,932 days old. It would need to last 563 more days to top the longest bull ever (1987 – 2000). Of course the 1987 market crash known as Black Monday was not determined to be a bear market in this study as it was a 1-day event whereby the Dow Jones Industrial Average fell some 22%, but the S&P 500 fell roughly 18% on that fateful day, shy of a bear market that is defined by a 20% drop.
This market has been quite resilient and labeled by many as remarkable. With fund flows moving out of equities for much of the year and bearish sentiment proving the dominant sentiment of 2019, the market has proven to climb the “wall of worry”. Positioning has been just awful amongst institutional investors for much of the year, and remains at relatively low levels.
“There is no euphoria, nor is there a rush to get into the stock market as cash in money market funds remain elevated. As of October, there is $3196.7B in institutional and retail money market funds, up 20.9% y/y and up $802.7B, or 33.5%, from the recent low in this cycle, $2394B in February 2017. The conclusion, many would be investors sat out 2017 and 2018 with a view the bull market had run its course. Coming into November money managers cash levels were also at the highest level since October 2009, and are only $375.5B below the $3572.2B as of March 2009, which was the stock market bottom of this bull market.“
According to J.P. Morgan’s quant team, positioning is higher for systematic funds (e.g., volatility sensitive strategies and CTAs in ~75th percentile), but lower for discretionary and fundamental managers (e.g., discretionary funds ~40th percentile). In 2020, the firm is calling for a “great rotation” of fund flows. They state that outflows from bonds and inflows into equity funds will serve to support equity markets in 2020.
“Retail investors abruptly shifting away from bond funds to buying equity funds, last seen in 2013. “Extremely cautious stance” of retail investors this year had been puzzling and acted as a drag for equity markets.
“Years of high bond flows, such as 2012 and 2017 — and now 2019 — have typically been followed by weak bond fund flows the following year.”
J.P. Morgan has previously argued the cautious behavior left equity markets vulnerable and at the mercy of institutional investors, and now predicts a shift leading to more gains in 2020. The firm’s chief market strategist Nikolaos Panigirtzoglou said: “Given this year proved to be a strong year for equity markets, helped by institutional investors, then we should see retail investors responding to this year’s equity market strength by turning [into] big buyers of equity funds in 2020. This suggests 2020 could be another strong year for equities driven by retail rather than institutional investors.”
Panigirtzoglou recognized that his call faced “a major challenge” from already elevated retail investor equity positions, but said that it was justified by cash and bond yields being significantly less than before following central bank rate cuts.
Something else that has pervaded the minds of investors throughout 2019 and to a greater extent, the bull market since 2009, is the notion that all the market’s gains have been fake, faulty and a product of financial engineering. Many investors make the mistake of buying into this pervasive and misleading narratives. Don’t be that investor/trader, it’s not going to prove an advantage for your portfolio but rather a drag on it over time.
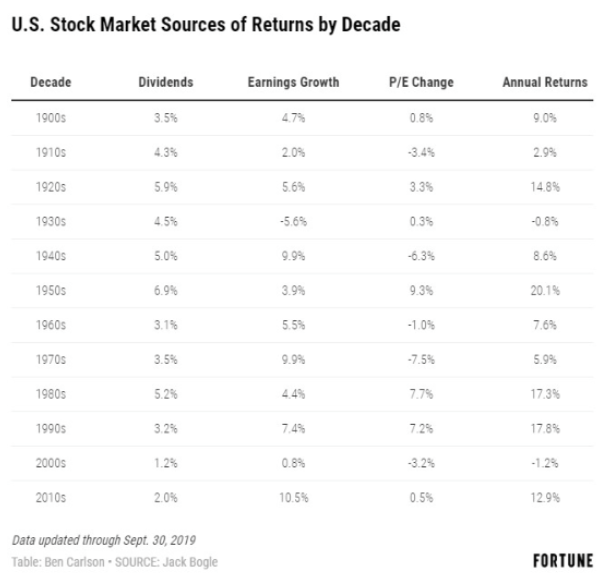
The table above tells us a far different story than the pervasive and misleading headlines. The “fundamentals” have been the clear and present driver of the S&P 500’s ascent since at least 2010. Stock market valuations have also risen in accordance with corporate profit growth. This takes us back to the Bank of America Merrill Lynch chart positioned earlier in this report. Although corporate EPS is likely to fall slightly in 2019, the PE multiple has expanded. But should the EPS rebound that is highly anticipated come to pass in 2020, we are likely to see mean reversion in the PE multiple, validating that even over the period from 2019-2020, earnings will have dictated the S&P 500’s rise.
The longer-term outlook for the economy and markets remains one of optimism, especially after the announced phase-1 trade deal. While the deal has not found “ink” just yet, we remain “on alert” for any potential retraction of the verbal agreement.
Our near-term outlook for the S&P 500 is found with an expected melt-up into year end. Outlooks are not without there fault or guarantees, but nonetheless, we are of the opinion this outlook is the greatest probability absent any exogenous shock. Technically speaking markets are very much overbought and over-extended and naturally this suggests a pullback is on the horizon, but we continue to suggest that if a pullback should ensue it is not something to fear, but rather embrace by putting capital to work.
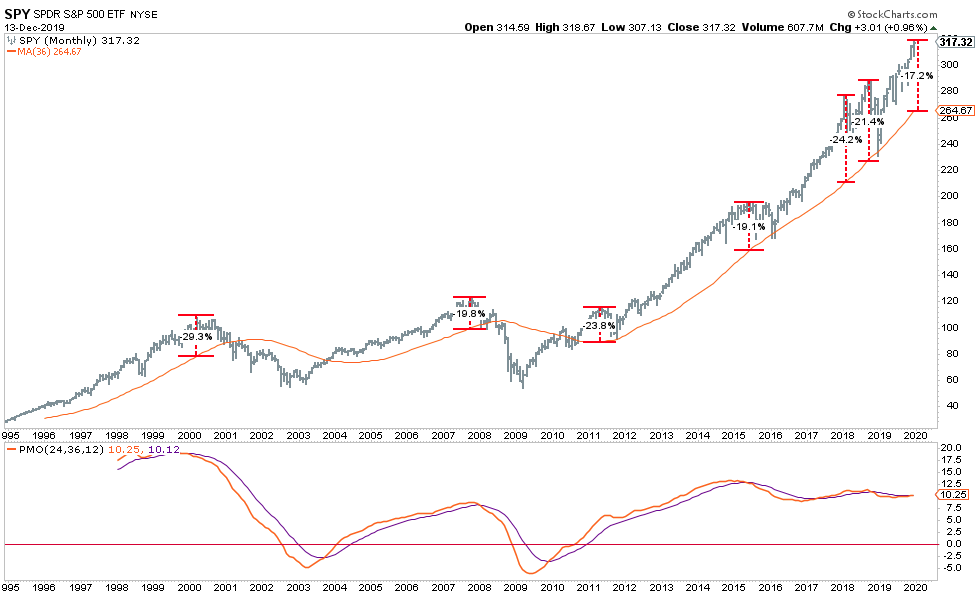
One last review of the market technicals for SPY on a monthly basis suggests the same deviation from long-term (3-year) moving averages. In the chart below it is clear to see how overbought the SPY truly has become. Historically, when extensions from the long-term moving average are this extreme, corrections have occurred. In most instances that reversion entailed a correction back to the long-term mean. (Chart from Lance Roberts of Clarity Financial)
Having said that, market liquidity remains an obstacle for such a countertrend move in the SPY or the broad market indices. This is something Seth Golden and Wayne Nelson discussed in the latest State of the Market video found here.
The other technical aspect that comes into view from the S&P 500 is that there remain two open gaps modestly below the current price level.
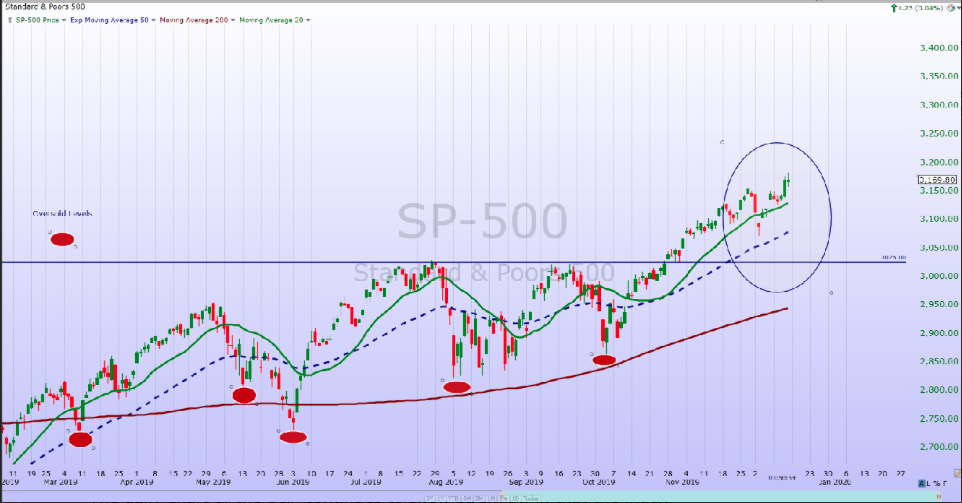
The gaps are highlighted on the chart at 3,094 and 3,119 (Chart provided by The Savvy Investor). For those that may be unfamiliar with “gaps”, there are many technicians that believe all price gaps in a chart must be filled. This is mainly true from a historic perspective, but not a 100% truism as some gaps have never been filled.
The market recently had a 2.5% distribution or digestive phase just last week and dating back to 2 Friday’s ago. The rather rapid 3-day decline we witnessed then may have seemed like a pullback given the lack of any meaningful downside move in the prior six weeks, but it barely registered in terms of any particular technical damage. As such, it does not qualify as a pullback and why we characterize it as simply a digestive period in preparation for the next leg higher, which was found in short order.
Ok folks, we’ve become a bit longwinded with our latest Research Report, but we think you get the near-term and longer-term picture given all the material within.
Again, we thank all of our Finom Group members for their dedication to our weekly analysis of all things macro and micro. Enjoy the holiday seasons and trade safely!


