
What happens when the threat from the ongoing trade war abates? Naturally, the melt-up ensues. This is not to discount the the surge in the S&P 500 since October, but rather to highlight the seasonal trends that suggest the last couple of weeks in December are usually found with the major averages advancing.
The Dow Jones Industrial Average (DJIA) advanced 100.51 points, or 0.4%, to 28,235.89 but cuts its gains nearly in half by the end of the trading session. Despite the issues surrounding the largest weighted stock on the blue chip index, Boeing (BA), the index set its first all-time closing high since Nov. 28. The S&P 500 (SPX) rose 22.65 points, or 0.7%, to 3,191.45, while setting an all-time high of 3,197 on the day. The Nasdaq Composite Index (NDX) jumped 79.35 points, or 0.9%, to 8,814.23, also marking new record closes. And now…
The markets are still likely to melt-up into the end of the year, with the S&P 500 eyeing the 3,200 level, whereby we wouldn’t discount a top level print of 3,220 being achieved. No guarantees, of course, and as markets turn their focus back to the economic data and Brexit headlines. Nonetheless, investors shouldn’t discount just how much investor angst was encapsulated by the trade war, as evidenced in the most recent Bank of America Merrill Lynch Fund Manager survey (FMS).
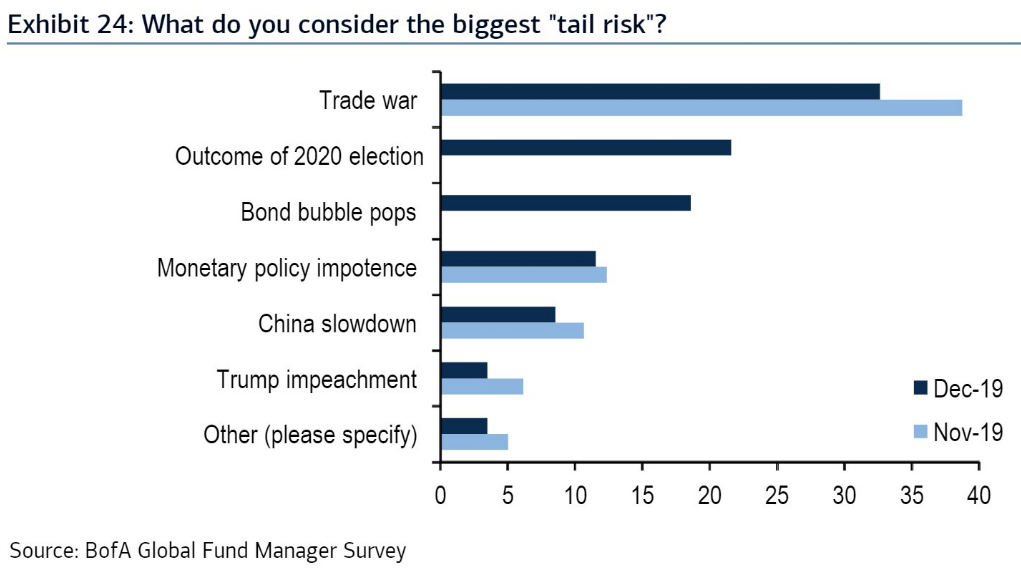
There’s been a good deal of bluster, rhetoric and posturing throughout the trade war between the U.S. and China, and much is being scrutinized regarding the efficacy and magnitude of the phase-1 agreement. The agreement is slated to be signed in Washington D.C. come the 1st week of January, but this may prove a moving target as well. Having said that, it is probably safe to say that not much is being GAINED from the phase-1 trade deal and much of what had been lost in the way of U.S. agricultural purchases is simply being restored.
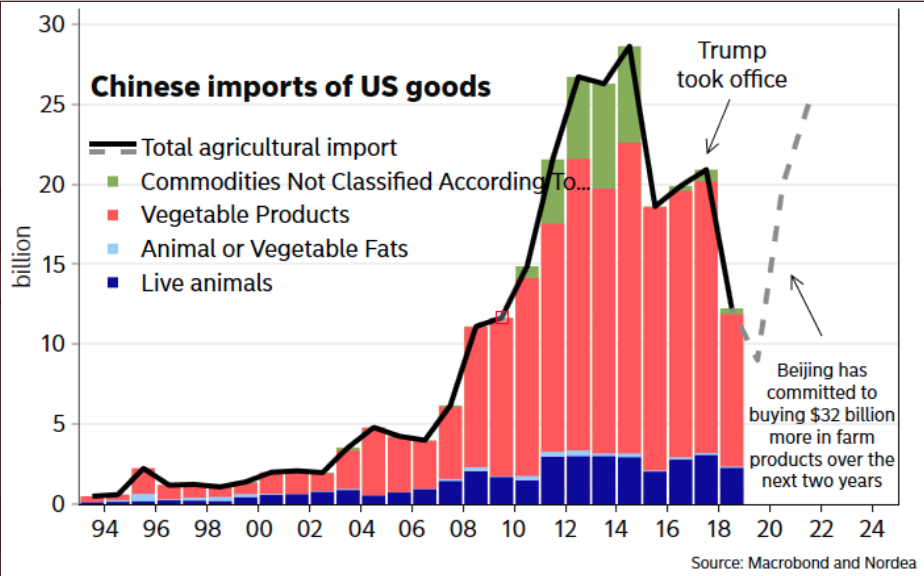
One can easily argue that for all the noise and all those tariffs thrown about over the last 18 months, the phase-1 trade agreement just takes agricultural purchases marginally above the level they were at when President Donald Trump took office. The collateral damage, however does seem more exponential, however, when we look at industrial production, global PMIs and business investment. Nonetheless, we don’t desire to dwell on that which we cannot control and that which has found de-escalation and a remedy of sorts.
At present, there’s not too much to complain about when it comes to the S&P 500, unless you have been waiting for a pullback. Breadth and market internals are still strong. If one was to nitpick, they might say breadth/internals are too strong and at levels where we usually see a pullback. Finom Group doesn’t discount this sentiment, especially with the S&P 500 well above it’s 200-DMA, well above! Additionally, the percentage of S&P 500 stocks trading above their 200-DMA has reached levels that usually coincide or foreshadow a pullback. (Willy Delwiche)
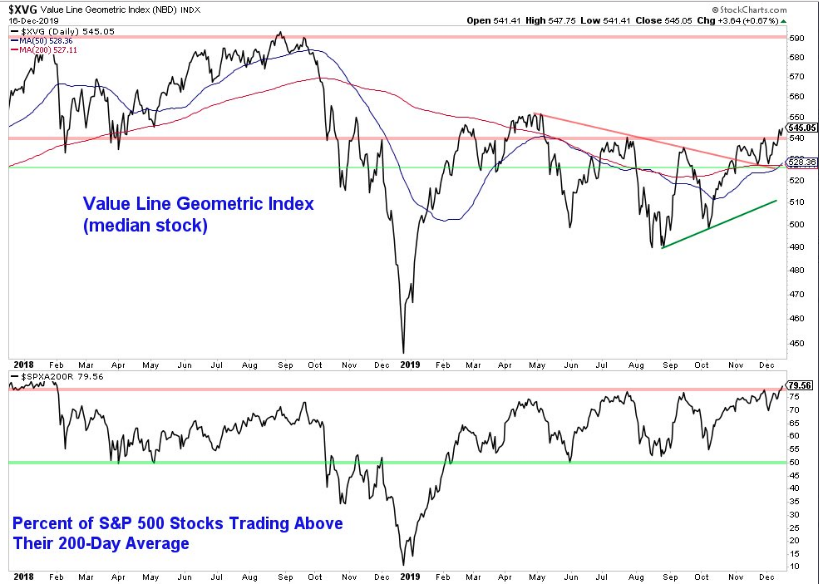
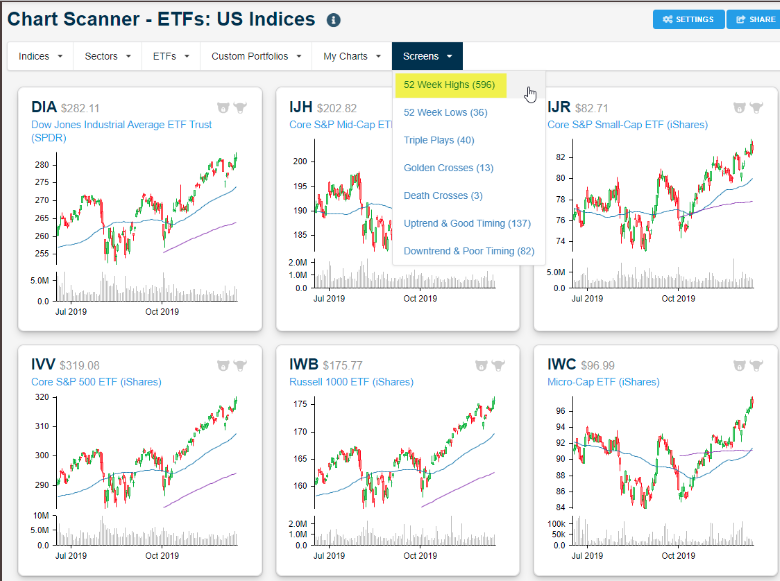
While the chart does suggest overbought conditions, the market has proven it can remain overbought for an extended period of time, especially when fear abates as a major market headwind is removed i.e. trade war. Additionally, there are also a great many market breadth metrics to consider and not all are confirming a pullback is imminent. When we review the number of stocks hitting new 52-week highs vs. 52-week lows, this also tells us that the surge in equities is more broad based.
Just this past Friday, 596 new 52-week highs were achieved vs. just 36 new 52-week lows, according to the Bespoke Investment Group database of U.S. stocks and ETFs. Kind of the big picture folks, kind of the forest and the trees!
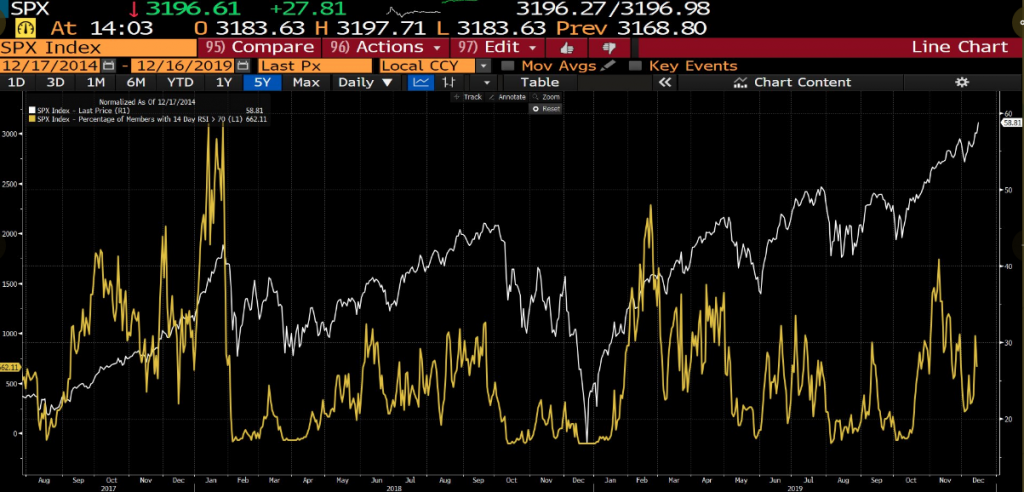
Despite the constancy of the market rally over the last 2-months, the percentage of stocks that are overbought based on the relative strength index (RSI >70) is still rather benign at just 26 percent. Compare that to Jan 2018′ when the percentage of SPY stocks had RSIs over 50 percent. (Spike in yellow line off to left side of chart)
Due to the fact that there are so many breadth/internals we can analyze on a daily basis, extreme divergences are usually what investors/traders should look for. At present, such divergences are not showing up and validate the suggestion that market breadth is strong supporting overbought market conditions. Under such a paradigm, the market would need a catalyst to produce a pullback on the order of 3-5%, as in its absence the melt-up scenario may prove to dominate market activity through year-end. But when that pullback/corrective phase occurs, it’s best to know what to do with that “opportunity”.
Here are all the S&P 500 corrections since 1980. Future returns are not surprisingly strong.
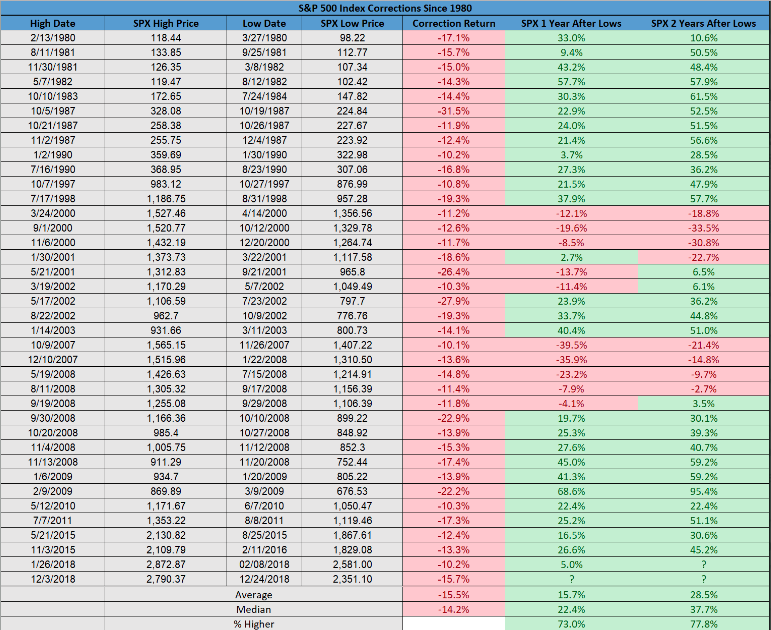
What may prove more interesting is that if there isn’t a recession, stocks are nearly always higher 12 months later. This speaks loudly to what took place in the markets in December of 2018 and when the economy was strong, yet stocks corrected. Markets can be usurped by fear of what the future might bring, when the FOMC is tightening and found less accommodative. It’s with the FOMC in mind that many are of the opinion that even when the calendar year switches over to a new decade, the market may continue to find new highs.
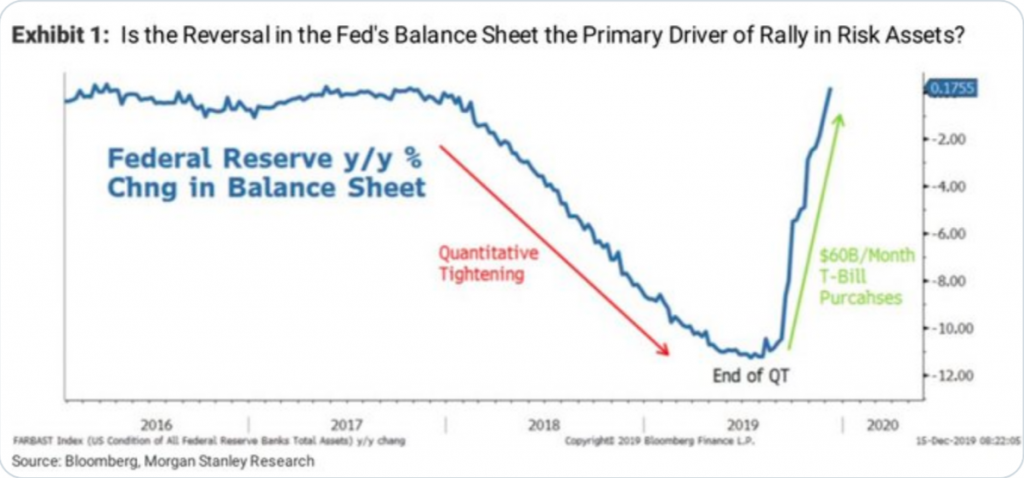
Morgan Stanley’s chief market strategist Mike Wilson offered that as the Fed continues to expand its balance sheet in Q1 2020, the market can continue to rally.
“The market rally “may be more due to the [Fed] balance sheet reversal than fundamentals,” .. but with $60B/month scheduled through Q1, “we think this presents a powerful positive force that can take stocks well above fair value between now and then.”
As we head through the final 2 trading weeks of the calendar year and decade, we can’t help but to look back on 2019 with an eye on 2020. Investors have found a decade worth of market gains and post one of the most devastating financial crisis the U.S. economy has ever seen. This identifies the resiliency and flexibility of the U.S. economy and financial system, for better or for worse. It has been argued, that with a decade of market gains achieved, it has also proven a decade of market complacency that has somewhat underlined central bank market engagements. With this in mind let’s take a look at some market metrics and market volatility.
2019 is proving to be the 2nd best year for the stock market in 20 years. Year-to-date the S&P 500 is now up some 27.31 percent and likely to add to these gains before the year is completed, absent an exogenous shock of course.
If we had told you at the beginning of the year that 2019 would find market volatility dampened as the trade war escalated, U.K. political upheaval ratcheted higher on Brexit deal failures, U.S./Iran relations were found intensifying and market outflows have only been greater during the Great Financial Crisis, you might have thought us a “bit touched”. But that is exactly what has taken place in 2019, below average volatility. This has also proven a year that where everyone thought the market was going to do “this”, and yet the market did “that”.
Now don’t get us wrong; the market’s measure of implied volatility (VIX) is not reminiscent of VIX levels from 2017 and when the VIX hit a record low below 9%, but it is below the median average of roughly 17.42.
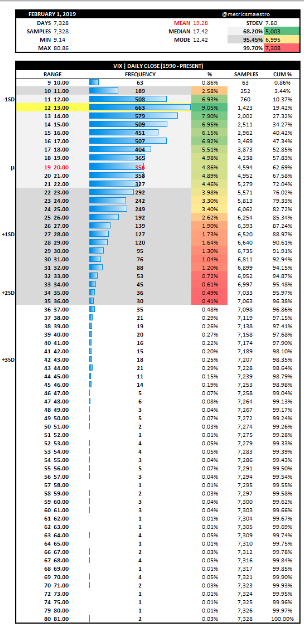
Additionally, keep in mind that while it has become popular to suggest that the VIX is a mean reverting instrument, this is actually a market farce. The VIX is a mode reverting instrument as it desire complacency more so than anything else. The historic VIX mode is far below the average or mean at 12.42. With that being said, 2019 has still found a semblance of complacency and an average reading below the mean. The low for the year was also as recent as the end of November at 11.54 on 11/26.
The question, at this point on most investors’ minds, is whether or not the VIX will revert higher or move lower on average in 2020. The following statistical data is offered by DataTrek and with certain corrections offered by Finom Group’s chief market strategist, Seth Golden:
- This year’s average VIX is 16 thus far versus the long-run average of 17+.
- Given that the standard deviation is 6 points, this year’s volatility is still within one standard deviation of the average. So while it is below the long run mean, it’s still within normal bands.
- Years with a below average VIX tend to cluster or string together. There were 6 years with below average volatility from 1991 through 1996 and 4 from 2004 to 2007. Keep in mind the Fed was cutting rates in 1995 and into 1996 and the Fed was tightening in 2004, 2005 and 2006. The theory that the Fed is the main cause of volatilty tamping doesn’t always ring true given the contrasting Fed actions in the dates exampled.
- The current period has been the longest continuous streak, with a below average annual VIX each year since 2012 (8 years).
- The annual average level on the VIX has been 16 after a year with a below average VIX level.
Based on the statistical data, we could certainly anticipate that 2020 is another year of below average VIX readings, but for the sake of the presidential election and an otherwise aging economic cycle. You simply never know for sure and history doesn’t always repeat.
Moreover, one of the other ways we analyze market volatility is by how many days for which the S&P 500 itself moves 1% or more. Looking at 2019 and moving forward, DataTrek statistics are outlined below:
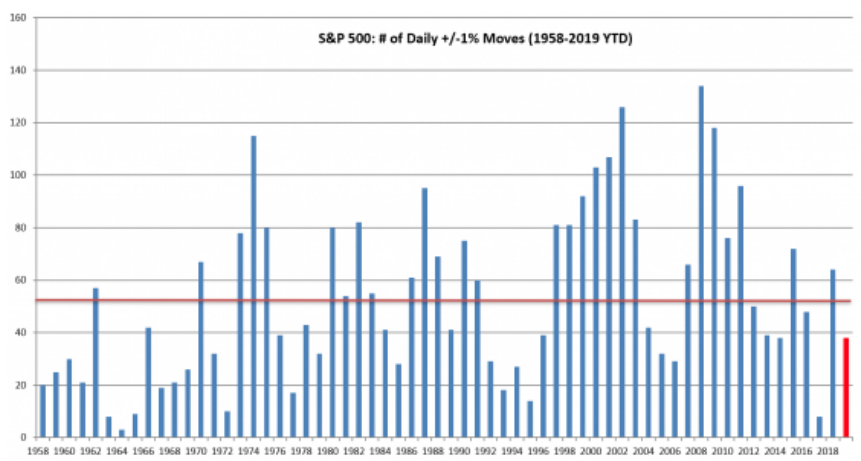
- The S&P 500 has increased or dropped by 1% or more on 38 days this year compared to the annual average of 53 back to 1958 (first full year of data).
- This year’s number of 1% days is within one standard deviation (32 days) of the average. So just as with the VIX, the number of 1% days this year is below average, but also common enough.
- The S&P 500 has had a lower than average number of 1% days in 55% of years over the last 6 decades, so lower volatility than the average is actually more common than higher volatility. There are typically 39 1% days in the year after a year with lower-than-average volatility. In other words, years with lower than average volatility are usually followed by another year with below average volatility as measured by 1% days.
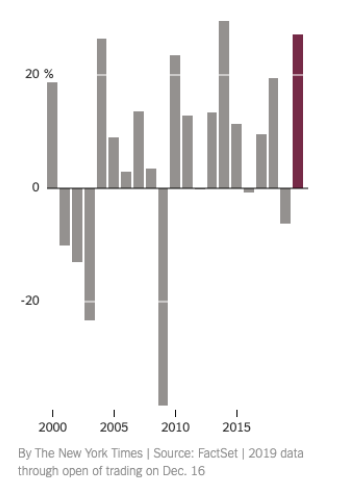
- That said, volatility tends to be cyclical. Our bar chart of annual S&P 1% days after this section shows a clear pattern over the last six decades. Large market swings happen during the start of a bull market, abate and then rise again towards the end of annual sequential gains in U.S. stocks.
All the statistical data noted provides investors with probabilities going forward, not guarantees. Much of 2020’s market volatility will be determined by global trade outcomes, whether or not global PMIs rebound and to what degree and the volatility that may coincide with the presidential election cycle.
Just as a good deal of noise is starting to leave the market, the melt-up noise enters. As an active trader, the market will always present headwinds or concerns. The media does a fantastic job of making the everyday commonality appear sensational or extreme as they hyperbolize that which is commonplace. That’s essentially what takes place on a daily basis and why we see so many searches taking place surrounding the phrase melt-up now.
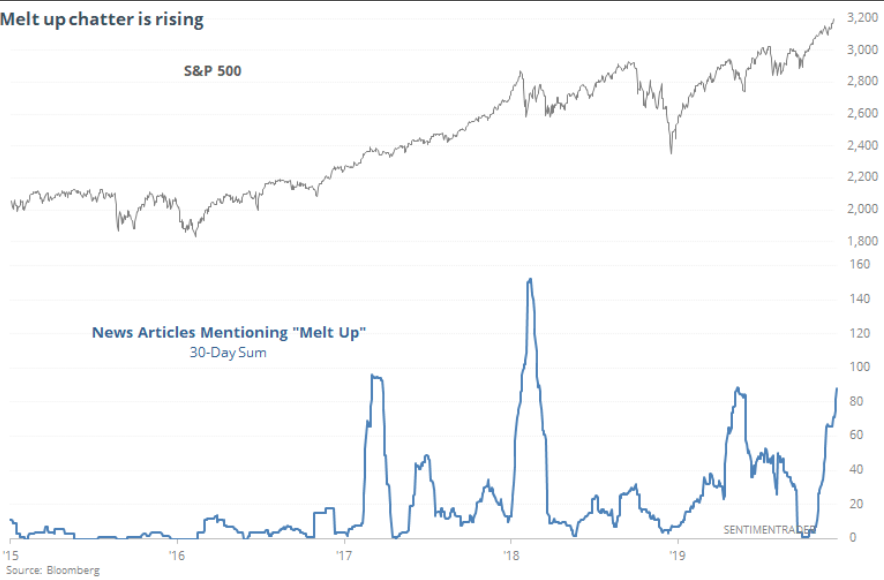
We haven’ see this many news articles mentioning the phrase melt-up since January of 2018. Of course, everyone remembers how that ended with a whimper and/or significant market correction in February. We can’t predict how the current melt-up phase will end, but Bank of America’s Michael Hartnett expects that the S&P 500 will hit a target of 3,333 by March 3rd in what he calls a “front-loaded” 2020. Most investors wouldn’t mind such an outcome in our opinion. Hartnett offered the following notes to clients over the weekend:
“A more than 5% rally could be in the cards for the S&P 500. Fed & ECB still adding liquidity, Conservative Party majority (Brexit resolution) & reports of phase one US-China trade deal to resolve main two global macro tail risks & remove lingering … risk premiums.”
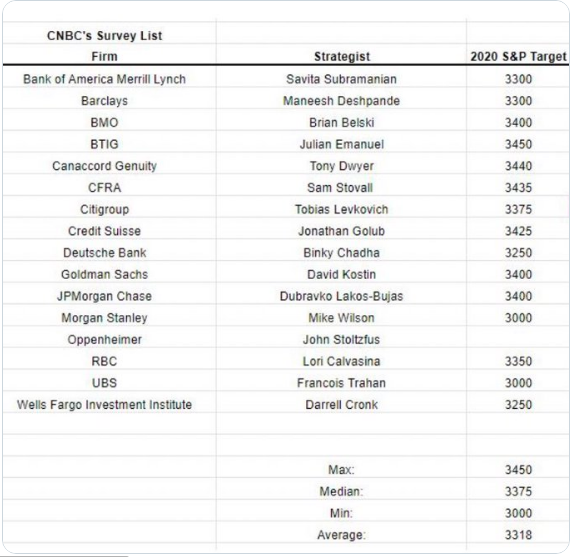
As investors look to strategists and analysts for S&P 500 forward looking estimates on EPS growth, they also eye S&P 500 targets or gains from the previous year. Right now, CNBC’s strategist survey shows a median predicted 2020 S&P 500 gain of 6.5% to 3,375. The average forecast is up 5%, and the maximum target right now is 3,450 by BTIG’s Julian Emmanuel, which would be about a 9% advance.
This sounds reasonable given historic annual gains. The long-term average annualized gain for U.S. stocks is right in that zone around 8 percent. However, however, however… that is the average. When we look at averages, they can be skewed by outsized gains, like those achieved in 2019 and 2013. For this reason, we point out that since 1928, the S&P 500 has only showed a gain of between 5-10% six out of the 91 calendar years, suggesting the consensus forecast for a high-single-digit rise in 2020 has a 93% chance of being wrong. It could be wrong to the upside or the downside, we simply won’t know until 2020.
Moreover and according to CNBC’s Mike Santolli, here is the aggregated sentiment and/or best guess from Wall Street participants about how 2020 will likely unfold:
“Recession will be avoided and the global economy will pick up in coming months, with U.S. GDP returning toward long-term trend growth around 2%. Corporate earnings will improve to a mid- to high-single-digit growth rate, which should allow for similar progress for an already fully valued equity market. Overseas stocks have a good chance to outperform after years of severely lagging the S&P 500. Within the U.S. market, cyclical sectors should do better than defensive or secular-growth areas. Bond yields probably won’t move much with the Fed on indefinite hold. The first part of the year should be strong – but expect more volatility ahead of the election.”
Ahead of the market open on Wall Street Tuesday, equity futures are modestly lower, after cutting gains in half on Monday. This is actually typical of “melt-up” conditions; the market ratchets sharply higher, cuts its gains on the day and only to recapture those gains and more in the coming days. It’s not a massive one day spike.
Investors will find themselves eyeing the economic data due out on Tuesday, as Monday’s economic data releases proved stronger than previous reports. The New York Fed’s Empire State business conditions index showed manufacturing conditions inched up 0.6 point to 3.5 in December, the regional Fed bank said Monday. Economists had expected a reading of 4.0, according to a survey by Econoday.
While regional manufacturing indexes are only modestly improving, the housing sector data has been a beacon of economic strength in 2019 and after a year-long drought in 2018. The National Association of Home Builders’ monthly confidence index increased five points to 76 in December from an upwardly-revised 71 the month prior, the trade group said Monday.
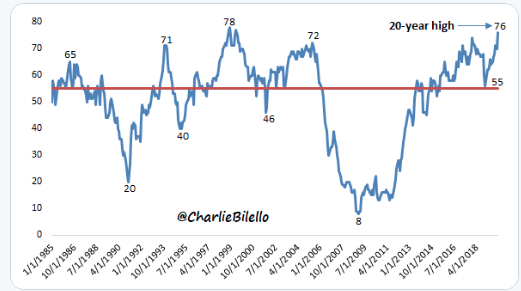
December’s figure represents the highest index reading since June 1999. And while the Builders confidence index jumped nicely in December, investors are now looking forward to the release of Novembers Housing Starts and Building Permits data. Housing Starts are forecasted to rise on a MoM basis according to economists polled by MarketWatch, but this may become impacted by revisions to the October data and if the revision is to the upside.
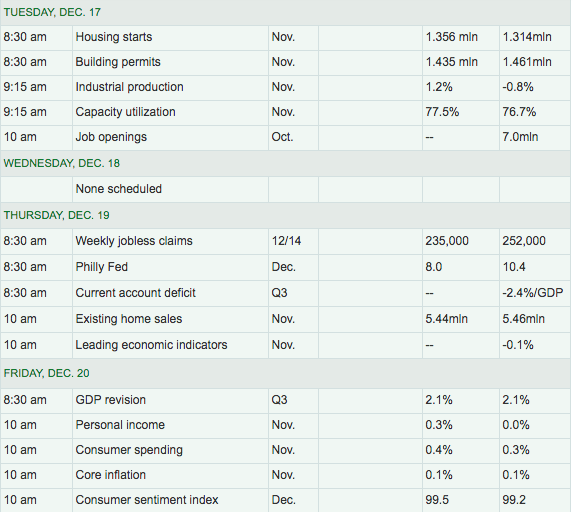
In addition to the housing sector data released on Tuesday, the JOLTS survey and Industrial Production data is slated for release. Taken together, we’ll be eyeing the revision to the Q4 GDPNOw forecast from the Atlanta Fed this afternoon.
With all that being said, we encourage investors to embrace near-term market volatility if it should come to pass and coincide with lesser market/stock valuations. Economic conditions, supported by central bank policies simply don’t outline a near-term recession. Strong consumer balance sheets and healthy consumer spending point to improving sales and earnings in 2020. How much of this sales and earnings growth is priced into the market, however, remains the unknown. As an investor, it’s always a good idea to recognize and remember that PE multiples expand with time. To some degree, this alleviates the concern of what’s priced in and what’s not in the interim. Happy Trading!


