

Research Report Excerpt #1

The data remains our guidepost (S&P 500 forward returns after falling below 200-DMA above table), which was a message also highlighted in Fed chairman Jerome Powell’s press conference this past week. So I ask of you, “If the Fed remains data-dependent, then why shouldn’t you? Furthermore, if much of the pessimism around the market price action in 2022 centers on the Fed’s newly positioned tightening cycle, and THEY are going to execute this tightening cycle with a flexible approach as they monitor the DATA, why shouldn’t you do the same with your approach to the market and portfolio management?”
Research Report Excerpt #2
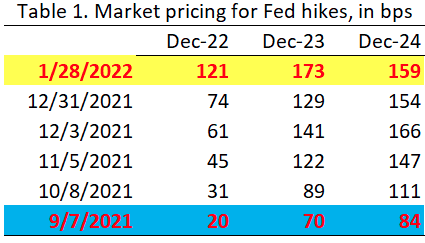
Markets are now pricing five, 25bps Fed hikes in 2022 and cumulative hikes of 160bps out to 2024 (yellow). This is a huge change/shift from September 2021 (blue), when the total hiking cycle was half of today’s projections. That is just how quickly things have changed and may change in the foreseeable future, as the economic data and markets guide the Fed’s path.
Research Report Excerpt #3
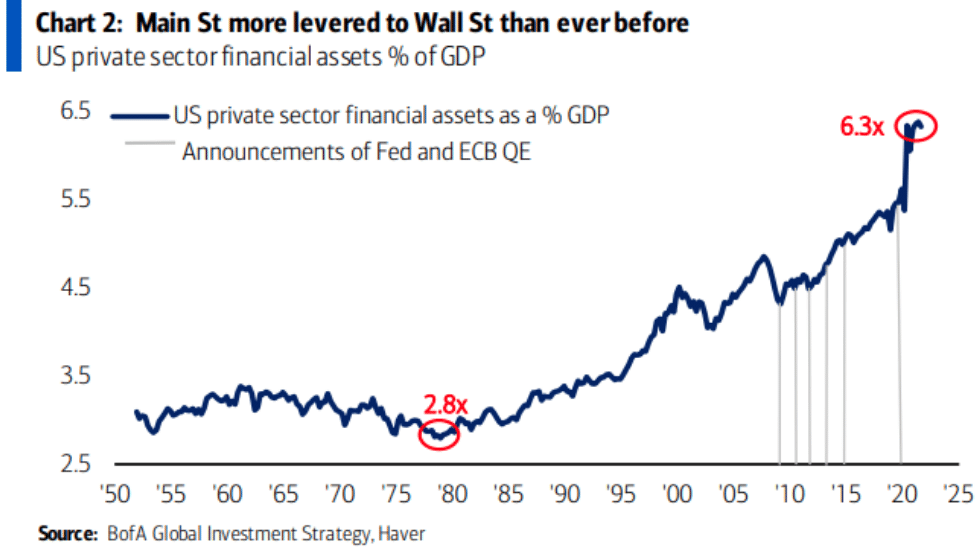
The average household investor is more levered to Wall Street than ever before (U.S. financial assets are 6.3x the size of U.S. GDP). Essentially, the quickest route to recession is a Wall Street crash? This is exactly what the Fed stated it wants to avoid. Fed chairman Jerome Powell indicated, that in order to achieve their price stability mandate, they would need a longer expansion cycle. The Fed isn’t oblivious to the chart identified above, it’s part of their data-dependency. I think it is safe to say that even a 20% decline in the S&P 500 would push Fed tightening to the sidelines, as it did in 2018.
Research Report Excerpt #4
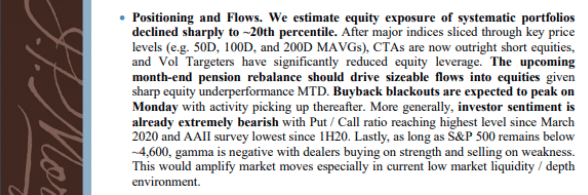
It wasn’t until Thursday that this note above came out, from the team at J.P. Morgan, which further validated our assumptions for month-end inflows. Given the weight of the evidence, and experience from market mechanics during downturns, it was safer to assume month-end flows would backstop further declines and support the markets. This gave us confidence during the trading week to continue shorting volatility (VXX) and buying dips.
Research Report Excerpt #5
This type of poor breadth has usually produced goodly size drawdowns in the past. In order for the Nasdaq to find a bottom, it needs to stop producing more New Lows than New Highs first. While this breadth indicator did improve on the week, it is still a flashing a cautionary signal for individuals with near-term trading horizons.

As we can see, the pace of Nasdaq New Lows relative to New Highs remains a concern near-term. This is more in-keeping with the Nasdaq’s extremely modest .01% gain for the week. Longer-term, we view this as a strong buying opportunity for Nasdaq and Growth-oriented investors i.e. Tech/FANMAG/Growth. Very rarely do we see this breadth indicator this weak without the Nasdaq higher 12-months later.
Research Report Excerpt #6
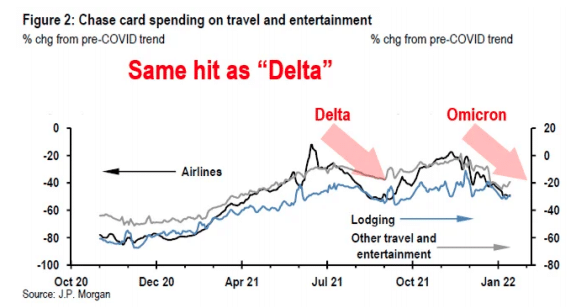
As Omicron fades across the U.S., the natural question would be whether we can expect a bounce in consumer spending or not. The chart from J.P. Morgan on Chase credit card data shows the impact on consumer spending due to Omicron was akin to the previous Delta variant:
- Omicron impact was notable on airlines, lodging and travel.
- Omicron impact similar to the hit seen on Delta.
Personal income increased 0.3% and spending declined 0.6% in December after respective gains of 0.5% and 0.4% in November. Compensation rose 0.6%, the same as in November. Wage and salary income climbed 0.7% from 0.6% previously. Disposable income edged up 0.2% from November’s 0.4 percent.
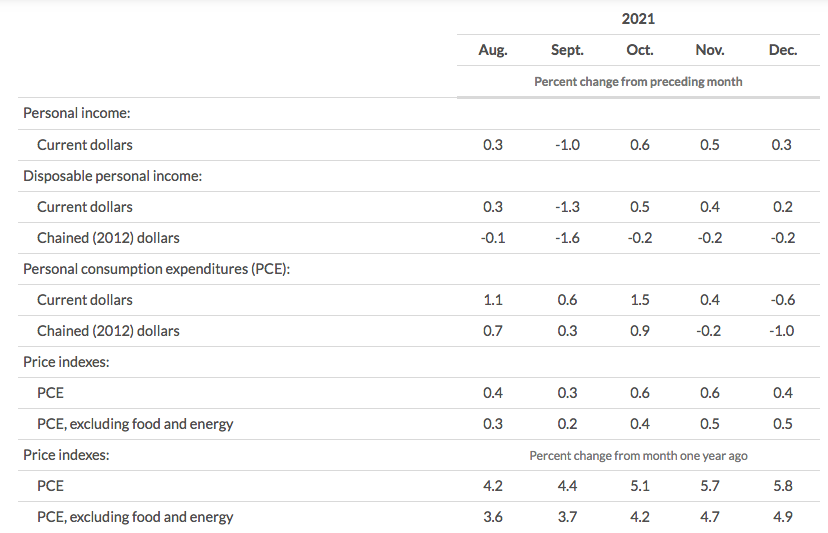
The savings rate increased to 7.9% from 7.2 percent. As I always offer, this is a much more savvy consumer than in anytime over the last 50-60 years. The PCE deflator, the FOMC’s preferred measure, increased 0.4% on the month after the 0.6% gain previously, with the core rate rising 0.5%, as it did in November. On a 12-month basis, the headline rate climbed to a 5.8% YoY pace from 5.7% year-over-year.
Research Report Excerpt #7
There are many recession indicators, but the yield curve is one that is most monitored by the Federal Reserve. It has predicted 10 of the last 8 recessions, meaning it was wrong at least twice. The yield curve inverting doesn’t cause a recession, it simply denotes the expansion cycle is presenting enough conditions to distort financial market conditions, which ultimately can lead to a recession down the road. How far down the road you might ask?
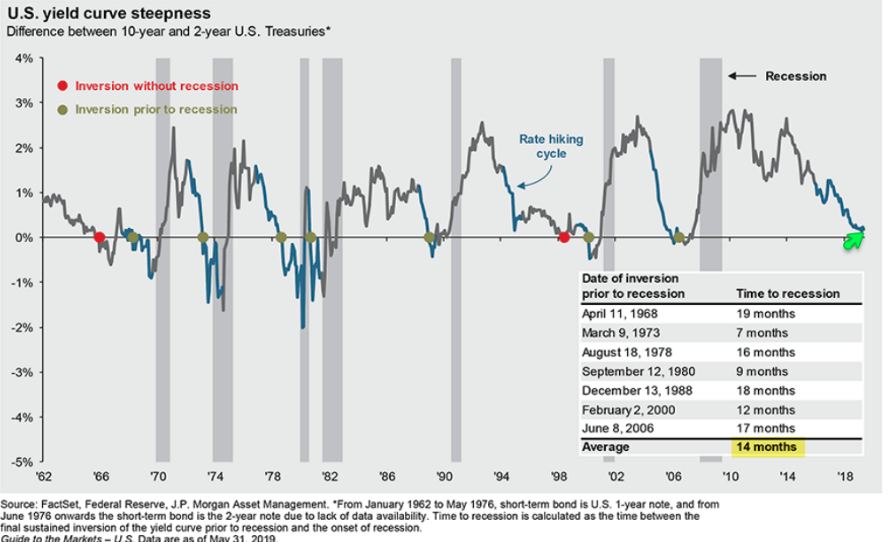
J.P. Morgan Chase outlined their studies on yield curve inversion, the average time before a recession occurs once the yield curve initially inverts. Based on the table in the chart above, J.P. Morgan’s data suggests a recession occurs, on average, 14 months after the inversion. The table does not include the 2020 self-induced recession, which occurred 6 months after the yield curve inverted in August of 2019. Obviously, once again the yield curve did not cause the 2020 recession, nor could it predict the pandemic.
Research Report Excerpt #8
The Fed wasn’t tightening in 2011, as there were many economic concerns stemming from the ensuing European Debt Crisis and how that might spill over to global economic growth. Moreover, what the headlines generally prove to mask is the rate of change in growth.

Economic growth was weak in early 2011 as it was “lapping” the lofty growth levels from 2010, which 2010 was lapping depressed economic growth levels from 2009 and with the aid of economic stimulus. It’s highly probable, that 2022, mirrors the economic growth trend of 2011; weak growth in Q1 followed by a strong Q2 and further monetary tightening stalling growth again in Q3 and with inflation easing which suppresses sales growth. That Q3 stalling of growth potential, would then set a low bar for Q4 economic growth to hurdle. Rate of change accounts for the majority of economic growth outcomes in a $19trn economy.
Research Report Excerpt #9


