

Research Report Excerpt #1
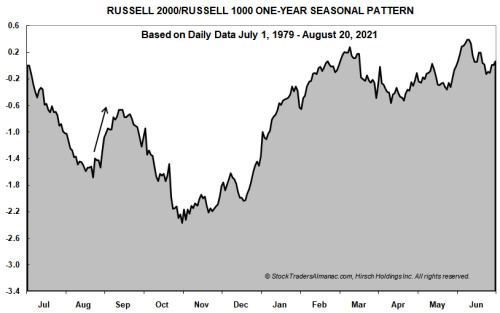
- In the above chart, daily data since July 1, 1979 through August 20, 2021 for the Russell 2000 index of smaller companies are divided by the Russell 1000 index of largest companies, and then compressed into a single year to show an idealized yearly pattern. When the graph is descending, large-cap companies are outperforming small-cap companies; when the graph is rising, smaller companies are moving up faster than their larger brethren.
- In recent years, another sizable move is quite evident just before Labor Day. One possible explanation for this move is individual investors begin to return to work after summertime vacations and are searching for “bargain” stocks. In a typical year, small-caps would have been lagging and could represent an opportunity relative to other large-cap possibilities. As of today’s close, Russell 2000 is up 13.4% compared to the Russell 1000 being up 19.0% year-to-date. Lagging small-caps and resilient U.S. consumers could be the ideal setup for a repeat of this pattern this year. However, the small-cap advantage does historically wane around mid-September. (Stock Trader’s Almanac)
Research Report Excerpt #2
Our first quantitative study of the week was offered back in April of this year. The criterion of the study denotes that greater than 90% of S&P 500 stocks traded above their 50-DMA on April 14, 2021. This depicts extremely strong market breadth. As a side note, such strong breadth will always prove unsustainable.
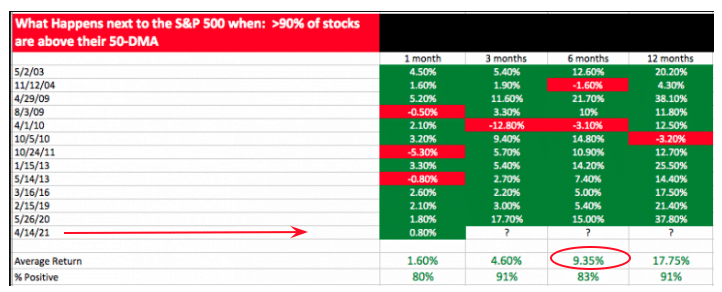
Dating back to 2003, when the interim breadth proves this strong, the forward S&P 500 returns are usually positive out 12 months. The % positive rates are all 80% or better across the aforementioned time frames. The average return after the breadth criterion helps investors better understand what they might expect going forward from the S&P 500. Indeed, the market was higher 1 and 3 months later, after the signal. The market is up ~8% since the signal. Six months after the signal, the average return for the S&P 500 is 9.35%, which certainly doesn’t leave a lot of meat on the bone, but look at the 12-month return and % positive rate past the date of the signal. The 2021 S&P 500 has achieved GREATER GAINS than many of our quantitative studies have offered in the past, so don’t get married to the average return, it is but a probability.
Research Report Excerpt #3
Since July, the S&P 500 has had 5 separate win streaks of at least 5-trading days. In early July, there was also a streak of 7 positive days in a row, for which the S&P 500 was also up 7 days in a row. We outlined the study from LPL Financial, which points to this achievement below:

- The S&P 500 Index was recently higher 7 consecutive days for the first time since last August, but even more impressive is it made new highs all seven of those days.
- You have to go back to June 1997 to find the last time we saw a streak like that!
- Incredibly, this has happened only 8 other times since 1950 and stocks were higher a year later every single time.
Since this streak ended on July 2, 2021, indeed the S&P 500 has traveled roughly 3.5% higher. September 2nd will mark the signal’s 2-month anniversary. Looking at the 3-month average return (in the table above) after such a signal, the market is higher by 3.9%, suggesting much of the gains may have been pulled forward in the first 2 months since the signal. What this might also suggest is that this bull market is stronger than the average bull market, and has consistently delivered above average returns across many studies. Be open to a wide range of possibilities near-term, but align your trading/investing regiment with the longer-term probabilities outlined, as a discipline.
Research Report Excerpt #4
While large-cap and growth are indeed the heavy weightings of the S&P 500, they do not populate the majority of the market. In fact, they are an ever-shrinking part of the market for a goodly period of time.
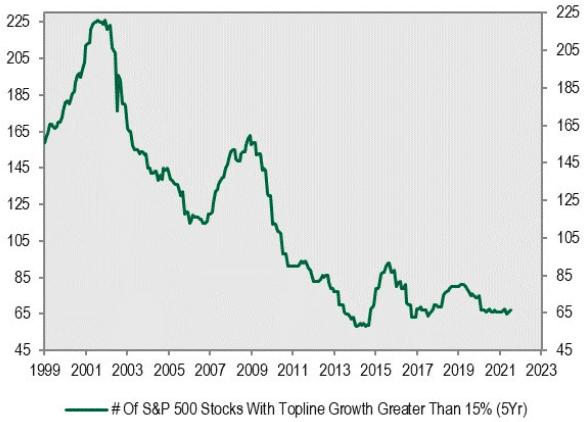
- Why are growth stocks so expensive today? One reason is that there aren’t many of them!!
- During the Dotcom period, nearly 1/2 the market could have been classified as growth stocks, compared to a meager 67 today.
- This is a small portion of the S&P 500 and/or NYSE
Research Report Excerpt #5
As I mentioned earlier, market breadth proves in-actionable for the majority of market participants, and far easier to take advantage of when it weakens. It’s even more actionable when it weakens, alongside price and rapidly. This market moves quite fast, both to the downside and to the upside. Hence, we can rationalize buy-the-dip opportunities when they appear and within the context of a rapidly moving cyclical bull. We discussed this very subject in our weekly State of the Market, and using the following breadth indicator:
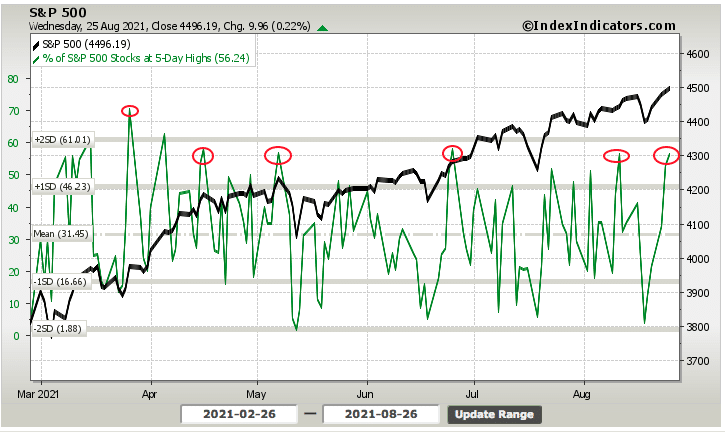
- Be patient, history suggests there is little reason to chase the market, this deep into the cyclical bull market rally, which has traveled 100% from the March 2020 lows.
- Our “patience” indictor falls in line with the 5-day win streak analysis above.
- The % of stocks trading at 5-day highs is at 56%. This is usually at a threshold that suggests near-term downside pressure on the market/stocks. After such a win streak, weakness and/or profit taking is to be expected, not to be feared.
The date on the chart was as of Thursday morning, or Wednesday’s closing reading of the % of stocks in the S&P 500 trading at their 5-day highs. At such levels, we usually see an interim top/pause. Low and behold, Thursday the S&P 500 fell more than a half percent that day. The decline came with expanded volatility.
Research Report Excerpt #6
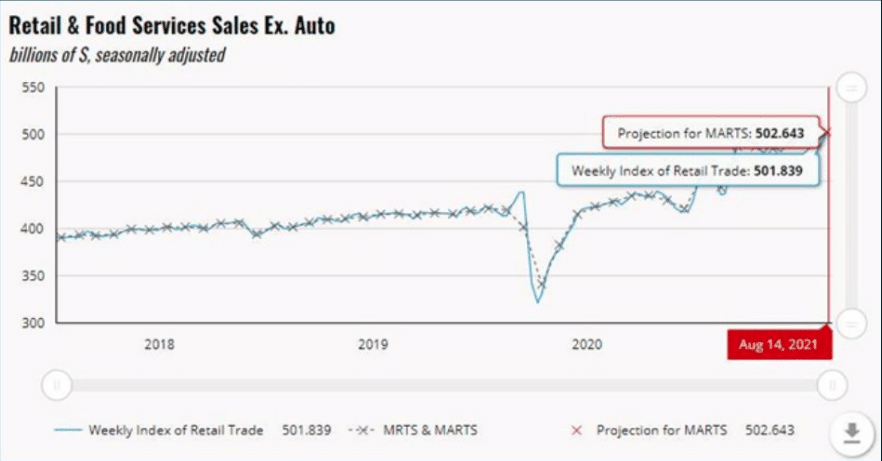
While the University of Michigan served to foreshadow the blame Delta-COVID game that has become synonymous with weakened consumer sentiment and retail sales, the high frequency data analysis above speaks to the contrary. Additionally, while many economists and market participants opine and concern themselves with the UofM consumer sentiment data, it might be worth highlighting that the Chicago Fed has an early forecast on August retail sales, based on actual high-frequency data, of +2.4% MoM. That’s strong and undercuts the UofM survey concerns held by the financial media and market pundits. In the second week of August, the Weekly Index of Retail Trade increased 1.0% on a seasonally adjusted basis after increasing 0.7% in the previous week. This is in keeping with the Johnson’s Red Book retail sales.
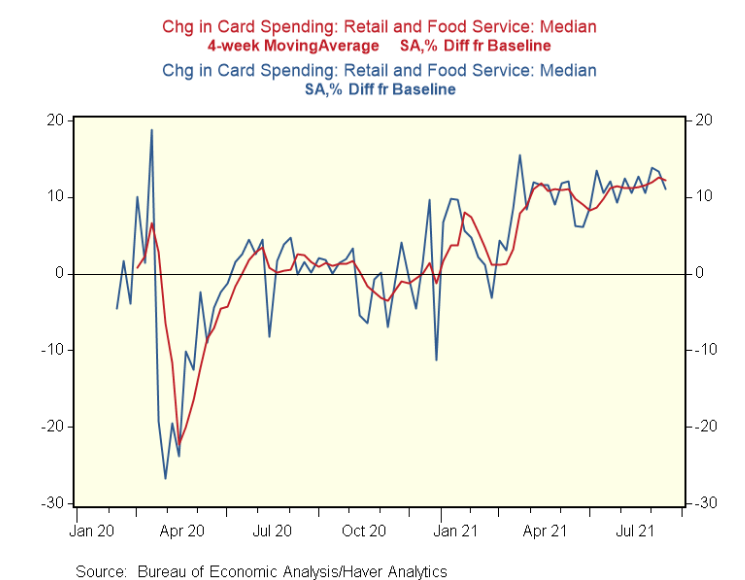
Moreover, according to the Bureau of Economics, the latest data on payment card transactions identifies that consumption remains solid. In the week ending August 17, card spending is up 11% against a typical level of spending during this time of year and before the pandemic. (chart below)
Research Report Excerpt #7
Housing is another key component to overall economic activity. As I’ve said many a time before, “When we buy a home, we tend to buy more crap to go into that home.” At least today’s consumer is doing so in a more responsible manner, as characterized by the level and trend in the Household Financial Obligations as a Percent of Disposable Income chart below:
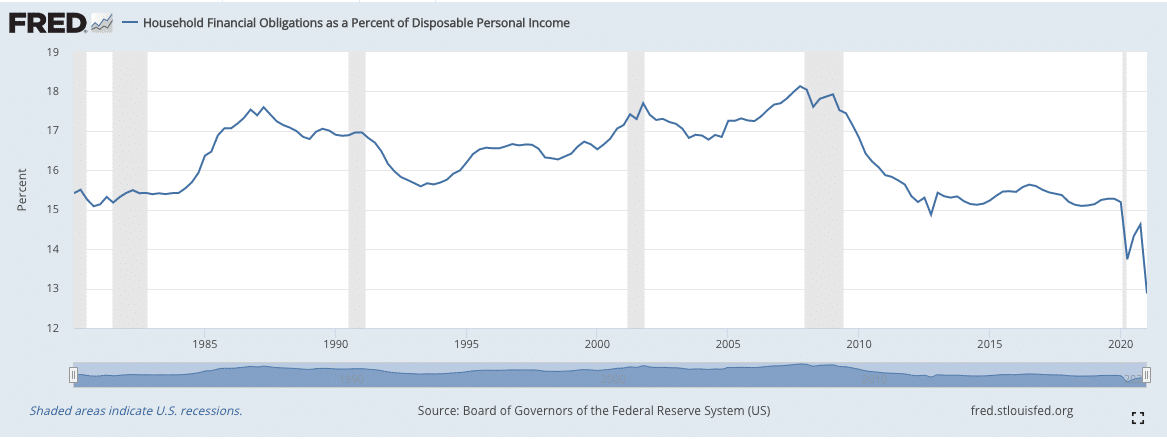
In other words, this economic metric informs that the disposable or discretionary income to spend has been increasing when compared to debt burdens. The average household in the U.S. has deleveraged their balance sheet since the Great Financial Crisis.
Research Report Excerpt #8
The below table shows YoY quarterly earnings growth peaking at 94.7% (as of the prior week) for Q2 for companies in the S&P 500 Index. As the quarters roll into 2022, the YoY comparisons become more difficult, in part due to elevated corporate earnings now due to higher demand, i.e., satisfying pent-up demand. Importantly, as the back half of 2022 earnings growth expectations show, double digit earnings growth is expected to resume. For the calendar years, 2021, 2022 and 2023 earnings are expected to equal, $201, $220 and $236, respectively. These estimates are prone to further upside revisions.
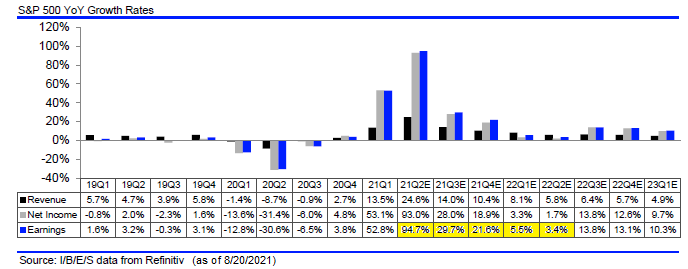
Coming out of a recession like we just experienced, a spike in earnings growth, then a slowing to a more reasonable rate of growth, is a mostly normal pattern as seen below. During this period of slowing, and as the economy continues to grow, historically, the equity market has continued to trend higher, all else being equal. The slower earnings growth is just one component the market considers in the interim. We would not expect the market trend higher to be without its normal and to-be-expected fits and starts.
Research Report Excerpt #9
There is far too much nonsense out there in the financial and social media that isolates and misinforms the average investor who isn’t resourced. One example of misinformation you’ve probable heard before goes something like this: (Bespoke Investment Group chart below)
“I don’t buy this rally, there’s no volume to it!”
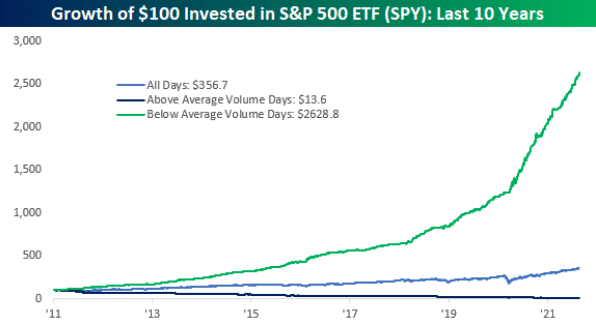
- Markets rise on low volume, fall on high volume. Why? Because investors get bullish at varying rates, because buying is and should be a process while panic selling occurs all at once due to emotions/fear!


