
Did we tell ya or did we tell ya? With bond yields rising as sharply as they have since the Fed rate hike and as much as they did on Wednesday, it would prove an impossibility for perma bears, market pundits, analysts with a negative view of the market and/or economy and the media to not promote the negative consequences of higher rates. Fear drives eyes, ears and finger clicks so that is what finds airtime when yields rise and equities fall sharply, as they did on Thursday.
The Dow Jones Industrial Average dropped 200.91 points to 26,627.48. The 30-stock index dropped 356 points at its lows of the day and posted its worst decline since Aug. 10. The S&P 500 declined 0.8% to 2,901.61, notching its worst day since June 25. The Nasdaq Composite dropped 1.8%, its biggest daily drop since June 25, 2018.
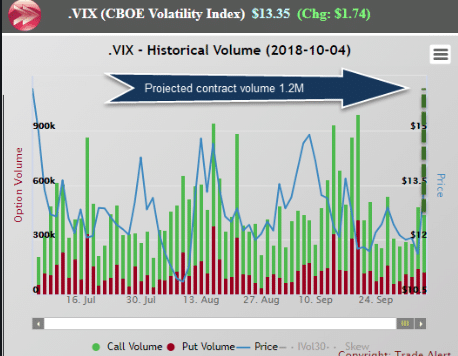
As an indication of fear in the markets yesterday, the VIX rose sharply, above 15 at one point intraday. Option volume surged to the highest level since June! Half million contracts in first two hours, calls led puts by a ratio of 5:2, as indicated in the screenshot below.
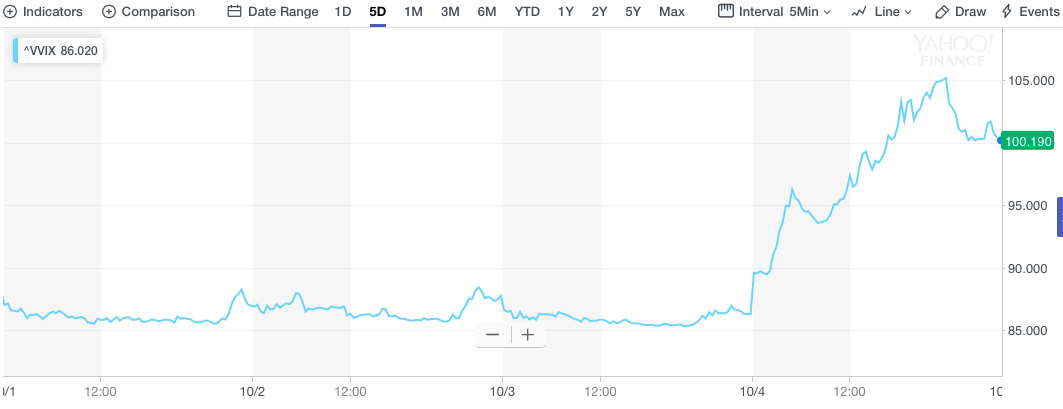
The outsized call options being purchased can also be viewed from the Volatility of Volatility Index, which tends to rise sharply from outsized purchasing of VIX call options. The screenshot of VVIX shows Thursday’s intraday jump above 105 (20%+ intraday rise) before settling just below 100.
It should have come as no surprise that volatility would rise significantly and temporarily once markets re-correlate. As it was in 2017 and in early 2018, the lack of fear and increased sector rotations produce great market dispersion. In previous articles, we’ve discussed dispersion and how it lends itself in favor of predicting a future spike in volatility when combined with other variables.
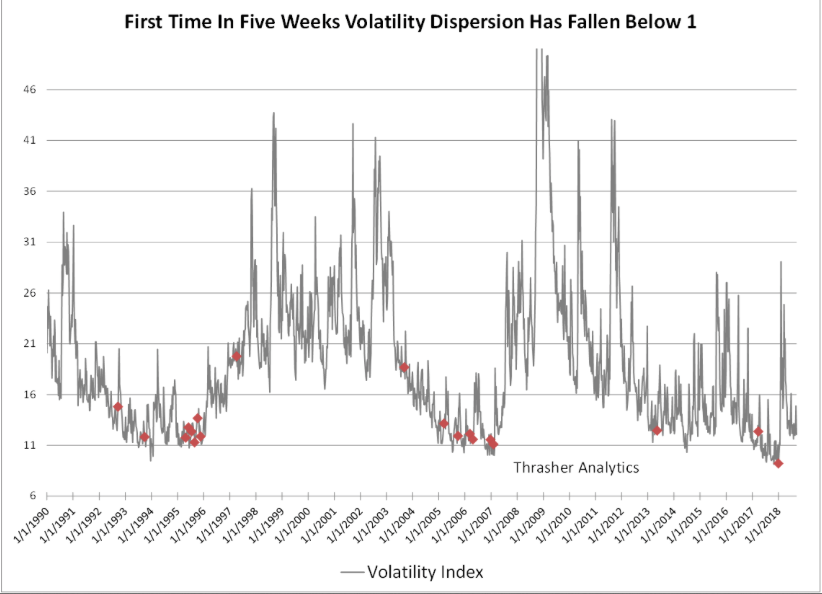
As shown in the VIX dispersion chart above, it is only a matter of time before a market catalyst drives fear and dispersion finds greater correlation. It is in part, why Finom Group has been discussing with subscribers our reduction in short-VOL holdings… in part.
Well, it’s now the first Friday of the new month. That can only mean its Nonfarm Payroll report day. But before we get to that let’s take a look at some previously released economic data. On Wednesday, the ADP report showed an outsized gain. Private-sector employment soared in September, as employers added 230,000 jobs, Automatic Data Processing Inc. reported Wednesday. This is the highest hiring rate since February. The gain was well above forecasts from economists polled by Econoday, who had expected on average an increase of 179,000. Bottom line, the ADP report was a huge, unexpected beat. And then there was…
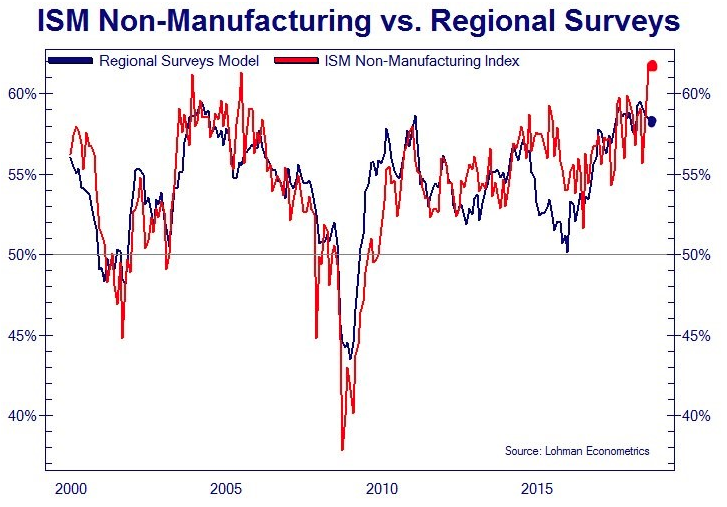
As previously reported, the ISM Index also showed an outsized beat and rise in September. The Institute for Supply Management’s survey of non-manufacturing firms climbed to a 21-year high of 61.6 last month from 58.5. The ISM report was a 5 standard deviation beat. As you can see in the chart below, it wasn’t consistent with the regional surveys model.
These 2 economic data beats (more like slaughtering of expectations) proved to raise the alarm bells, fearing the economy may be overheating and thus inflation should be ramping higher. This triggered a massive move in the treasury market on Wednesday. Using logic, if employment actually is the strongest since at least 1997 and the services economy is the strongest since 1998, the 10-year yield should increase sharply and it did. Having said that, if the 10-year yield is still increasing with the anticipation that the September Nonfarm Payroll jobs report will show high wage growth, a disappointment in hourly wage growth should cause a collapse in yields. We’ll find out soon enough of course.
“The level of the rates does not concern us,” said Steve Chiavarone, portfolio manager at Federated Investors. “That said, moving more than 10 basis points in two days is a different story. Pace matters and it bears watching.”
On Thursday, bond yields continued to rise as more labor market data forecasted the possibility of near term wage inflation. The number of Americans applying for unemployment benefits declined at the end of September and returned close to a 49-year low. Initial jobless claims dropped 8,000 to 207,000 in the seven days ended Sept. 29. Economists surveyed by MarketWatch had predicted a 213,000 reading.
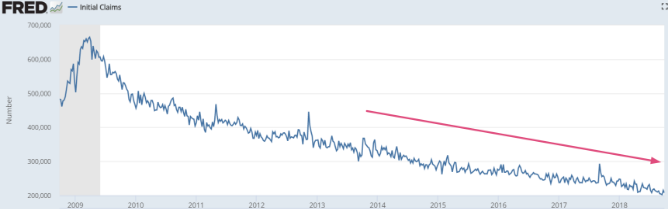
The labor market continues to improve in 2018 and with that wages have proven to rise at a moderate pace. Historically, record low jobless claims tighten the labor market and promote higher wages. From record low unemployment the economy shows great overall benefits in the way of consumer spending, retail sales and Gross Domestic Product growth. But with an expansion some 9 years long, and one of the longest historically, the natural inclination is to comb over and overly consider when inflation takes hold and how it will impact the economic expansion cycle. The fear of rising rates looms large even with the yield curve finally steepening once again.
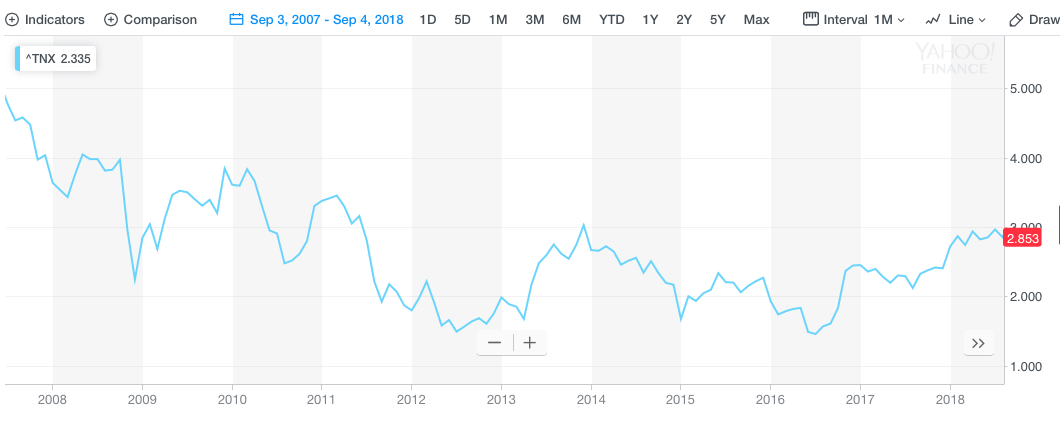
Here’s the reality with regards to rising rates. Rising rates are good when the economy is trending positively, but most importantly is where those rates and yields are rising from. The following chart of the 10-year yield (TNX) identifies that we have a long way to go before we even touch the previous expansionary cycle highs and when the 10-year was yielding greater than 5 percent.
Yes, as rates rise it puts a greater burden on household and corporate debt. But again, wages are rising alongside debt. We hear it all the time right? “Record debt levels, it’s a debt bubble that will eventually pop and take down the entire economy.” What we don’t hear is that debt is always rising. That is simply a function of our economic infrastructure, employment and how business gets done. Outside of a recession, debt is ALWAYS rising. But more important than the debt is the debt serviceability. It doesn’t matter if the debt level is $10 or $10trn if the debt can’t be serviced.
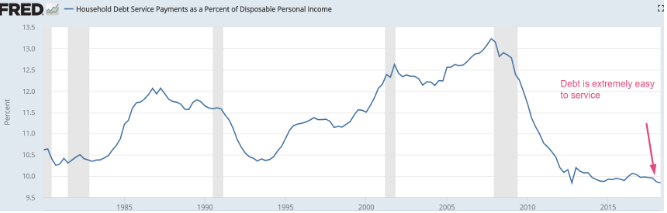
The chart above, from the St. Louis Fed shows that, in part, due to elongated periods of low interest rates, debt serviceability is extremely easy. Even with gradual rate hikes over the next couple of years, debt serviceability should not prove to impact the economy to any significant degree, as rates/yields would still not achieve prior expansion cycle levels and as wages continue to rise. Rising debt is not a problem as long as households can service their debt. Households have no problem servicing their debts right now even though debt levels and interest rates are rising. This is because disposable income is rising alongside debt. We always hear the ramifications of the negative feedback loop, but almost never herald the positive feedback loop.
Really quickly, as we round out this daily market dispatch. Nonfarm Payrolls data will be released prior to the market opens today. Expectations are for 185,000 jobs to have been created in the month of September, depending on what source is asked. August showed a 2.9 percent gain in wages, the biggest year-over-year rise since the recovery began in 2009. If the September number eclipses that, it could add to a belief that inflation is brewing and helping to stoke higher wage pressures. Current expectations for a 0.3% month gain would equate into 2.8% YOY growth. Investors and traders are waiting for the data, on pins and needles. Will the data prove to quell inflationary fears and bring about resumed equity buying activity? Or will the data prove inflationary and bring about an 8-13% market correction, as proposed by Hayes Martin, president of Market Extremes, an investment-consulting firm that focuses on major market turning points.
Martin believes the market is headed for a significant decline due to the divergences between the few large-cap stocks that are rising (and thereby propelling the market averages higher) and the vast majority of other stocks that are not. Divergences spell imminent trouble, he said in an interview, because that’s when the market averages are “giving the illusion of market strength” when, in fact, “the majority of stocks are under severe distribution.”
“The market is now highly vulnerable to a sharp pullback. The setup is now in place. And some news item will likely serve as the trigger.”
Martin draws attention in particular to weakness in the Financials sector, which historically has been a leading indicator of a market top. The Financial Select Sector SPDR, for example, is some 6% below its January high, even as the broad market is at new all-time highs. This is very reminiscent of what happened leading up to the 2007 bull market high. Having said that, the XLF was one of the few ETFs that finished positive on Thursday and during the broader market declines.


