
Thursday’s market activity was more troubling than what the daily chart assumes and when we broaden it out for the full year. While the October daily closing low proved, once again, to provide a floor for the S&P 500, these chart patterns tend to resolve unfavorably over the long run.
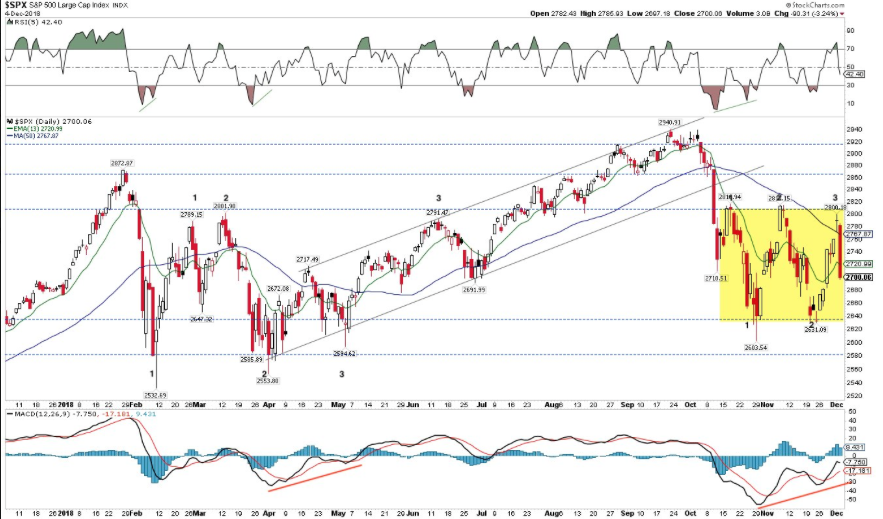
What we’ve seen since the October market correction is now what appears to be a triple bottom. Such technical expressions are rare and tend to result in further declines. Some technicians are of the opinion that the more times a recent bottom is found to be support, it tends to strengthen the probability of future upside momentum. Finom Group doesn’t subscribe to this rationale. It’s not that we believe there is a 100% probability for the market to make it’s way to the February low of 2,532 on the S&P 500, but the probability has increased above 50 percent in our view. We’d welcome the opportunity to be proven wrong in this regard. Nonetheless, Thursday did indeed find strong buying pressure after both the Dow and S&P 500 were down roughly 3% intraday.
Equities were found rebounding right around 11:30 and during a CNBC live interview with hedge fund manager Leon Cooperman. Cooperman discussed, among many things, the strength of the economy in juxtaposition with the market multiple proving relatively inexpensive. Moreover, Cooperman noted in the interview the struggles for the market that aligned with automated or computerized trading programs. He suggested that the new technologies driving trading activity should be investigated by the regulators, as the economy and corporate earnings simply don’t support what is going on in the market presently.
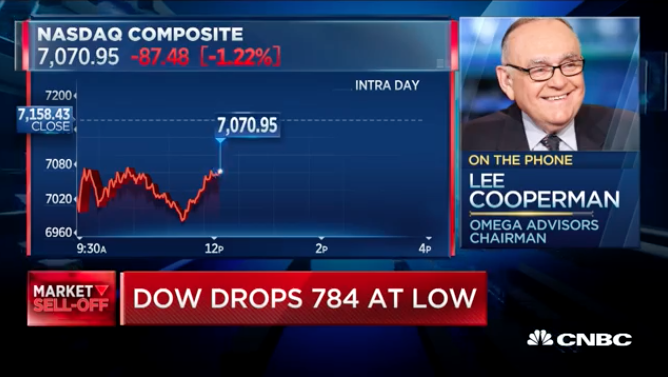
“I think your next guest ought to be somebody from the SEC to explain why they have sat back calmly, quietly, without saying anything and allowing these algorithmic, trend-following models to wreak havoc with what has, up to now, been the best capital market in the world.”
Finom Group agrees, largely, with the statements and characterizations of the market place by Cooperman, but the market doesn’t care. The market is now more automated than ever and found with more passive investing strategies than ever.
Automated trading strategies from quant hedge funds and the massive shift to passive investing have helped to remove liquidity from the system in times of panic, according to Marko Kolanovic, J.P. Morgan’s global head of macro quantitative and derivatives research. He said in a September note that index and quant funds made up two-thirds of assets under management globally and the majority of daily trading.
Given these dynamics, when investors begin to sell, as they did on Tuesday, the moves were probably amplified by computerized trading strategies. Selling intensified that day after the S&P 500 fell below its 200-day moving average, a key technical measure.
As we’ve mentioned in previous daily market dispatches, the market is struggling with the future outlook for the economy. It is doing so for a variety of reasons.
- Will the trade truce turn into a trade deal?
- How much will the economy slow in 2019
- How much will slowing economic growth curtail S&P 500 earnings?
- When will the USD strength subside?
- When will oil rebound along with bond yields?
This economic cycle is unlike that of previous expansion cycle in many ways, not just the duration. The current, uninterrupted economic expansion will be the longest in history come 2019. From a duration standpoint alone, it breeds concern. When we throw into the mix a late cycle stimulus, such as tax reform, this tends to distort the analytical abilities of economists to predict and forecast the coming years’ economic activity. Certain measures of the economy have certainly slowed. These measures are mostly aligned with interest rate-sensitive sectors of the economy such as the auto and housing sectors.
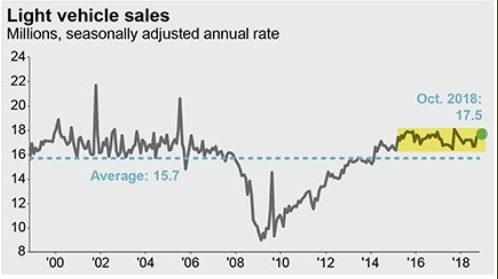
But even when we look at the chart of monthly auto sales over time, that sector of the economy isn’t necessarily weakening, it’s just not growing at this time. Autos have basically plateaued around 17-17.5mm monthly unit sales, above previous expansionary cycle levels. Housing on the other hand has been declining since January 2018, as it is a much more dedicated, pricey and long-term purchase decision. As interest rates rose through the bulk of 2018, housing demand weakened to a point where the monthly rate of supply exceeded 7 months. At the current pace of sales, it would take 7.1 months to exhaust available supply, a 6-year high.
Bond yields have fallen sharply during the month of November and that move lower has continued into December as the overcrowded short bond positions have moved to cover in light of a more dovish Fed. The 10-yr. Treasury yield, closely correlated to the mortgage market, has dipped from a peak of 3.24% in September to under 2.9% presently. The lower 10-yr. Treasury yield corresponds to lower mortgage rates, which has also brought about 3 consecutive weeks of increased mortgage application activity. Total mortgage application volume rose 2% last week compared with the previous week, according to the Mortgage Bankers Association’s seasonally adjusted index. Volume was nearly 19% lower than the same week one year ago.
Mortgage applications to purchase a home rose just 1 percent for the week and were 0.2% higher than a year ago. Mortgage interest rates are still 89 basis points higher than a year ago and home prices are still gaining, making home buying ever more expensive. While the price gains are now shrinking, affordability is still at the lowest level in a decade and proving to be the biggest barrier to housing demand today; sales of both newly built and existing homes continue to suffer because of it.
Where we are presently in the equity and bond market represents nothing more than can be summed up by one key word, uncertainty. The market is uncertain about all the bullet-pointed questions above and uncertainty breeds contempt and selling. When we try to establish whether or not there is something systemically wrong with the market or the perceived economic conditions, something that would bring about a 2008-like scenario, we can look at the VIX or volatility market. How are investors pricing risk both near-term and into the medium-term. We’ll look at two measures of risk correlated to the S&P 500, which can determine how much or little investors are concerned about a potential systemic shock to the economy and stock market.
The first index we will look at is the SKEW Index. The Cboe SKEW Index (“SKEW”) is an index derived from the price of S&P 500 tail risk. Similar to VIX®, the price of S&P 500 tail risk is calculated from the prices of S&P 500 out-of-the-money options. SKEW typically ranges from 100 to 150.

Presently, SKEW is reading 116, which is extremely low and even more so when juxtaposed to a market that is within a 10%, ongoing correction since October. This basically tells us that investors do not believe, presently, that there is some underlying systemic risk in the economic and financial systems. Now, let’s look at what VIX Futures Term Structure is telling us about how investors are pricing risk and whether or not they see system risk ahead for the market.
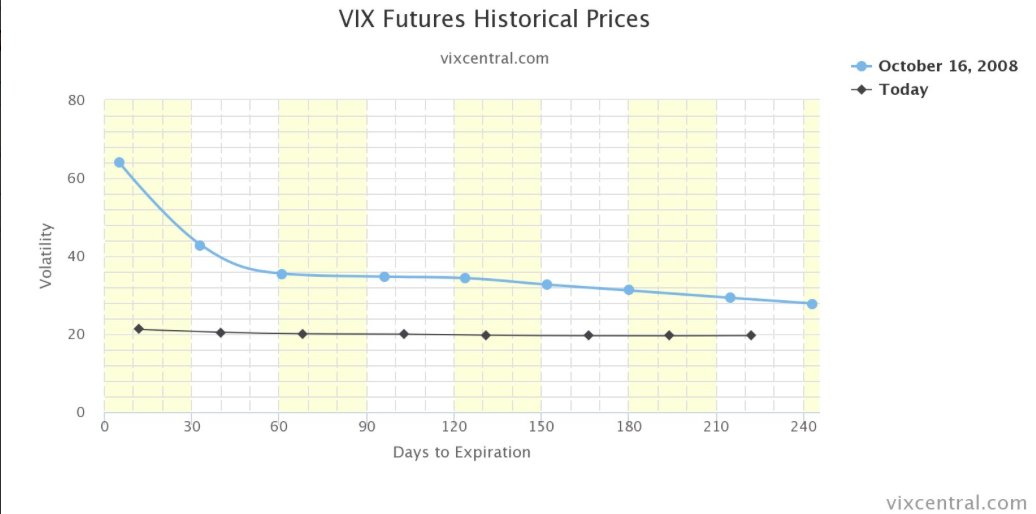
The chart above represents a comparison to when we last had a financial and economic shock that resulted in dire consequences for the stock market, which fell by some 50% in 2008. When we compare the VIX (the Y-axis) to that of today, we can see how elevated it was back in October 2008. When we look at VIX Futures contracts (the blue line along the X-axis) we an also see how elevated the price for VIX futures were compared to the present VIX Futures Term Structure (black line along the X-axis) Taken altogether, the SKEW Index and VIX Futures Term Structure, we come to recognize that investors simply do not believe that the current market correction that is still not exceeding the duration of the February-April 2018 correction, suggests a systemic economic or financial shock is being priced into the market.
So what does await investors, what can we expect? Nobody really knows what’s going to happen from one day to the next, which is largely why investing for the long-term tends to be a more comfortable way to do so. Short term forecasting can be a 50-50 bet. Most economists believe the economy is strong, but found with limited pockets of weakness. Few if any economists suggest a recession is to be found in 2019, even as most expect GDP growth to slow in the coming year. Having said that, even as headlines consistently denote a slowing economy, recent consumer spending data prove those headlines to be somewhat in error. We know this because of the reading on October retail sales, which jumped .8% and the latest reading on consumer spending that jumped 0.6%, according to the latest Personal Income and Expenditures data.
Additionally, there’s limited inflation in the economy, also proven in the last 3- month trajectory of core inflation. The latest reading on PCE expresses the rationale behind the Fed’s decision to revert to data dependency and possibly pause rate hikes after the December rate hike, which is largely expected to be implemented.
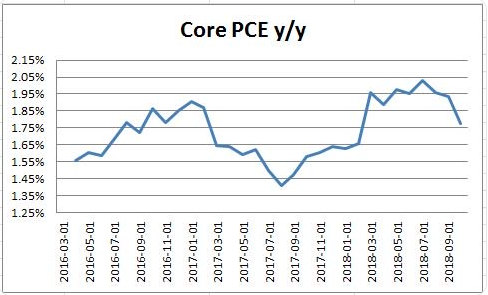
Simply put and as Finom Group has been suggesting since the early summer months is that there is no inflation. Even the notion of inflation is a ridiculous notion. A consumer-based economy simply doesn’t allow for it. The trend in PCE data has been deteriorating since peaking early in 2018, like the housing sector data. The most recent MoM decline in core PCE & the deceleration has become quite pronounced in October. The 3-month annualized change now 1.2% vs. 1.5% in Sep, 1.7% in Aug, 2.1% in Jul, 2.1% in Jun & 2.2% in May.
Furthermore, as a measure of inflation, bond yields also validate that fears of inflation are nonsensical and simply dogma. The following chart denotes the history of the 10-yr. Treasury yield.
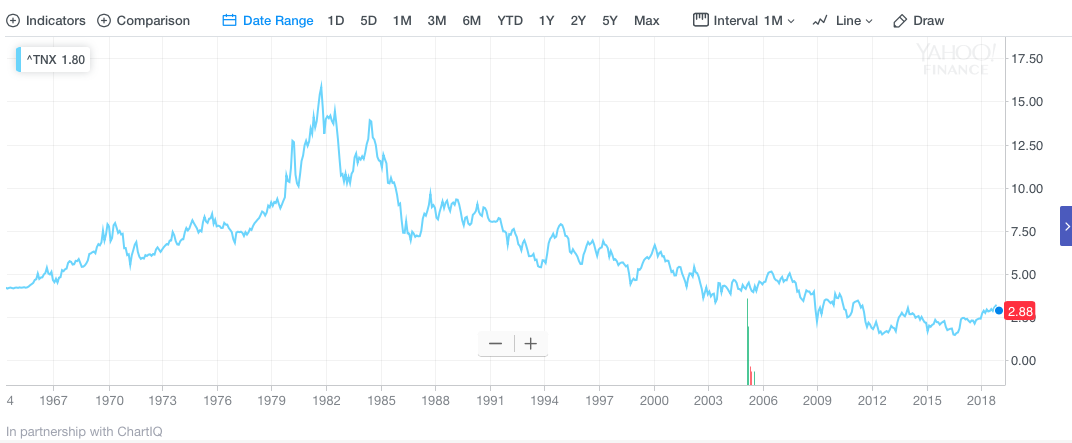 The United States is a consumer-centric and thus consumer dependent economic system that has developed credit and debt market structures on this principle. It simply does not allow for inflation and where there is even the hint of inflation, the consumer and innovation push back against it. Bond market investors like to suggest that a 30-year bear market in bonds is coming to end. Think about that statement, a 30-year bear market? Does that sound logical? There is no such thing as a bear market that last 30 years. That’s simply a “bond market” and how it functions long-term. Kind of like there is no such thing as a bull market in equity markets. Equity markets simply go higher long-term.


