
Hedging your long portfolio may be the best way to position oneself as global equities find more selling pressure following the steep declines on Wall Street from Tuesday. U.S. equity futures are pointing to another sharp decline as headlines broke overnight concerning the arrest of Huawie’s CFO. Canada has arrested Huawei’s global chief financial officer in Vancouver, where she is facing extradition to the United States, Canada’s Department of Justice said on Wednesday.

The arrest only adds to the U.S./China trade uncertainties that came about shortly after the trade truce was announced over the weekend. Piling onto the concerns over trade are headlines out of OPEC that hint a potential agreed upon oil production cut is not as easy as the market had previously speculated. Oil prices snapped lower Thursday morning after Saudi Arabia’s energy minister said that a cut of 1 million barrels per day would be enough for OPEC and its allied oil producers. Oil market watchers were expecting a supply cut of around 1.2 million to 1.4 million barrels per day. Saudi Arabia says it is comfortable with the current oil price but confirmed that there had been no decision on an output cut yet. OPEC is thought to be waiting on Russia before deciding the exact level of production cuts. Five unnamed delegates told Reuters ahead of the meeting that the group’s preferred level of supply cuts would effectively be conditional on Moscow’s contribution.
U.S. economic fundamentals seemingly remain in tact and expressing moderate growth, but the stock market is certainly not finding comfort in the future of economic data. With the potential for tariff escalations near term removed and a more dovish Fed that is likely to pause interest rate hikes after the December rate hike, investors haven’t found any semblance of solace in the removal of these headwinds. Given the persistent bearish sentiment and activity in the marketplace investors are forced to dig deeper into the market activity to find answers. Keep in mind, that earnings growth, but most analysts and economists, are still expected to grow through 2019, but the price-to-earnings (PE) ratio is what is coming under pressure. In other words, the risk/reward equation is front of mind, resulting in a compressed PE.
What we’ve seen in the market of late are sharp sell-offs and quick rebounds. The sell-offs are finding higher lows; this is a positive. Unfortunately, the rebounds are finding lower highs with respect to the correction underway. According to Mott Capital Management’s Michael Kramer, RSI and oversold activity point to a market rebound.
“I think we probably see a rebound before the end of the week and continue on our uptrend higher, which we so nicely established since November 23.
The chart below shows that the RSI is trending higher even with the steep decline yesterday. It continues to suggest to me the S&P 500 continues to move higher. “
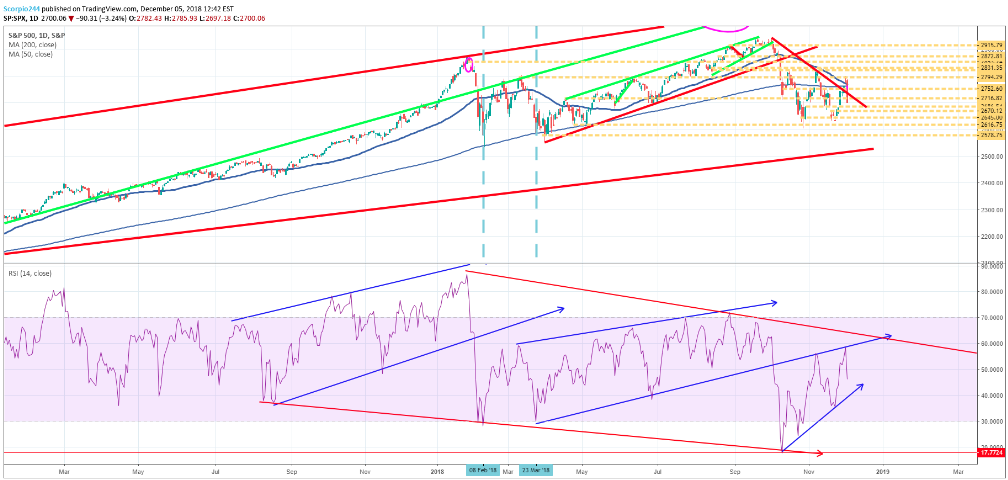
At present, it doesn’t seem as though a rebound is in the cards on Thursday, given the current state of equity futures, but it’s a long day ahead. What Kramer may be avoiding in his technical analysis is the lower highs being achieved by the S&P 500, which denotes a bearish flag. Having said that, the October lows held firmly during the November retest of those lows. The current market swoon that finds December off 3.2%, the 2nd worst December decline in the past 25 years, is now forcing a retest of those October lows once again. The worst start to a December month was -8.9% on Dec 1, 2008.
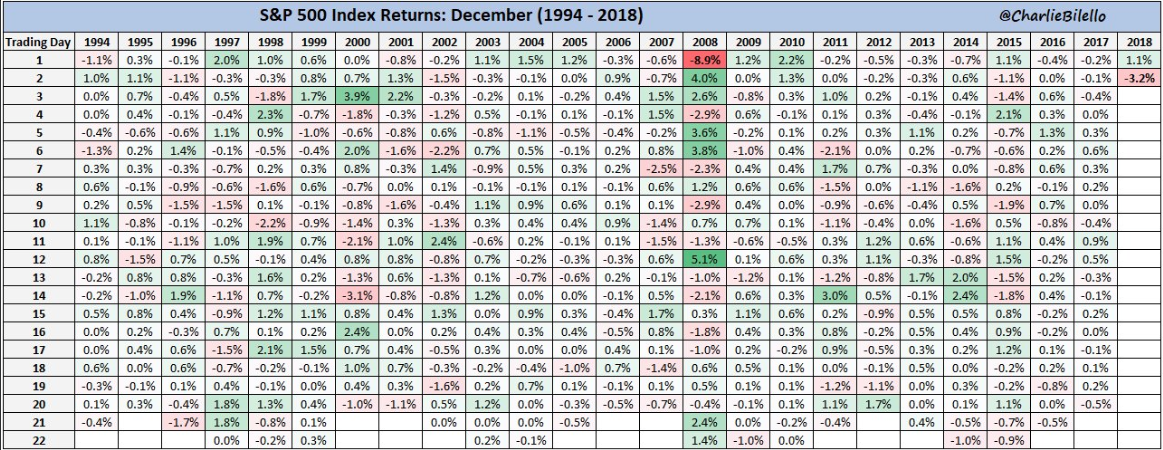
The line in the sand for the S&P 500 appears to be the November intraday low of 2,631. If it breaches this level and closes below this level, the market could exacerbate its declines and begin its search for the February 2018 lows. Here’s one statistic that bulls can possibly find as a silver lining in the sea of red that is the current market sentiment: “In the last 75 years, the only December close below the $SPX November low was in 1969″, @RoryHandyside (November 2018 LOW SPX VALUE = 2,631.09 [Nov 20]).
For the bulls who still find themselves in the grips of a market correction, the ceiling is pretty well defined.
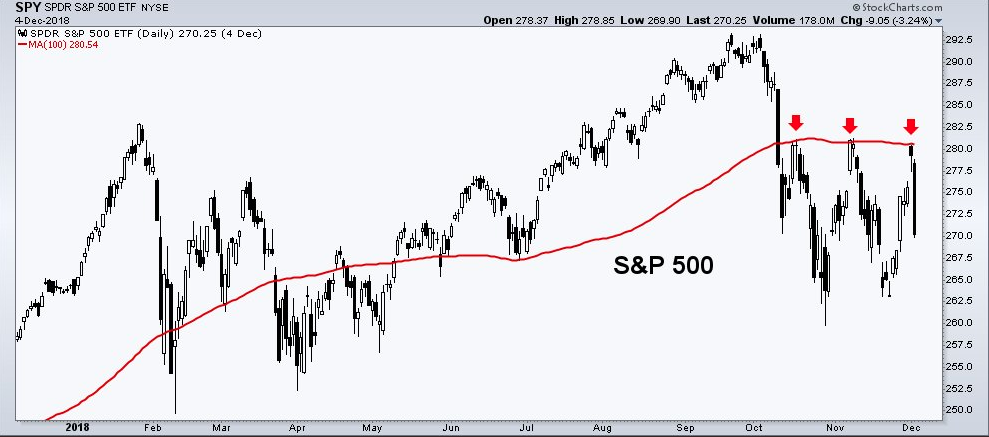
After proving a ceiling to 3 counter-trends higher, the 100-day moving average has solidified its role as resistance. We now know the level traders will be eyeing going forward and what has to be breached on the upside.
As we mentioned previously, the economic fundamentals remain strong, but the future outlook is being questioned as 2019 is expected to show slowing economic growth and earnings. With that in mind, both Wells Fargo and Bank of America Merrill Lynch have offered their 2019 outlooks. We’ll firstly offer the outlook from Wells Fargo as follows:

- Global equity strategists Audrey Kaplan and Scott Wren wrote that the broad S&P 500 index should climb to a range between 2,860 and 2,960 by the end of next year despite greater volatility across riskier securities.
- We believe that investors should not fear the changing trend, so long as low inflation and solid earnings-per-share growth continue,” he added. “To this point, even if EPS rises more slowly late in the cycle, it can still reach higher levels that, in turn, drive higher equity prices.
- Wells Fargo’s economic team predicting gross domestic product to grow 2.7% in 2019. Darrell Cronk, the institute’s president, also warned of the end of outsized job gains as the economy enters its final stages.
- The Wells Fargo strategists recommended investors consider health care and financial stocks, and argued that those sectors look relatively cheap. They also favor consumer discretionary and industrials equities.
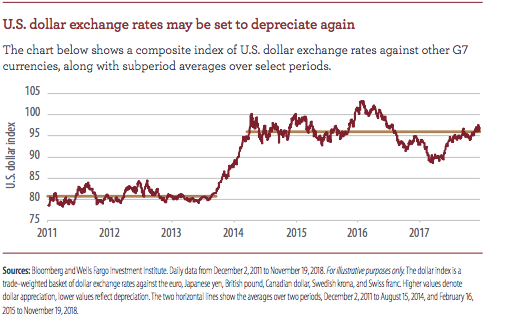
- Despite risks from trade and political tensions, strategists believe that an environment of global growth will support emerging market currencies and bring about a weakening of the U.S. Dollar.
Bank of America Merrill Lynch’s 2019 outlook doesn’t differ all that much from that of Wells Fargo. Both expect slowing growth, but growth nonetheless.
- Global profit growth declines: Earnings growth is expected to decline sharply next year, from >15% to <5% on a year-over-year basis. The BofA Merrill Lynch Research team is bearish stocks, bonds, and the U.S. dollar; bullish cash and commodities; and long on volatility. We expect to turn tactically risk-on in late spring, but to start 2019 with a bearish asset allocation of 50 percent stocks, 25% bonds and 25% cash.
- S&P 500 Index peaks: Earnings growth also is likely to slow in the U.S., though the near-term outlook remains somewhat positive. The Standard and Poor’s 500 Index is expected to peak at or slightly above 3,000 before settling in at a year-end target of 2,900. We forecast earnings per share (EPS) growth of 5 percent, which would put the S&P 500 EPS at a record high of $170 next year. Our U.S. equity strategists are overweight health care, technology, utilities, financials and industrials, and underweight consumer discretionary, communication services and real estate.
- Real U.S. GDP growth of 2.7% is forecast for 2019, slowing in the second half of the year as the effects of fiscal stimulus begin to fade. The unemployment rate could reach a 65-year low of 3.2 percent by year-end, pushing wage growth of 3.5%in aggregate. Consequently, core price inflation should gradually rise to 2.2% through 2019 and hold as rates continue to rise. The housing market is no longer a tailwind for the U.S. economy: we believe housing sales have peaked and home price appreciation is forecast to slow.
Undoubtedly, the tone from both financial institutions is subdued when compared to the start of 2018. Nonetheless, both firms see markets higher and potentially finding new highs for the S&P 500 in 2019 and before possibly coming under pressure once again.
As a reminder, investors will benefit more from maintaining a long-term perspective than focusing on the day-to-day moves, which can be volatile and nerve wracking. The battle is certainly wagering forward with a more technically driven market swoon than one that is fundamental in nature. The debate is warranted as to whether this is truly technical or fundamental in nature, but many factual market anomalies are raising concern that do indeed point to the technicals. CNBC’s Jim Cramer highlights the rise of mechanical/technical trading that resulted in the Tuesday market route.
Cramer stated the culprits for Tuesday’s route: Complex algorithmic programs set up by professional money managers to sell when the odds of future market losses increase. In other words, when an event that often precedes a recession occurs, in Tuesday’s case, short-term interest rates trading above long-term rates in a so-called yield curve inversion, some trading algorithms will automatically begin selling securities because the chances of an economic slowdown just got higher.
“Historically, this situation has produced negative results for the bank stocks and these hedge funds are trying to get out ahead of others who fear those negative results, but just don’t know they’re going to fear them. It’s a footrace.
This curve, as they call it, overrides whatever you hear about good employment or consumer balance sheets or robust lending. It’s predictive.
Worse, the charts are signaling more pain ahead; many hedge funds likely sold the S&P 500 when it dipped below its 200-day moving average because, in the past, that move tended to bring more downside.
Here’s the problem: There are now so many hedge funds using the same algorithm, same programs [that] there simply aren’t enough investors willing to take the other side of the trade. If we all know that stocks go down on certain triggers, then who the heck would want to buy stocks?”
The rise of the machines is real and more prevalent in the market today than ever before. Algorithms are programmed to react to levels, key words in headlines and the prevailing economic data metrics. To further this point, recent reporting from Nomura’s Charlie McElligott concerning the risk parity trade and CTA’s has proven prescient. The much faster CTAs, or managed futures funds, which do nothing but chase market momentum once it has been established have dominated market activity lately. Nomura’s CTA Trend model “is again deleveraging massive notional in long US Equities expressions across SPX, RTY and NDX live.”
“This is more about performance and year-end timing than the curve inversion / “growth scare” story…but that certainly is not helping the sentiment here either, as stops are being triggered across fundamental and rules-based strats.”
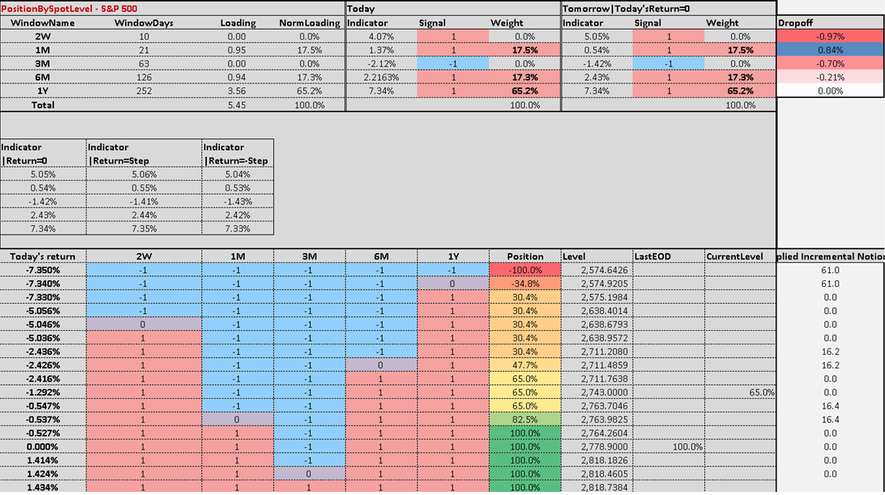
Here’s exactly what happened on Tuesday that produced more than 3% drops in the major averages. McElligott identifies the specific deleveraging “trigger” behind the S&P waterfall liquidation, which was due to a massive CTA selling order, which was unleashed once deleveraging stops were hit in the S&P. f the SPX model was triggered to sell down at 2,763 – the S&P’s 200DMA – with $32.8B notional for sale, reducing CTAs from “+100% Max Long” down to “+65% Long.”
The following table denotes the trigger points for these “sell programs”.
Everyone has a theory for why the market is dropping or remains in its current state of correction. From Brexit to tariffs and everything in between, the key takeaway is that sentiment has been increasingly bearish given the numerous macro and geopolitical uncertainties. The focus for the remainder of the trading week will likely center on key technical market levels and economic data. Today’s release of the ADP payroll report will lend itself to predictions for Friday’s Nonfarm payroll report.

As depicted in the table above from MarketWatch, labor and payroll data is expected to have grown in the month of November, with the economy expected to have created nearly 200,000 jobs. Wages are expected to tick higher MoM and YoY.
The 4th quarter’s market performance has put plenty of “meat on the bone” for both bears and bulls to appreciate, hence the extended period of market corrective behavior. Recall from the February 2018 start of the market correction that lasted until April, bulls and bears had much the same debate, claims and considerations as they do during the present correction. What’s really changed in the fundamentals may be aligned with interest rates, as they have decisively had an impact on the housing market. And for that reason both the bears and bulls suggest the Fed is to blame and remedy with future actions. To that point, who wants to pick a fight with the Fed?


