Welcome to our Finom Group January 2026 Monthly Macro-Market Recap
January 2026 MONTHLY MACRO-MARKET QUANT RECAP
This recap provides a comprehensive synthesis of recent market analysis, focusing on the performance and validity of key quantitative signals monitored over the past several months and outlining the strategic outlook for 2026. The analysis reveals a high success rate for bullish quantitative indicators throughout 2025, which correctly forecasted positive market returns and the absence of a recession despite deteriorating breadth and pessimistic sentiment. The powerful Zweig Breadth Thrust signal from April 2025, in particular, has proven exceptionally reliable, with its forecast for positive 6- and 12-month returns and no recession holding true.
Looking ahead to 2026, the primary theme is the challenging nature of a Midterm-election year, which historically features higher volatility and an average market correction of -17%. Quantitative data suggests potential for weakness in the first half of the year, followed by a historically strong buying opportunity in the fourth quarter. The “January Pattern” quant indicates a higher probability of a negative return in January 2026, breaking a three-year positive streak… OR NOT 😉 ✅
Despite these headwinds, the fundamental backdrop remains supportive. Corporate earnings growth is the primary driver of market returns, and estimates for 2026 project robust, double-digit growth. Analysis of investor sentiment and volatility using contrarian indicators from The Leuthold Group suggests that periods of high fear and uncertainty, which may characterize early 2026, historically precede periods of superior market returns. Sector-specific analysis highlights the successful rotation into Healthcare (XLV) in 2025 and points to a similar deep-value opportunity in Consumer Staples (XLP) for 2026.
The recommended strategic posture is one of cautious optimism, emphasizing disciplined, data-driven processes over subjective predictions. Maintaining a defensive allocation with sufficient cash reserves in early 2026 appears prudent to capitalize on the dip-buying opportunities that are historically presented during Midterm-election years.
Here is the quantitative recap regarding our best works and quants to watch, drafted from our proprietary research reports during the December and January period.
The Finom Group Quantitative Recap: Turning Data Into Discipline
Welcome back, folks. If you are new to Finom Group, you need to understand one thing immediately: We don’t rely on crystal balls, and we certainly don’t rely on the “doom and gloom” narratives peddled by the financial media to fill airtime. We rely on process. We rely on black-and-white data.
As we navigated the final stretch of 2025 and kicked open the door to 2026, the weight of the evidence—our quantitative framework—continued to separate the savvy investors from the herd. While the pundits were calling for a recession that never came (again), we were busy analyzing the scheduled fund flows that drive price.
Here is a recap of the “best works” and critical quants we disseminated in December and January that you need to be watching.
1. The Hall of Fame: TOY Barometer & Zweig Breadth Thrust
Let’s start with what I consider the “Hall of Fame” of quantitative studies. In our January 18, 2026 report, we reiterated the power of the Zweig Breadth Thrust (ZBT) and the Turn of Year (TOY) Barometer.
Regarding the ZBT triggered in April 2025:
“When a Zweig Breadth Thrust is triggered as it was on April 24, 2025, the S&P 500 has never (18 occurrences) been lower 6 and 12-months forward. So far and since the last Zweig Breadth Thrust triggered, indeed the market was higher 6 months forward, and seems likely to carry the 12-months forward probability into April of 2026.”
But the real star of the New Year has been the TOY Barometer. This study, tracking the price trend from November 19th to January 19th, is the gold standard for forecasting the next 12 months.
“Given the latest quant period that covers the January 12th – January 19th period with a perfect track record (7-0), the data suggests investors consider the high probability that a Bullish TOY Barometer signals come January 19th. And with this signal, we will likely cement an upwardly revised 12-month forward S&P 500 price target.”
And what did we do with that data? We didn’t just sit on our hands.
“Given its positive history, reliability of a Bullish TOY Barometer and on behalf of Finom Group, I am now moved to upwardly revise and cement a 12-month forward S&P 500 price objective of 7,500.”
2. The January “Spoiler Alert” vs. The First Five Days
Coming into the year, in Market Mania #23, we issued a specific “spoiler alert” regarding a potential pattern shift.
“Coming into 2025, the quant informed of a high probability that January 2025 would deliver a positive return… What is evidenced in the quant is the pattern whereby the S&P 500 express 3 consecutive negative January return years followed by 3 consecutive positive January return years… January 2026 would set-up the first of 3 negative January return years.”,
However, savvy investors know that patterns exist to be broken by stronger signals. The First Five Days of January 2026 delivered a positive return, creating a bullish counter-narrative.
“When the First 5 Days deliver a positive return, nearly 84% of the time the full calendar year delivers a positive return. The average S&P 500 return is also a robust 14%.”
We also saw the “Grinch Reversal” play out perfectly:
“The S&P was up 16.4% in 2025. The S&P was down 1.25% in the last week of 2025… Over the last 50 years, there has been 9 previous occasions where a double digit year ended with a negative week… This definition… now has a 9 – 1 track record after the First Five Days proved a positive return in 2026.”
3. The “Baby-Whaley” and Nasdaq Breadth
In our December 7, 2025 report, we highlighted technical healing that many missed while worrying about volatility. We saw a breadth thrust that wasn’t quite a ZBT, but was just as effective—a “Baby-Whaley.”
“Investors panicked out of stocks, then rushed to get back in stocks. 50-day low, then >70% A/D stocks within 4 days. A baby-Whaley, but just as effective! Every time this happened in the past, the S&P 500 has risen over next 12 months, down only once 3-months later.”
We also tracked a massive surge in Nasdaq internal momentum:
“The % of NASDAQ stocks above their 10-day moving average surged from 20% to 75%+ within 10 days, a kind of breadth thrust. Historically, moves like this saw the NASDAQ higher 10 of 11 times 1 and 2 months forward, and higher every single time 3 months forward.”
4. Volatility as a Tell
While others were hedging, we were watching the intraday behavior of the VIX in late December. It told us everything we needed to know about institutional accumulation.
“VIX closed LOWER than its open value for 8 straight days and the VIX was < than 15, a sign of persistent intraday VOLATILITY selling and/or investor optimism. Since 1990, there were 15 occurrences of this type of action/activity. The S&P 500 was higher 93% of the time 3M later and 100% of the time 9 months and 12 months later.”
Furthermore, looking at the recent tightness in the S&P 500:
“Over the past 3 months, the S&P 500 has closed within an unusually tight 1% range. Historically, when the S&P 500 compresses like this for 3 consecutive months, it was almost always higher 2–4 months later.”
Bottom Line
You can listen to the noise, or you can listen to the data. The data has told us to stay long, to buy dips, and to respect the scheduled fund flows.
“It’s a very rare thing to achieve 4 consecutive years of double-digit S&P 500 returns, and without an endogenous/exogenous event, we are of the opinion Earnings, Inflation, and a friendly Fed all point in favor of such an outcome.”
Manage cash wisely, stick to the process, and let the probabilities work for you.
This recap synthesizes actionable insights and Finom Group’s ongoing analysis, connecting every price action and signal to our published research so readers can judge forecasts versus reality. Use it as both roadmap and checkpoint. Whether seasoned or new to these pages, let this guide clarify market truths, reset expectations, and keep your playbook sharp for the road ahead—because as history shows, markets reward those who adapt and are open to change, not those who flinch.
Direct quote from Finom Group’s “Perplexingly Positive Prognosis : 2026 Outlook″ Research Report (November 30th, 2025)
Zweig Breadth Thrust, which was triggered shortly after the technical bear market low in April. The data from this powerful thrust signal is detailed in the table below:

A Zweig Breadth is largely regarded as the grandfather of all breadth thrusts. It’s perfect track record for forecasting both forward S&P 500 price trend and the economic cycle lay waste to all manner of macro-market doubt, shy of exogeny/endogeny. As the table outlines, When a Zweig Breadth Thrust triggers as it did on April 24, 2025, the forward S&P 500 performance has delivered POSITIVE returns 6 and 12 months later every single time. Equally impressive and from an economic perspective, there has never been a recession within 12 months of a Zweig Breadth Thrust signal. While there was indeed a great deal of concern even coming off the April 8th lows this year, the ZBT helped inform investors/traders of the probabilities ahead. To-date, and more than 6-months since the signal, POSITIVE returns and NO recession. Given at least this quantitative track record, Finom Group has been encouraging investors/traders to take advantage of market pullbacks throughout the calendar year, and turn away from noisy and pessimistic economic headlines, as compelling as they may seem.
The signal from this ZBT will have run its course by April of 2026, offering still a positive outlook on the economy and the likelihood that the S&P 500 remains above its price from April 24, 2025, the signal date.
Direct quote from Finom Group’s “Perplexingly Positive Prognosis : 2026 Outlook″ Research Report (November 30th, 2025)
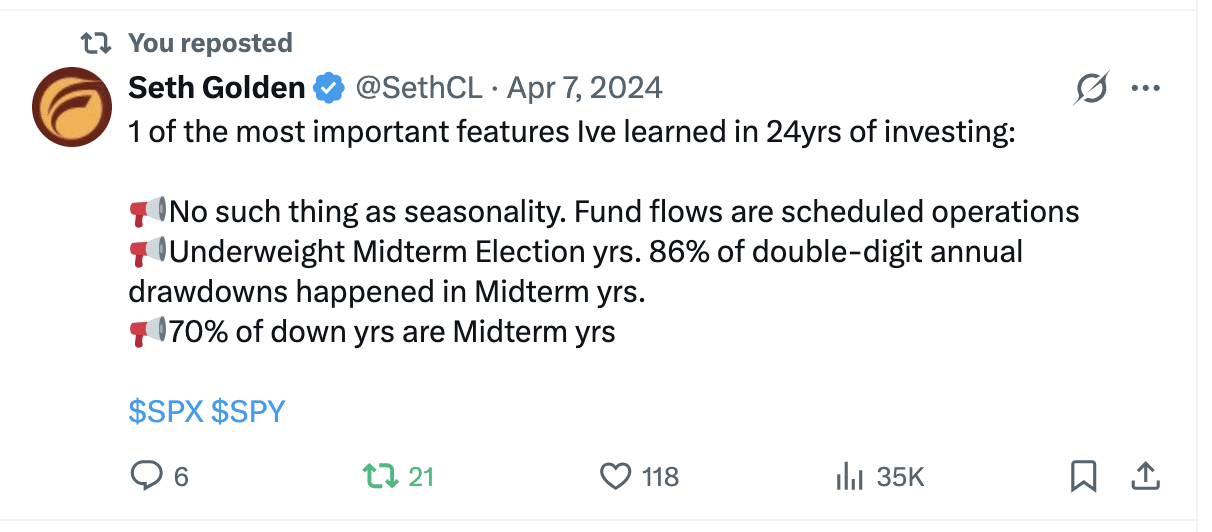
Tis The Season of Fund Flows
While many will refer to this type of data as “seasonal”, we urge investors to consider that fund flows are largely on a set schedule. When investors reduce this fact of fund flows, which creates repeated market price trends, down to a term like seasonality, it dampens an investors belief in repeatable price trends produced by scheduled fund flows. Hence, we don’t use such terminology in our disseminations (table from Carson Research). November through April is historically the best 6-month period to owns stocks in terms of average returns and percent positivity rate (last column).
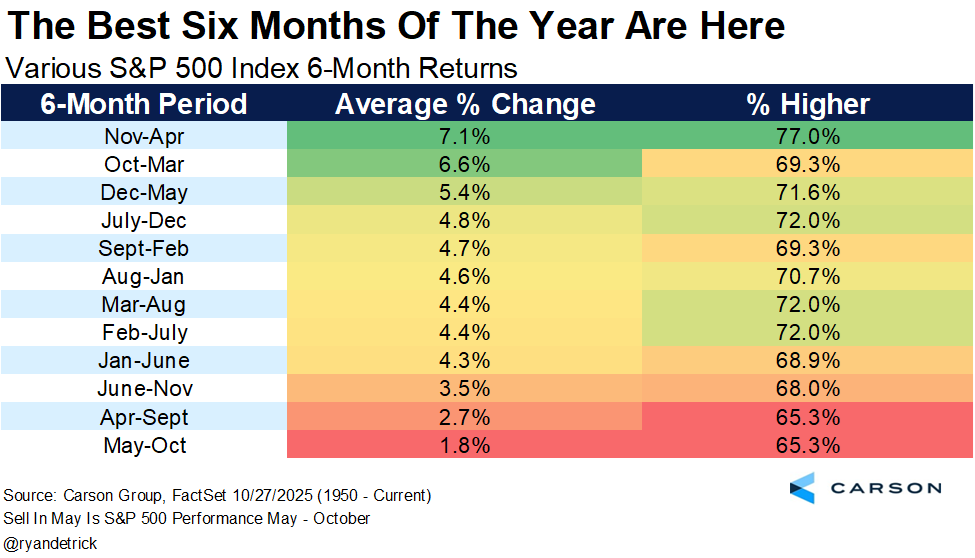
Recognition of the 6-month period helps investors to better plan and adjust existing market exposure and plan for future allocations. In other words, knowing the “seasonal” fund flow schedule helps investors to maintain appropriate expectations, make capital allocation decisions, and generally manage portfolio positions better! Within this analysis we can also suggest that the “Sell in May and Go Away” period of the year is accurate. The worst 6-month period to own stocks is May – October. It’s not a matter of negative returns during this period, but lesser positive returns and probabilities for returns. As such, let’s turn our attention to January of 2026 and as it pertains to scheduled fund flows.
If there is ever a New Year headwind it generally shows its greatest impact in Midterm-election years. In addition to this FY 2026 headwind, we have the potential for another government clashing in January of 2026, regarding funding the government. This past government shutdown was the longest in history, and if the negotiations prove short-lived in early 2026…who knows. We choose not to speculate on “what ifs”, but rather rely on the data. At Finom Group and within our Quant Webinar 2024, we outlined the following January quant pattern:
As an early “spoiler alert”  of sorts, the following quant is of great consideration in preparation for January 2026:

Coming into 2025, the quant informed of a high probability that January 2025 would deliver a positive return. After a brief but sizable consolidation, the S&P 500 managed a positive monthly return. What is evidenced in the quant is the pattern whereby the S&P 500 express 3 consecutive negative January return years followed by 3 consecutive positive January return years. If the pattern were to hold, since 2008, then the S&P 500 should have and did express a positive January return in 2025. With the pattern complete, unfortunately or fortunately depending on your positioning, January 2026 would set-up the first of 3 negative January return years. This is but one data point for but one month of the calendar year, but the consistency of the pattern is not to be dismissed, and we will of course have much more quant data to consider as 2025 comes to an end. For now, this is about 2026 portfolio preparedness!
For those of you who participated and/or achieved last year’s Quant Webinar and PDF file, you’re well aware of how effective this January quant proved to be. For those of you who have not achieved the Quant Webinar, please feel free to contact Finom Group Support to inquire ($99 for members). The Quant Webinar and PDF are one of the most relevant and practical guide to markets for investors, and we look forward to updating the Quant PDF in the future.

Direct quote from Finom Group’s “Perplexingly Positive Prognosis : 2026 Outlook″ Research Report (November 30th, 2025)
Moreover, we’ve often outlined that in the quantitative analysis business, “negative quants” (quants that lend to higher, negative outcomes) are the ones with the highest of failure rates, not positive quants. An example of negative outcome quants happened in a pretty big way within Q1 2025.

“Dubbed the ‘December Low Indicator,’ this market trend suggests the S&P 500 tends to deliver stronger returns when the large-cap index avoids closing below its December low in the first quarter of the new year.” “The past two years [U.S. stocks] didn’t break the December low and those were great years, while a break in early 2022 was one subtle clue that the odds were elevated that the rest of the year could be dicey,” he wrote in a note to clients. “Of course, breaking the December low doesn’t necessarily mean 2025 will be a down year, Ryan Detrick noted. ‘Still, this is one thing that undoubtedly is in my worry column.’”
It’s clear from the quant table that undercutting the December low S&P 500 price in Q1 of a New Year greatly diminishes the odds of a positive annual return… and yet here we are with a double-digit return year-to-date. Again, this is an example of a negative outcome quant that failed to deliver a negative outcome. Markets are engaged by humans to intrinsically trend higher over time, and so it is a greater probability that negative quant outcomes fail. Nonetheless, we would invite investors/traders to keep this quant handy to chronicle the December low price by year-end 2025 and use it to reference what price does in Q1 2026, especially given the January pattern previously outlined. Now let us turn our analysis toward the big picture schedule of fund flows also referred to as the 4-year Presidential Cycle, landing of course on a Midterm-election year or Year 2 in 2026.
Direct quote from Finom Group’s “Perplexingly Positive Prognosis : 2026 Outlook″ Research Report (November 30th, 2025)
Midterm Years Suck, Usually
It’s not always perfect, but it’s rarely difficult to know when to allocate capital, when to anticipate muted returns, and when to expect market volatility, downturns, and resurgences. If we consider the most recent 4-Year Presidential Cycle, it played out almost perfectly and according to the average 4-Year Presidential Cycle.
The following 2 charts, from the Trader’s Almanac, are the same yet different versions of the 4-Year Presidential Cycle.
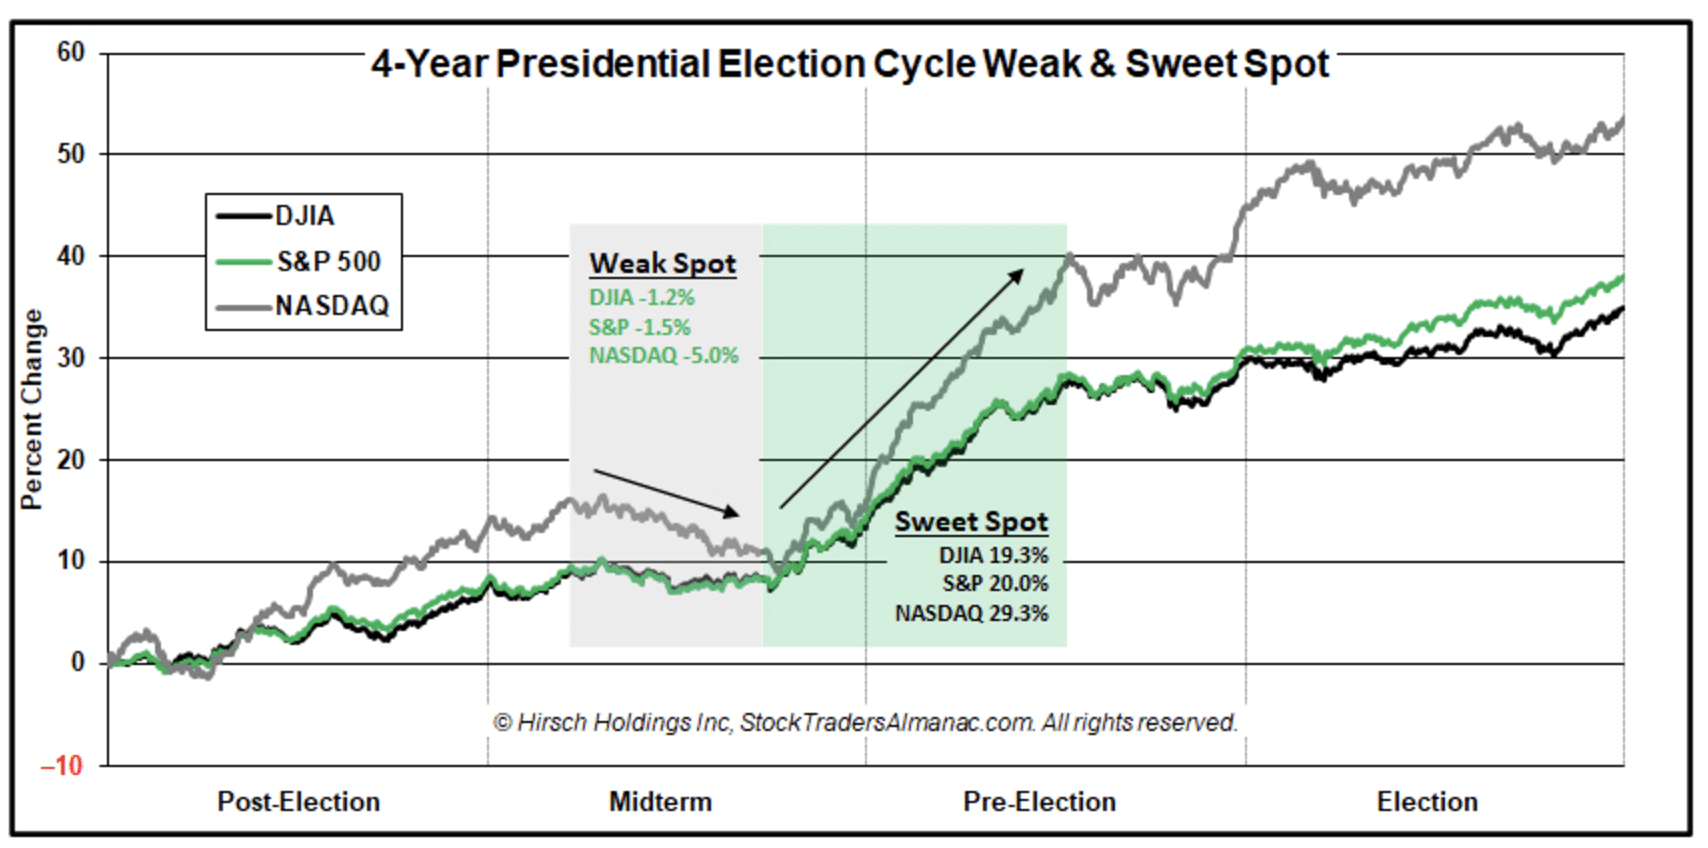

As the charts detail, in their individual ways:
- Year 1 of a Presidential cycle starts off rather slow, as did 2025. Q1 tends to have very muted returns, but the whole of Year 1 delivers a positive return on average.
- Year 2 is the Midterm election year. This is typically the most truculent of market years. Consider 2018 and 2022, both delivered bear market conditions (-20%+). The average correction during a Midterm election year is –17%, since 1928. I believe there is good opportunity in bad price action, and that is also what the charts outline. Did you know that if you bought (S&P 500) the 1st trading day of November during a Midterm election year, and held through April of the following year, you never had a negative return, EVER
 . The Sweet Spot (Q4 of Midterm-election year), as highlighted in green, in the chart above.
 - After Midterm years come Year 3 of the 4-year Presidential cycle, typically the best return year of the cycle. Naturally the best year comes after the worst year. It all fits together nicely doesn’t it? Fun fact: The S&P 500 has not delivered a negative return in Year 3 since 1931 (including dividend).
- Year 4 or the Election year also tends to deliver positive returns for investors, but the Nasdaq tends to deliver the lesser of the 3 Large-cap indices in the Q4 period of the Election year. Something to think about, while also recognizing the average return in Year 1, Q1 is also negative. Keep in mind large-cap Growth/Tech has been underperforming for the last couple of weeks, but I am still anticipating at least one last surge from the Mag-7 and Large-cap Growth cohort before year-end and to establish another all-time high for the Nasdaq and Nasdaq 100.
Based on the cyclical nature of the markets which encapsulates the 4-year Presidential cycle, we think it wise to consider game-planning for some muted Q1 2026 equity market returns or at least maintain low expectations for the market to jump over those low expectations. Additionally, and as evidenced in the data above, here is a look at the November Mid-term Election to April of the following year “buy period” (The Leuthold Group):
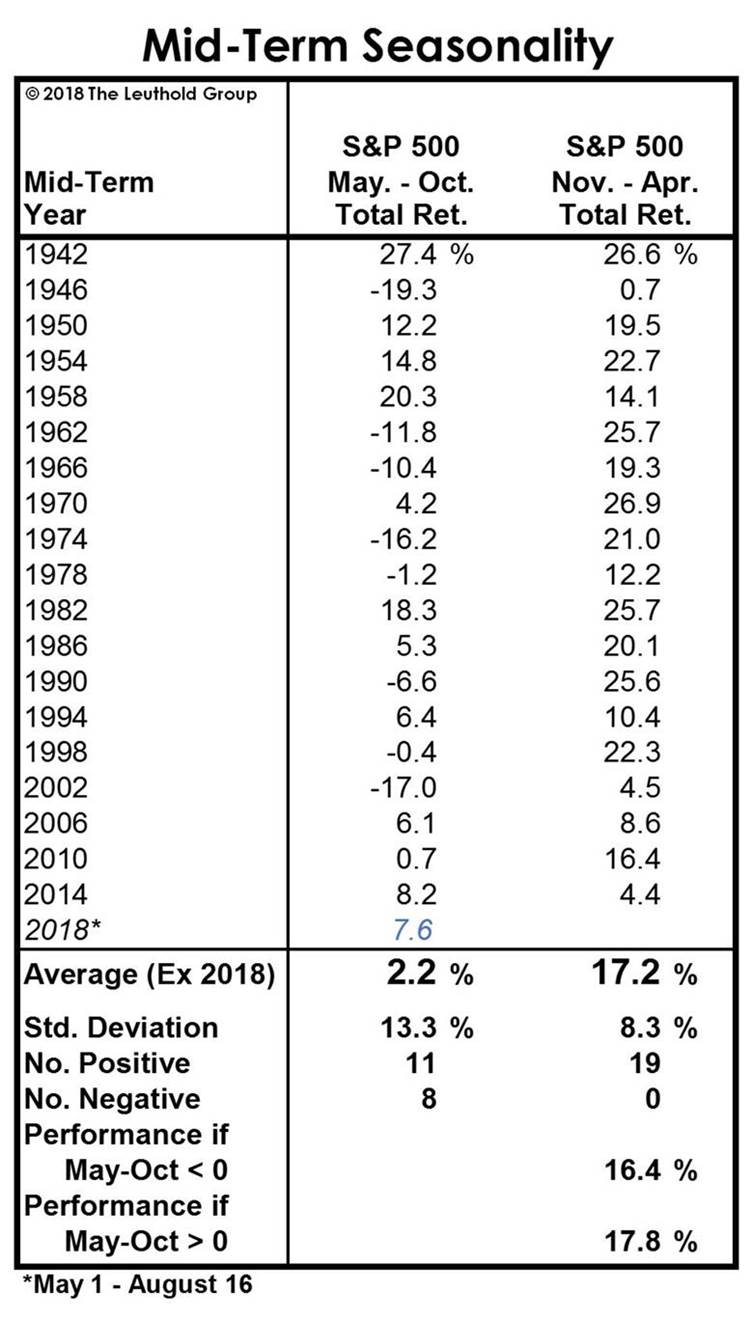
While the quant table concluded with 2018’s Midterm-election, we can update by informing that there was a +20% gain through April of 2019. Additionally, if you had bought the 2022 November Midterm-election through April 2023, the gain would have been roughly +11%. This quant has been perfect throughout history, again evidencing fund flows are on a pretty strict schedule that would demand some type of exogeny/endogeny to throw them off course.
The weight of the evidence, thus far and with looking into 2026’s Midterm-election year may appear uninspiring, but that is why we maintain low expectations going into the calendar year, and position for potential early weakness. The November – April quant above also helps investors/traders to consider how much cash they might want to hold for this pristine period of positive returns.
Direct quote from Finom Group’s “Perplexingly Positive Prognosis : 2026 Outlook″ Research Report (November 30th, 2025)
Here is another useful set of quantitative data to help with expectations throughout 2026’s Midterm-election year (Joe Teranova):
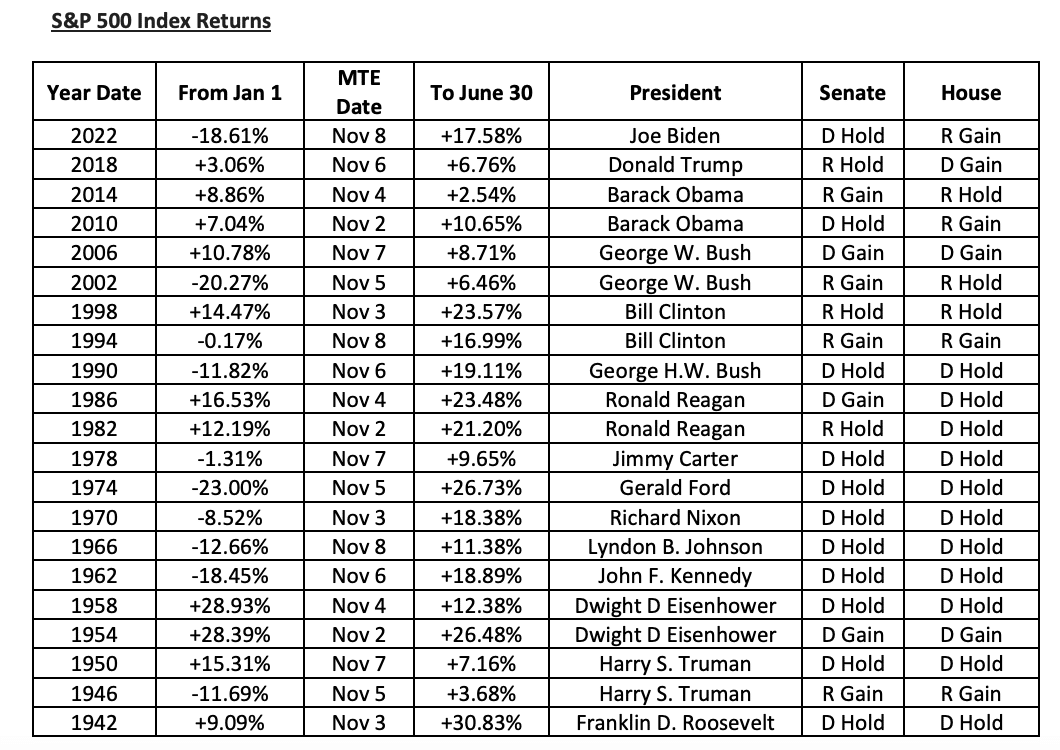
The below bullet points outline the data of Midterm-election (MTE) year performance from left most column forward:
- Market performance analysis from January 1 MTE year to the date of the MTE = 11 positive performance periods and 10 negative performance periods. Basically 50/50, no real edge for the bulls or bears.
- Period comparison – January 1 MTE year to MTE date vs. MTE date to June 30 of the following year = 5 occurrences (1950, 1954, 1958, 2006, 2014) of better performance for the period before the MTE
- 16 occurrences of better performance for the period after the MTE
- 11 occurrences of double-digit outperformance for the period after the MTE
- Market performance analysis from the date of the MTE to June 30 of the following year.
- 21 consecutive positive performance periods.
- 14 double digit positive performance periods
- 6 double digit positive performance periods greater than 20%
- Only 2 occurrences (1946, 2014) with positive performance less than 5%
As we can see from this data as well, buying from the Midterm-election day itself and holding through June 30 of the following year, every occurrence delivered a positive return and mostly double digit returns. Plan, plan accordingly folks!
What’s the practical utility of this data and as it pertains to portfolio management? Here’s how we would answer that question:
“If the S&P 500 annual gain since 1950 is roughly +10%; Let’s say you held minimal market exposure during the bulk of the Midterm-election year. If you then bought on the 1st trading day of November or Midterm-election day, there’s a whole lot of evidence suggesting one could avoid significant drawdowns and still catch up with the average annual S&P 500 performance in the forward 12-month period. Not necessarily the suggested participation, but a fact nonetheless.“
Having said all of that, there is another nuance to consider for Midterm-election years. Second Term Presidents tend to find better Midterm-election year market returns than in their first term (Ryan Detrick of Carson Research).

Often, I would agree with the raw data, but a 2nd term presidency doesn’t often come with this much fiscal policy uncertainty. In a President’s second term, the markets, the people, and the economy largely know what to expect. I simply can’t suggest that with fiscal policy still remaining quite elevated and consistent with President Trump’s first term, that this type of policy uncertainty will align for 2026’s Midterm year. However, if the Federal Reserve Open Market Committee (FOMC) remains a friend of the macro-markets going forward, there is a higher probability for this 2nd term, Midterm-election year to deliver above average returns. The bullet points below reference all the 2nd term Midterm-election years, S&P 500 returns and Fed actions:
Dwight D. Eisenhower 1958 = 38% (cutting)
Lyndon B. Johnson 1966 = -13% (hiking)
Richard Nixon 1974 = -29% (hiking)
Ronald Reagan 1986 = 14.6% (cutting)
Bill Clinton 1998 = 27% (cutting)
George Bush 2006 = 14% (slow hike)
Barack Obama 2014 = 12% (pause)
It’s clear, as we break down as much of the data and introduce other variables; if the Fed is friendly the markets have performed better and assuming no recession. When the Fed is an adversary to the markets, in efforts to fight inflation of sorts by hiking rates, the markets have a difficult time. Recall in both 2018 and 2022 Midterm-election year that the Fed was hiking rates throughout the entirety of the calendar year.
Direct quote from Finom Group’s “Perplexingly Positive Prognosis : 2026 Outlook″ Research Report (November 30th, 2025)
Lastly, and “assuming no recession”, what are the odds that a recession DOES occur, even if the markets don’t deliver a Zweig Breadth Thrust…

It’s not perfect, but it’s the next best thing (Chart via RW Baird). It got really rough in 2022, the last Midterm-election year. There was also and initially reported 2 consecutive quarters of negative GDP, usually associated with a recession but not exclusive to a recession. The probability, however, that 2022 would actually deliver a recession were quite low (only one Year 2 with recession). It was not nonexistent as the chart above depicts, but it was quite low. Again, such quantitative studies helped Finom Group navigate even the ugly bear market of 2022 with a bullish posture, given the lack of recessionary probabilities (chart via Carson Research).

If you weren’t buying the bear market, when no recession was presented, you were found chasing the market higher ever since. Buying discounts is to your advantage, regardless of the momentary risks. Your job is take risk as an investor, and manage that risk thereafter. Don’t confuse the order of events/actions!
One last thing; sorry we almost forgot:
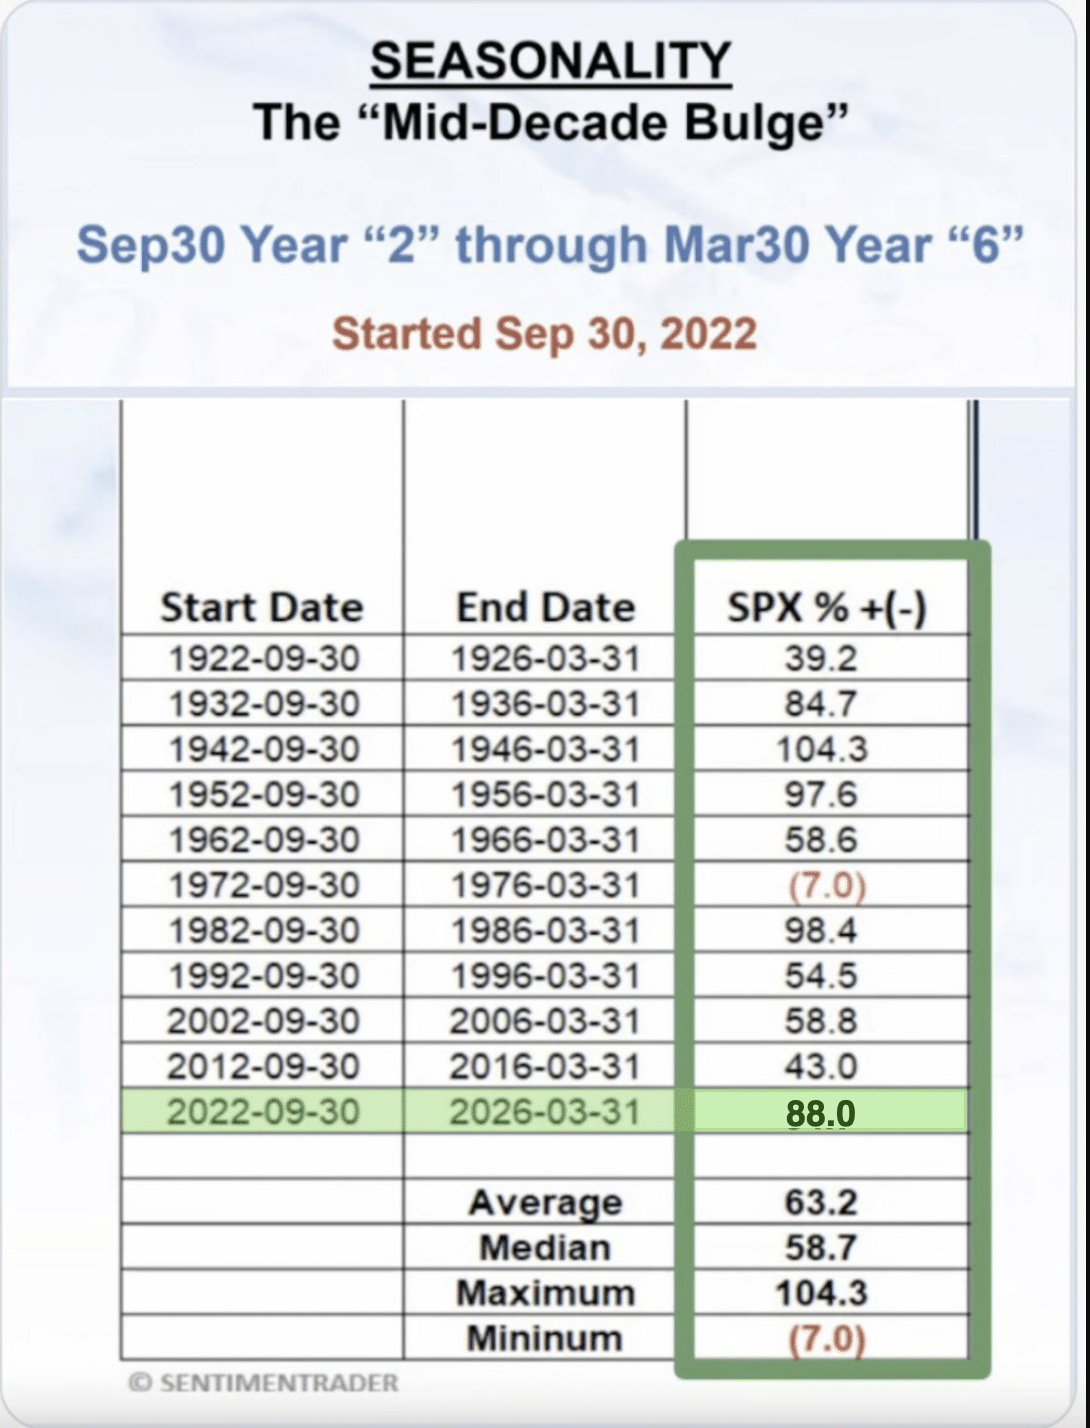
Finom Group originally shared the SentimenTrader quant labeled the “Mid-decade Bulge”, back in 2022. This is historically another scheduled fund flow quant, evidencing the time period between September Year 2 i.e. 2022 and year 6 or the following Midterm-election year. Historically, returns during this time period are the best of the decade. Unfortunately, on March 30, 2026 we will be exiting the Mid-decade Bulge period. To-date, the S&P 500 has achieved above average and median returns during the 2020’s Mid-decade Bulge.
Direct quote from Finom Group’s “Perplexingly Positive Prognosis : 2026 Outlook″ Research Report (November 30th, 2025)
Positioning And Discipline
Markets have entered year 4 of the bull market cycle. Good news: Only 1 bull market ended in its 4th year since 1957. Bad news: That bull market ended in a Midterm-election year. Still a low probability, but Midterm years suck nonetheless. Your best planning and positioning for 2026 occurs in Q4 2025, get busy folks!

The past four year, “4s” saw stocks up double digits and higher six out of seven times.
All things considered equal in Q1 of 2026, the fundamentals should prevail, and by prevail we mean deliver a continuation of the bull market trend. Earnings are quite strong Q/Q and Y/Y. Earnings estimates also continue to rise for 2025 and 2026, due in part to ongoing profit margin expansion and revenue strength. There could certainly be turbulence in and around the Q1 and 1H 2026 period, but all things considered equal that is likely yet another dip-buying opportunity for investors.
Direct quote from Finom Group’s “Perplexingly Positive Prognosis : 2026 Outlook″ Research Report (November 30th, 2025)
Given that the markets have still yet to express a full –10% garden variety correction in 7 months, we would lean into the data to suggest that a correction holds a reasonable probability of appearing in 1H 2026. After all, the average calendar year delivers on average a -14% correction, so such an outlook would simply be a data-driven expectation. As always, if the market outperforms the average by not delivering a correction, we should have enough quant data to inform how to better redeploy capital either way. Additionally, the short-VOL portion of the Golden Capital Portfolio (VXX short) would bridge the underperformance gap. In 2025, VXX has gained +30% while the S&P 500 is up +16.45% (Average intra-year drawdown chart via Charlie Bilello).

To be clear, Finom Group is not forecasting a correction, but rather recognizing the probabilities in the average calendar year. With that being said, if there was technical data that alludes to such a correction, we have witnessed and disseminated such data in the month of November.
As noted atop Finom Group’s 2026 Outlook Report, certain of the technical and market internal patterns have deteriorated to a level that proves a warning signal. The NYSE and Nasdaq High-Low Logic Index achieved critical threshold levels that could spell out the fragility of markets and latter stage of the bull market whereby a greater correction to reset OPPORTUNITY/Valuation thereafter revive the bull market once again. This market internal breadth warning concerned us going into 2022 and coming into 2025. The warnings were realized with bear markets of sorts in both calendar years. A full bear market is not what this breadth warning always delivers, but as evidenced in the quant data below from Bluekurtic, a double-digit correction is the highest probability outcome!

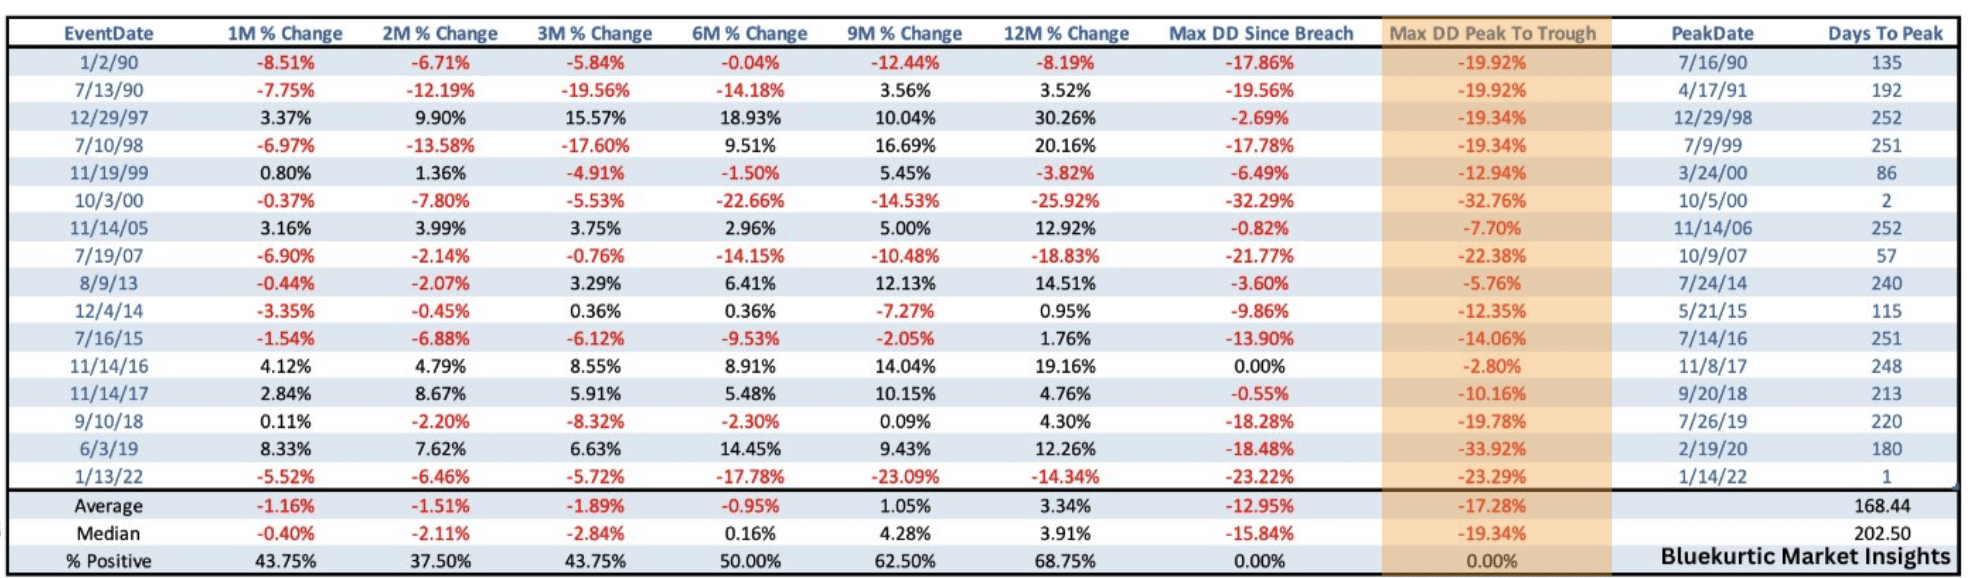
We have duplicated the table and highlighted the Maximum Drawdown column for ease of use. As outlined and at the very least, this suggests investors anticipate a greater market pullback or correction in the coming months/quarters. Indeed, if the pushback to such quantifiable data is that this is but one data point, I would concede, but even without this specific data point of consequence, we reference or reiterate the average year delivers on average a -14% correction and Midterm-election years average a -17.5% correction. Can the AI trade and pending tailwinds from the OBBA serve to offset these outlined probabilities? Certainly! The benefit of having cash and time for more data to materialize in the coming months, however, allows for one to be cautiously positioned yet also cautiously optimistic.
Direct quote from Finom Group’s “Perplexingly Positive Prognosis : 2026 Outlook″ Research Report (November 30th, 2025)

Not for nothing, but if this is a market bubble then it is the worst bubble investors have ever experienced. The construct of “this bubble” has falling P/Es and a 5-year trailing price change that is a 10th of the Dotcom bubble. We wouldn’t suggest that investors ignore valuations, but rather understand that, at best, elevated valuations can prove a breeding ground for market volatility as “value opportunity” holds buyers at bay.

“Only thing that we should anticipate from high valuations are bigger pullbacks. When valuations in 9-10% decile, correction probabilities increase sharply. 80% probability of 10%+ correction (Feb-Apr) 98% probability of -5% pullback.”
Moreover and since mentioning the “Dotcom bubble” …
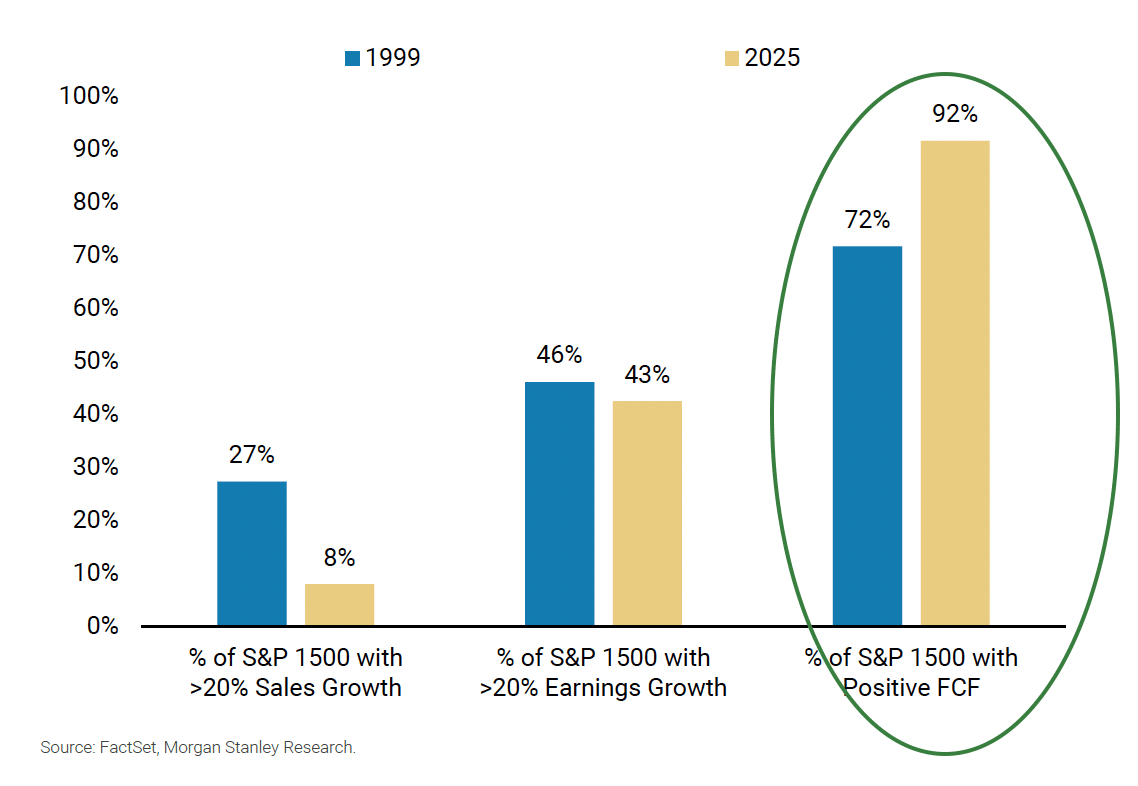
Across the broader market, 1999 saw a significantly higher percentage of stocks growing top line at 20%+. That said, the percentage of stocks growing earnings at 20%+ is quite similar today (43% vs. 46% then). This speaks to the strength of profitability today and the differences in the composition of the index. It’s also worth noting that a significantly higher percentage of the S&P 1500 is free cash flow positive today (92%) relative to this period (72%) (Morgan Stanley).
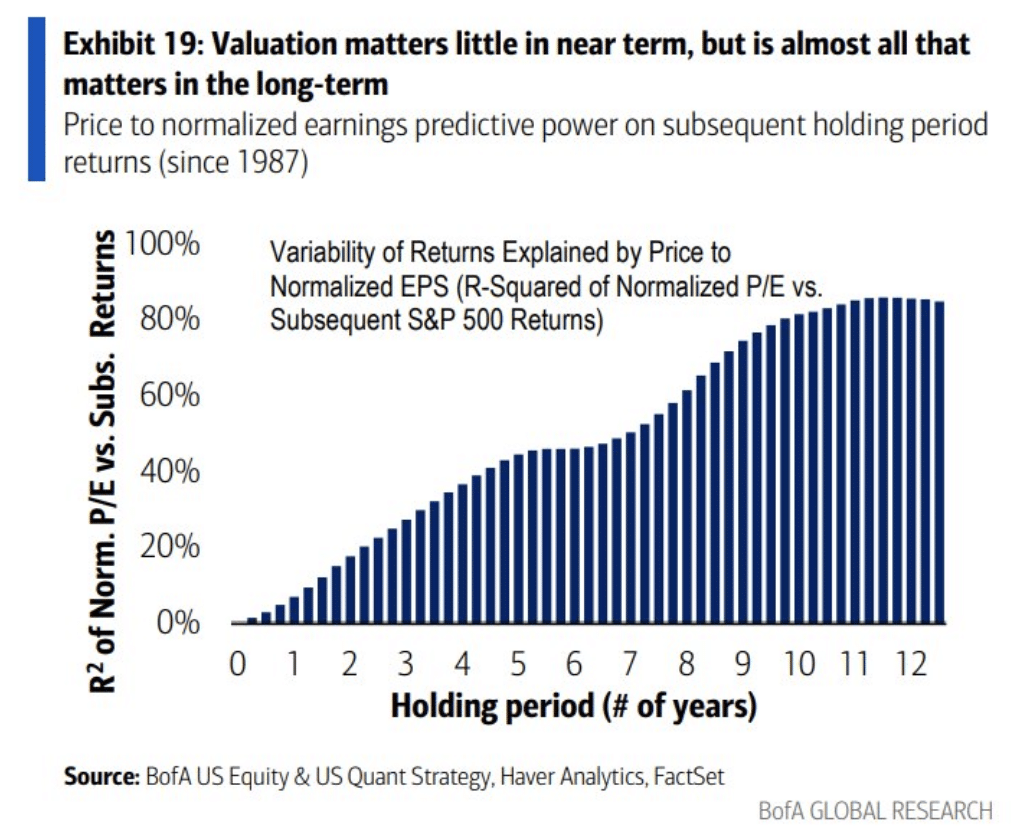
Last, but certainly not least, there is historically no relationship between the S&P 500’s P/E multiple and forward 1-year S&P 500 returns.
Direct quote from Finom Group’s “Perplexingly Positive Prognosis : 2026 Outlook″ Research Report (November 30th, 2025)
First and foremost, we’ve already offered an ample amount of information, spanning a goodly amount of macro-market subject matter to better inform investing/trading decisions through year-end and into/through 2026. With that, we encourage Finom Group members to maintain low expectations as a savvy investor discipline, and simply allow the macro-market outcomes to outperform those expectations while committing to such savvy investor disciplines. Secondly, we reiterate the likelihood that this year-end/2026 macro-market Research Report is likely to be updated before year-end and as we track the realized price action and as it relates to ongoing quant studies or quants “in play”. Please be on the look out for notifications, in this regard. With that being said, let us now reposition and review some of these quants, while emphasizing the quants that give us confidence about the continuation of the bull market for 2026, even if the 2026 bull market encompasses higher volatility and/or greater corrective price action relative to 2025, which seems hard to imagine after Q1 2025.
1. Through 1H 2026, if another 1H Correction of Consequence

- The S&P 500 gained 25% after falling at least 15%
- Bullish trigger 7/3/2025 and price 6,279
- 6-months forward SPX has never been lower i.e. 100% positivity rate.
- Average return from signal date = +8.17%
- If achieved, SPX would = 6,791, so far so good
- Looking out a full calendar year suggests the S&P 500 will hold above 6,279 by 7/3/2026
2. Overextended Bullish Trend Bodes Well Long-term

Since the quant trigger date of October 28th, those formerly overextended conditions have indeed delivered a choppy market in the forward 2-week period, with negative 2-week returns. As evidenced in the data above from The Market Stats, indeed, negative returns were the average performance when the S&P 500 was trading some 13% above its 200-DMA. Good news, the probabilities and average returns improve from there. Quant data helps to assuage all of those negative headlines and financial media narratives of doom and gloom by evidencing what usually happens in the market regardless of the narratives. The consolidation over the prior 2-week period, was the higher probability outcome. When the market is doing what it is expected to do, we still see this as a bullish outcome. These kinds of overextended conditions are usually long-term bullish, as indicated by the 95% positivity rate 1-year forward.
3. The Fed Is Perfect, Like It Or Not

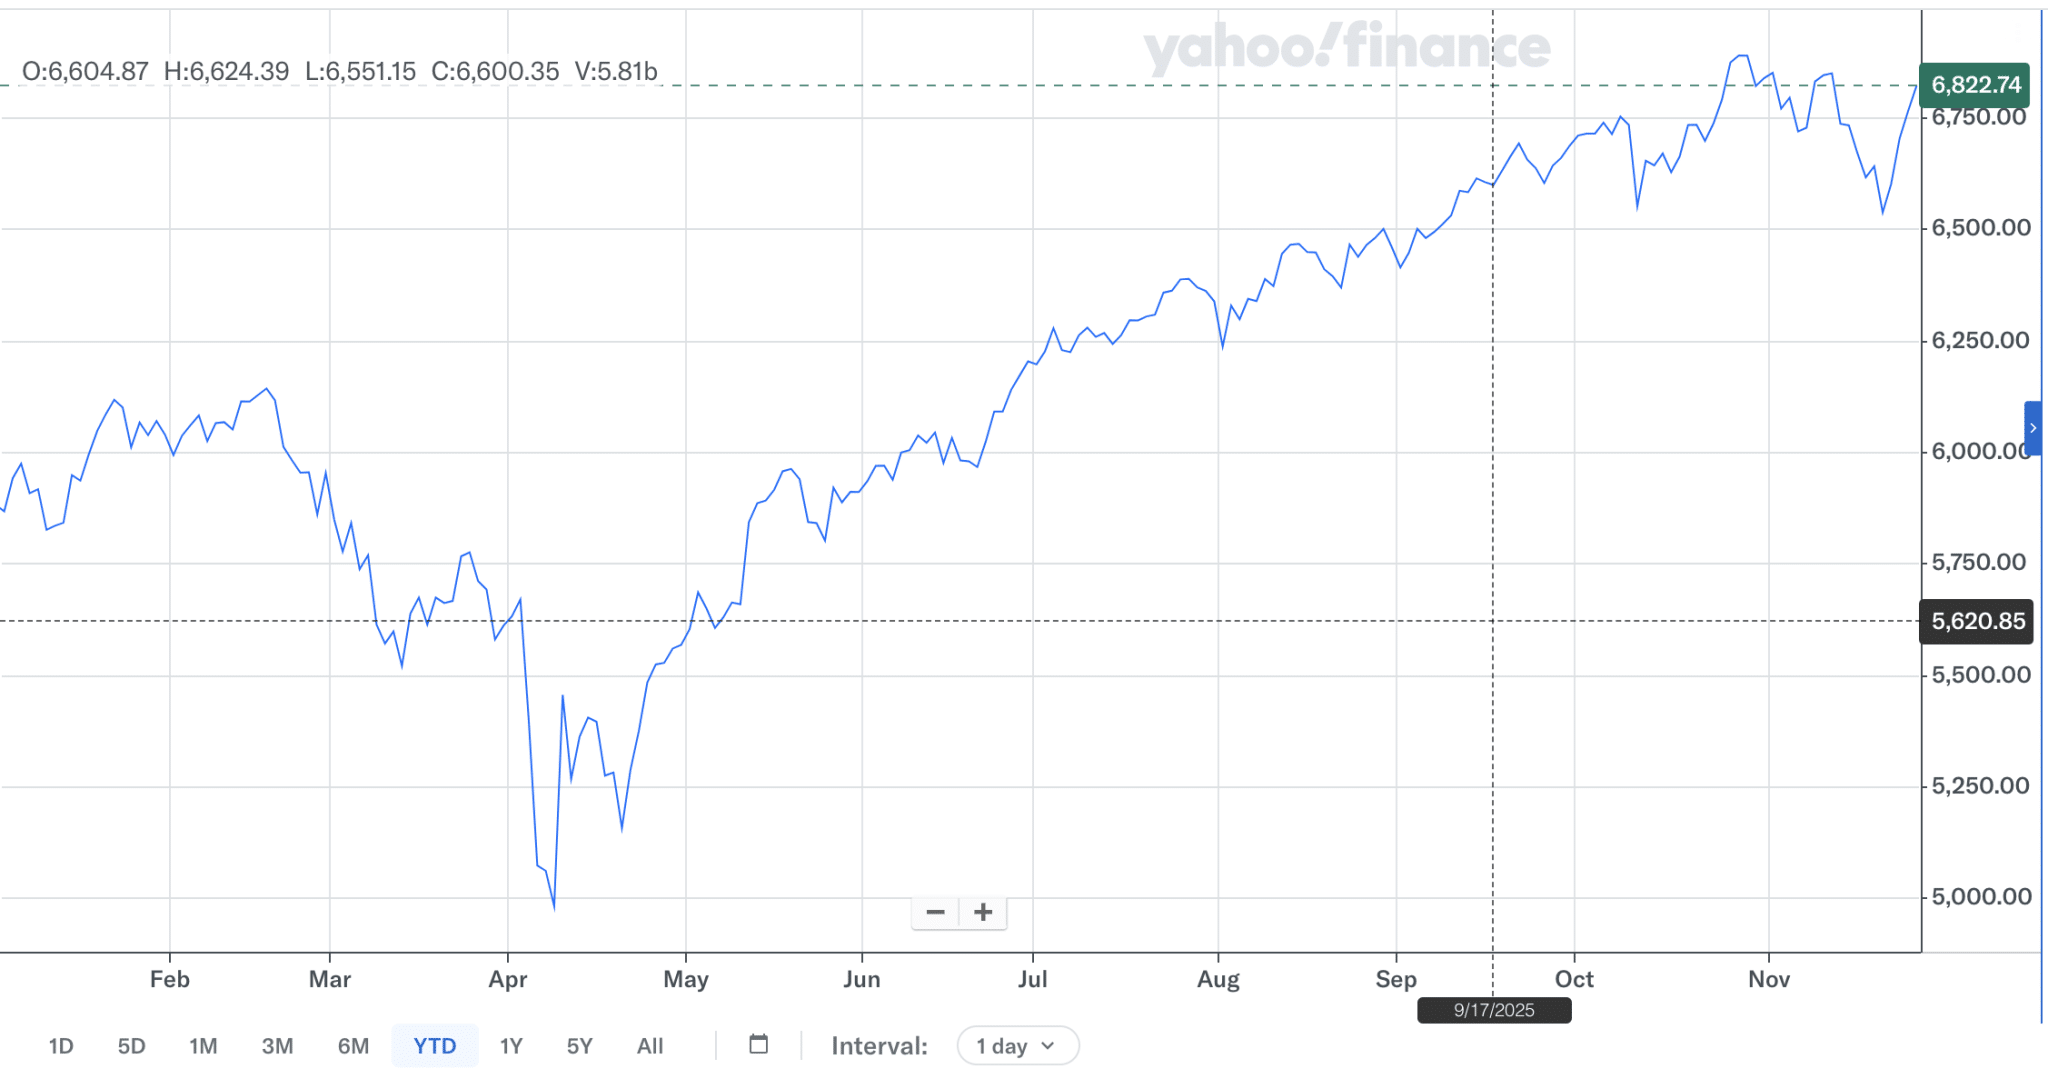
For all of the flack dished-out and taken by the Federal Reserve and it’s chairman, the Fed’s track record is undeniably perfect. As shown in the quant above from Fundstrat, absent a recession and post the Fed’s first rate cut, the S&P 500 has delivered a positive return EVERY. SINGLE. TIME 1 – 12 months forward. The chart of the S&P 500 above depicts the date (September 18, 2025) and closing value (6,600) from the first rate cut of the easing monetary cycle. Two months since, indeed, the S&P 500 has been higher in value.
4. Nasdaq 7-month Rate of Change

The NASDAQ 100 (QQQ/NDX) is up +47% over the past 7 months. Historically, the NASDAQ 100 was down 2 weeks later, every time (pullback), but UP 1 year later, every. single. time. Overbought streaks are not the enemy of the savvy investor, they are beckoning near-term consolidation for savvy capital redeployment, historically speaking (Subu Trade).
5. Nasdaq Win Streak Comes To An End

Although the S&P 500 win streak extends to 7-months, the Nasdaq 100’s 7-month win streak has come to an end in November 2025. No harm, no foul, and somewhat to-be-expected as such lengthy streaks are few and far between since the index’s creation. With that being said, after prior 7-month win streaks, the Tech-heavy index has never delivered a negative return 8, 10, and 12 months forward. Finishing the month of November at 25,434, any price below over the coming 8 months should prove a buying opportunity and rewarded by July 2026 (The MarketStats).
6. Lucky 7s for the S&P 500

So far as win streaks are concerned, the S&P 500 has caught up with the Nasdaq 100 and delivered a 7-month win streak. Will December make it number 8? Good question, and we think the probabilities are high given certain of the quant data already disseminated. What the data within the Subu Trade quant inform about such win streaks is that fading them is to the detriment of one’s portfolio gains going forward. There can certainly prove some near-term price consolidation, but high prices are the highest probability 2-12 months forward. Most importantly, 7-month win streaks have never delivered a negative return 7 months forward. A perfect 16 – 0 with the potential to go 17 – 0 by June 2026. With the S&P 500 finishing November 2025 at 6,849, we would anticipate any price below there to be rewarded with profits by June 20226.
7. What If No Zweig Breadth Thrust Occurs

While the market has not yet delivered a Zweig Breadth Thrust within the 10-day period designated (by December 5, 2025), there has proven a considerable up leg that, at its peak, got just above .595. Historically, this in and of itself has designated forward S&P 500 return probabilities as being almost as guaranteed as a full Zweig Breadth Thrust itself. Don’t get us wrong, we’ll await to see if a full Zweig Breadth Thrust is delivered either way.
8. Nasdaq Composite, Big Move Off Major Low, Big Picture Moving Forward
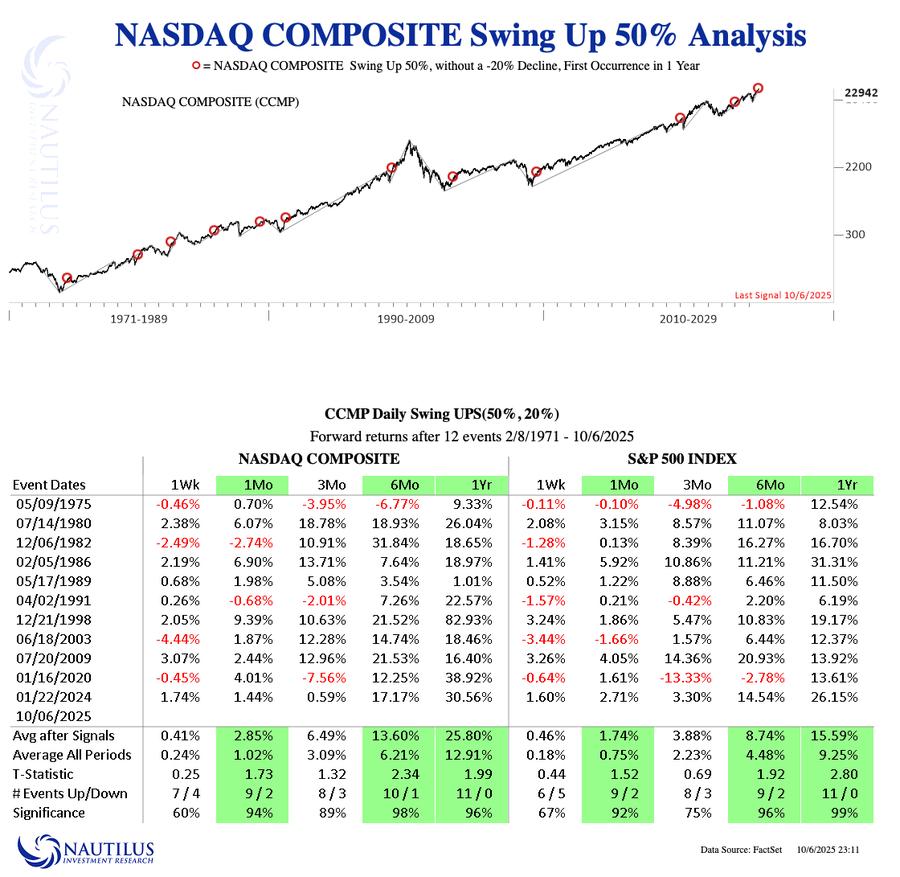
Historically good things happen when the Nasdaq Composite posts a 50% swing higher; off a prior bear market low. On October 6, 2025, the Nasdaq Composite hit a 50% return from its bear market low in April of 2025, at 22,941. Historically, a 50% swing higher from a bear market low proved the precursor for another annual advance. 12-months forward neither the Nasdaq or S&P 500 were lower after such an achievement. Since this signaled in October, the 1-month forward returns were also positive for both indices, now advancing the up/down to 10 ups and only 2 downs. While a great amount of price action can be found between now and October 6, 2026, the quant informs that the Nasdaq should cycle above 22,941 and S&P 500 above 6,740 come that time (Nautilus Research).
9. Keeping An Eye Out For NYSE A/D Line New ATH

The last NYSE Advance/Decline Line all-time high was on October 27, 2025. Only twice did the A/D Line peak and was that also an S&P 500 all-time high. If it didn’t result in the S&P 500’s all-time high, median lead time to the S&P 500’s top was roughly 7 months or 30 weeks ahead. The Average return (after A/D Line High) to SPX ultimate top is +10.2%. If the S&P 500 top didn’t occur right away, the earliest it would peak was 8 weeks later or December 5, 2025, which just so happens to be the final day for which a Zweig Breadth Thrust can occur for the up-leg. We think it important to monitor the NYSE A/D Line at this stage of the year and bull market, given the importance of market breadth going into the new calendar year. Finom Group is of the opinion a new NYSE A/D Line all-time high remains the most data-supported outcome. If achieved, it can serve to extend the bull market trend into 1H 2026 (The Leuthold Group).
10. Bonus: The Golden Nugget
In suggesting the NYSE A/D Line achieving a new all-time high is data-supported, we would also be of the opinion so does the S&P 500, as breadth typically leads price. With now just 4 weeks left in the calendar year, the new all-time HIGHs for both could materialize by year-end if not in the 1st week of January. A goodly amount of this sentiment can be extrapolated from the Wayne Whaley quant below:
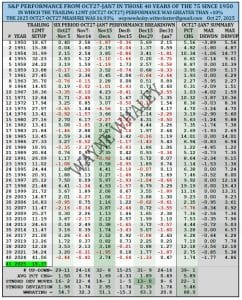 With the S&P 500’s trailing 12-month returns of greater than 12% as of October 26, 2025, the forward S&P 500 returns from October 27 – January 7th (of New Year) have been positive 39 of 40 times. Just that isolated period is what we are looking at here. If you wish to focus on the one loss ahead of the Great Financial Crisis, that’s not what quantitative investing is about, but be our guest. Given the average price gain for the stated period under review is 5.89% and the trigger date of the study began at 6,791, AND with still 5-weeks worth of trading to go in the quant period, we find it difficult to suggest the S&P 500 is going to ping-pong in a 1% range over the stated time period. The greater probability and average returns speak to higher prices and a new all-time closing high for the S&P 500, which likely also speaks well for the NYSE A/D Line.
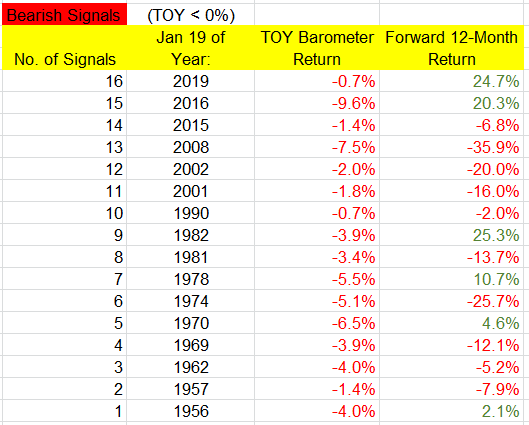
Now because there has been a pullback period since October 27th, this is actually beneficial for forecasting the TOY Barometer period (November 19 – January 19), which may at worst trigger a Neutral TOY Barometer signal for 2026 when its quant period expires on January 19, 2026. For the TOY Barometer ( please see TOY Barometer video from 2021), we simply desire to avoid a Bearish TOY Barometer i.e. negative -SPX returns from November 19th – January 19th, like there was in 2021 into 2022.
There have been 17 (to include 2022) bearish signals. Only 6 (38%) of the following years posted a gain while 10 posted losses, and 6 of those 10 posted double-digit losses. The overall average and median returns were -3.6% and -6.0%. The “up” years posted average and median gains of 14.6% and 15.5%, while the “down” years posted average and median losses of -14.6% and -12.9%. So despite the low win rate, when the market does well, it has the ability to do very well, as was the case this past year.
Now for the analysis of this Neutral TOY sentiment and using another Wayne Whaley quant.
When the S&P 500 has delivered positive returns in May, June, and July periods respectively, the October 27 – January 18 period has been positive in all 17 occurrences i.e. within the TOY Barometer period even if not considering the final TOY Barometer period day of January 19th.
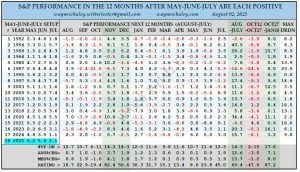 “A 17-0 TURN OF THE YEAR SETUP – compliments of positive months in May, June & July Coming off the 20% Feb19 – Apr 8 pullback, May, June and July have each managed to post positive months, up 6.2, 5.0 and 2.1%, resp. There have only been 17 previous cases in the 75 post 1950 years in which the traditional “Sell in May & Go Away” time frame kicked off with three consecutive positive months ( May-June-July), exhibiting resilience which history suggest merits respect. The following 12 months, August-July were 14-3 in this setup for a respectable average gain of 12.6% as compared to a normal 9.5% year. In this particular setup, the only forward negative month in the following year was October, with the October 12-27 time frame going 2-15 for an average loss of 3.0%. However, Oct 27 – Jan 18 flips those losses and then some, going 17-0 for an average. 7-week gain of 7.1%. The S&P 500 closed at 6,791 on October 24, 2025 (weekend ended October 26th).”
Now, recalling that the TOY Barometer period begins on November 19th with a November 18th closing/starting S&P 500 price of 6,617, the quant above👆👆 informs that ALSO by January 18th, at least, the S&P 500 should be above 6,791 (because it has been perfect at 17-0), which is an advance from the start of the TOY Barometer period of roughly +2.7%. Such a gain would prove to be a TOY Barometer Neutral signal with an S&P 500 return of 0% to less than +3%, from November 19th – January 19th.
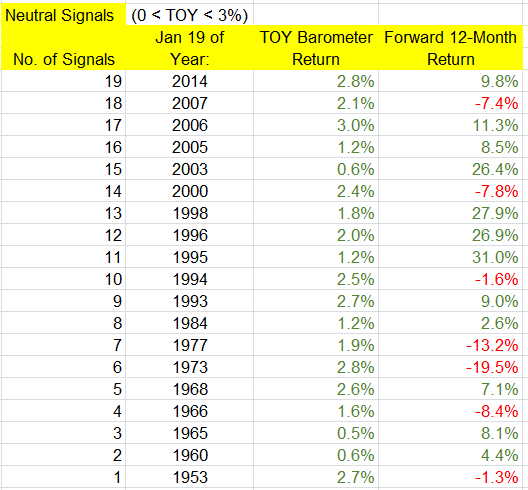
There have been 19 neutral signals. The following year was positive 12 times (63%), compared to 77% win rate for “all years.” The overall average and median returns were 6.0% and 7.1 percent. But among the “up” years, the average and median gains were 14.4% and 9.4%, while the “down” years’ average and median losses were -8.5% and -7.8 percent. There were several big up years (1995, 1996, 1998, 2003), and two big down years (1973, 1977), so even if there is a Neutral signal, there’s still a decent chance the following 12 months will venture far from its January 19 print.
“Could there be a Bullish TOY Barometer signal (November 19th – January 19th SPX return 3% or greater)?” Absolutely! And if there is such a signal, that would almost be as bullish for 2026 as would be a near-term Zweig Breadth Thrust. Here is what a Bullish TOY Barometer has offered investors since 1950. Spoiler alert 🚨: After a Bullish TOY Barometer, the forward 12-month performance for the S&P 500 has only been negative twice, 1987 and 2018.

YOU’RE ALL CAUGHT UP NOW. THANKS FOR READING!
If you have any questions, feel free to message Seth Golden or contact us support@finomgroup.com
Comment below or tag us on X (@FinXWeekly) with your thoughts—your feedback drives our innovation.