
Welcome to our Finom Group July Monthly Macro-Market Recap
The Imperative of Discipline and Data in a Turbulent 2025 Market Landscape
Just hours after Jerome Powell and the Federal Reserve announced there will be no interest rate cut this month, the NASDAQ composite (COMPQ) is wrapping up July by recording THE MOST amount of 3-year highs in July since 1970 (14), per SentimenTrader, as the S&P500 lags, now trading just under 6,400. Despite continued pressure from President Trump and ongoing hopes across Wall Street for a policy shift, Powell stuck to his message. At today’s press conference, he reminded everyone that the Fed is not ready to lower rates, citing sticky inflation and ongoing tariff-related uncertainties as reasons to be patient and keep a close eye on the data. Even as many investors are hoping for an easier path, Powell insists on a cautious, wait-and-see approach.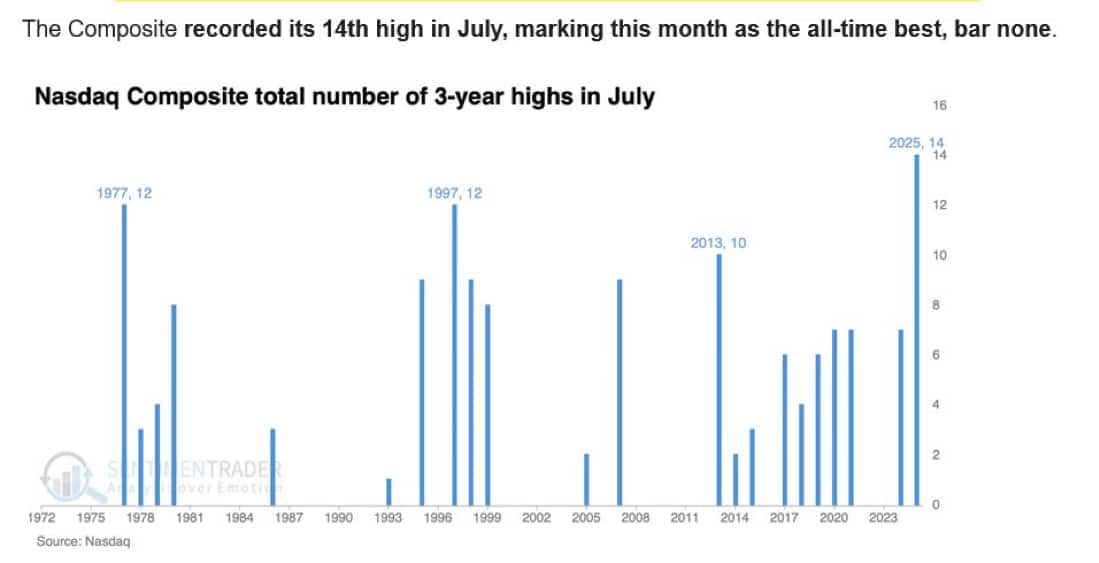
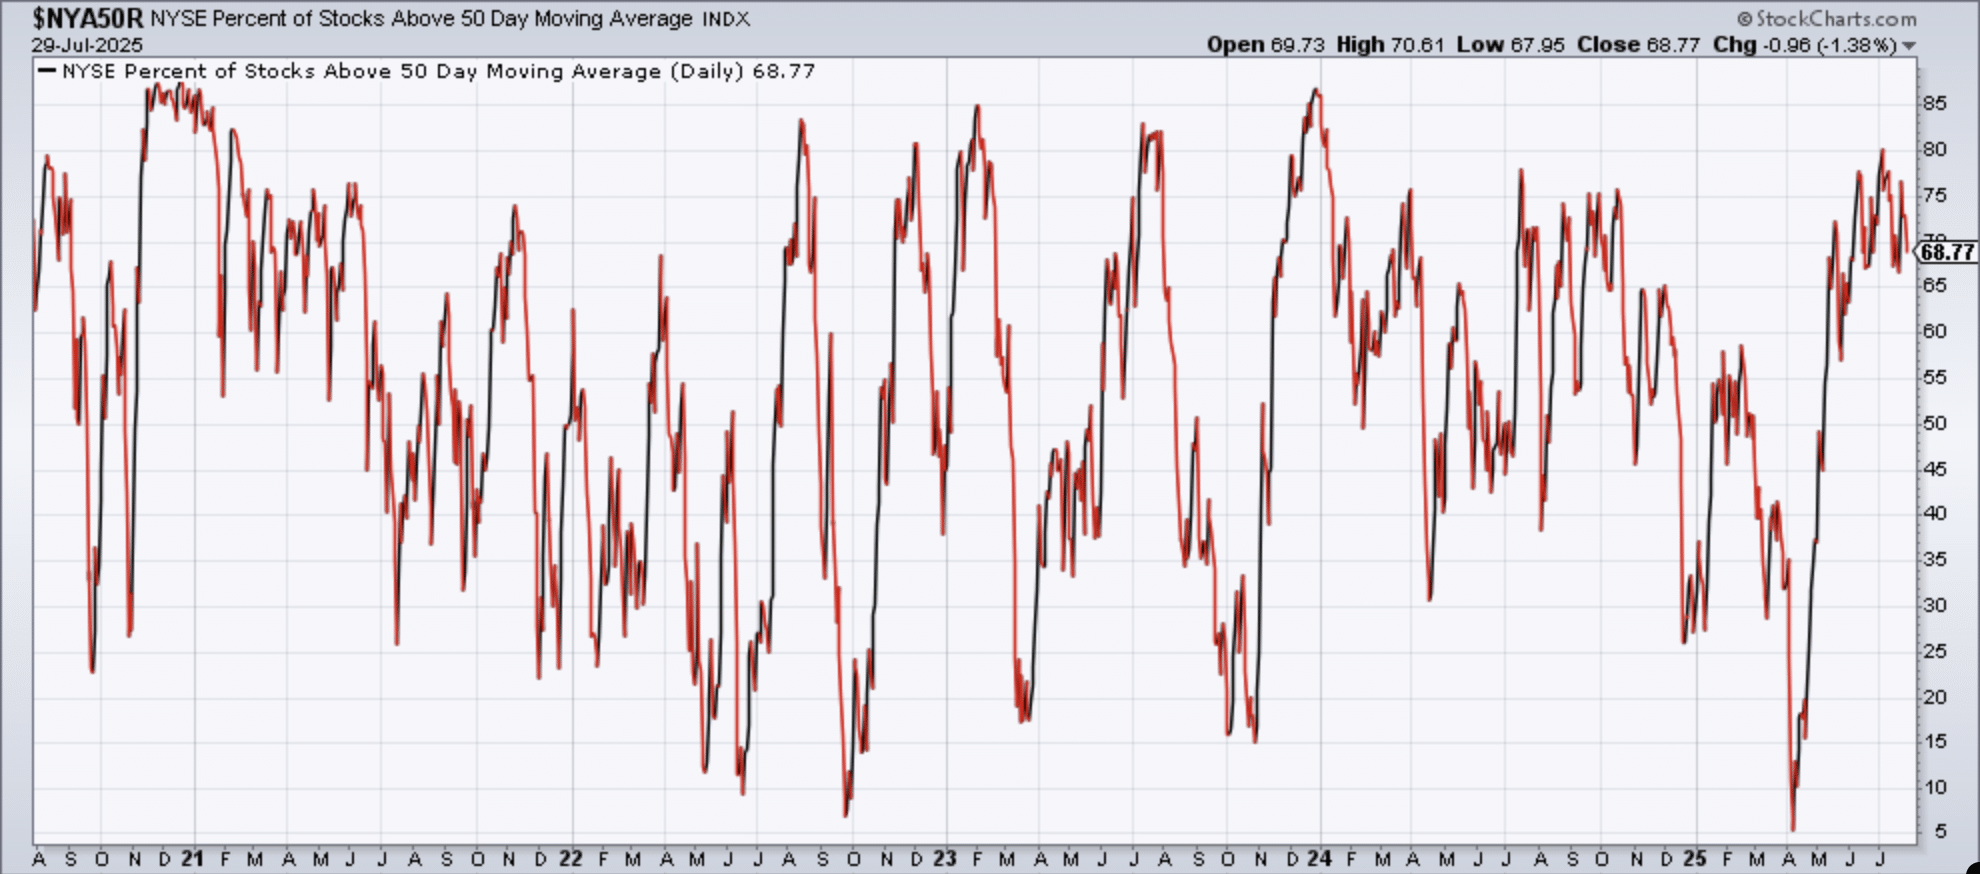
Through all of this, the market’s steady climb has surprised many. The new highs and consistent strength have come in the face of ongoing debates about #TrumpTariffs, a busy earnings season, and moments of rapid change in sentiment. The S&P’s resilience continues to puzzle both bulls and bears, as mega-cap tech and semiconductor stocks push leadership forward. At the same time, there is still a lot of focus on market breadth. The 4th, and last puzzle piece 🧩 to the awaited “Golden Bull” signal, when ninety percent of NYSE stocks trade above their 50-DMA’s, has not triggered just yet. And with every economic announcement and policy update day in/out, investors squabble to adjust their outlook to this schizophrenic policy.
The atmosphere remains dynamic, sometimes even tense, but this market asks for both flexibility and discipline. In a year when so many predictions have fallen flat, one thing stands out: attention to data and a clear process matters much more than reacting to headlines or hoping for a policy rescue.
As we close out July and head into the late summer stretch, this recap is designed to help you cut through the noise. It pulls together our most important research and up-to-date market context so you can make smarter, more informed decisions, no matter how unpredictable the headlines may seem.
Discipline has not been optional, it has been essential. Our research and real-time communication to members has repeatedly emphasized that surviving (and thriving in) a year like this requires more than hope or habit. It demands “aggressive discipline,” as tested by the stress of sharp rotations, news-driven disruptions, and the psychological challenge of staying focused while the narrative flips between fear and euphoria.
This monthly recap distills the most actionable insights from our team’s analysis and Seth’s commentary covering June through July 2025. It is designed to connect current price action and macro signals directly with our previously published research so you can see not only what we forecast, but exactly how those views measure against what is actually happening in the market. To facilitate comprehension, I (Luis Solorzano) will omit any further personal commentary and present the information in a straightforward, and concise manner. The necessary details are provided, and you are encouraged to conduct your own research and draw your own conclusions. As I do my best to show up on a daily basis, the concepts become more clear, which is why I am, again, here. Hopefully I am not bothering 😅!
I (Luis S.) am confident the following past excerpts from previous research reports will prove beneficial to you.
Feel free to click on any of the below subsection headings, as I have hyperlinked the corresponding FinomGroup.com Research Reports to their below titles for your convenience, especially as we make new improvements onsite, highly recommend you do so! 🤓🧑💻
Whether you are a longtime member or discovering Finom Group for the first time, use this document as both a checkpoint and a compass. Let it clarify the prevailing trends, reaffirm the mindset and methods that work, and sharpen your perspective for the road ahead.
This is a market that has rewarded discipline, punished indecision, and demanded focus on the facts beneath the noise. With Q3 underway and new highs still being set, understanding what drives underlying strength, and where risk still lurks, has never been more important.
You are now ready to dig into the key research, market evidence, and real-world context featured in the sections that follow.
Direct quote from Finom Group’s “Recognition of Probabilities In 2H 2025″ Report (June 29, 2025):
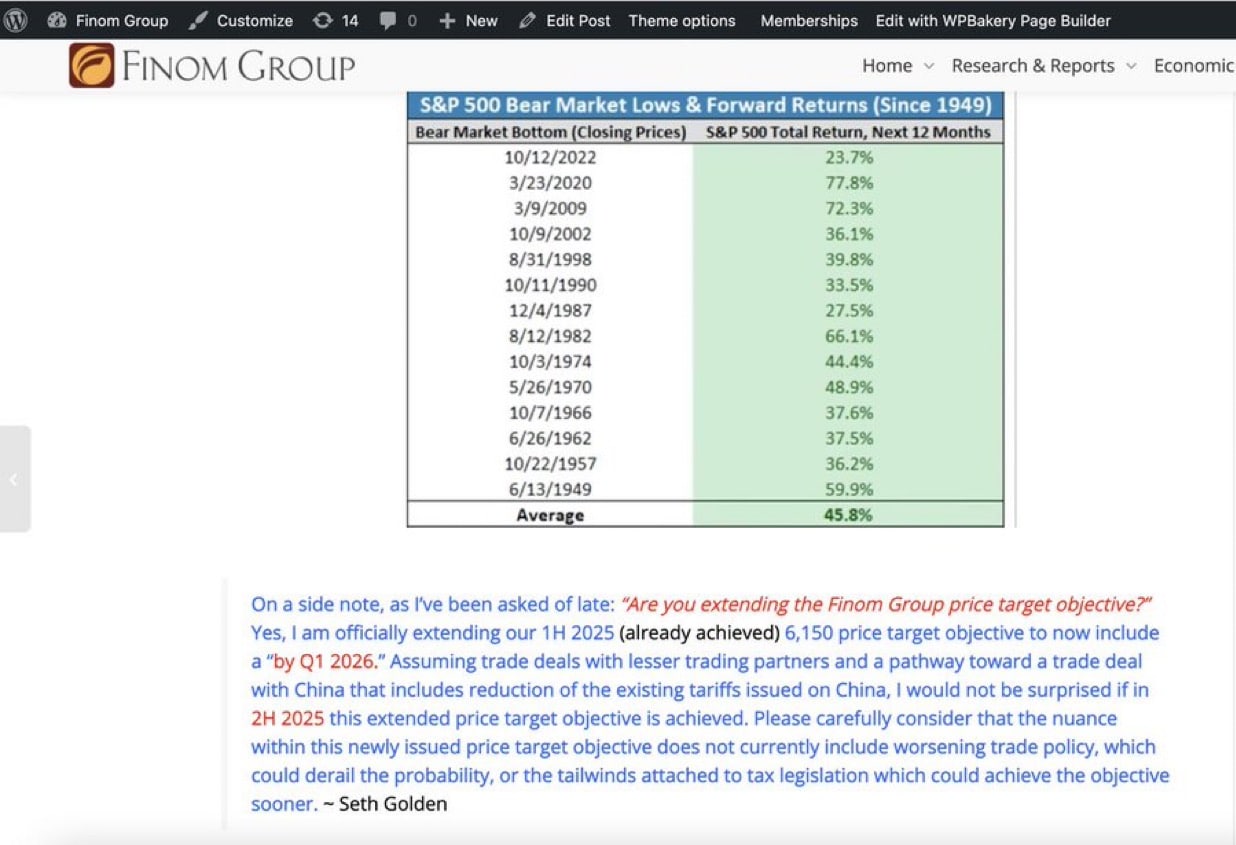
“…, we will look forward to re-evaluating and disseminating a new by year-end and rolling 12-month price target objective. For the sake of deliberating a sentimental and “gun 🔫 to head”, by year-end price target objective, 6,450 is seemingly a reasonable probability. Again, this is purely a sentimental offering and not a cemented price target objective. It merely disseminates sentiment around the markets’ recovering trend that would bring forward both older and newer quantitative probabilities (see report-end for older quants). As we have considered throughout 1H 2025, the landscape of the macro-market framework is one of living through both endogeny and exogeny. Neither dismisses our investing disciplines, but rather both suggest investors maintain low expectations and prepared to pounce on cheaper prices should a second VAR(Volatility Adjusted Risk) Shock present itself. Part of the Finom Group 2025 Outlook included 2-3 VAR Shocks, the first of which played out via the Trump Trade War. The potential for a second VAR Shock associated with the White House administration and/or fiscal policy should remain part of the 2H 2025 Outlook, in our opinion.”
The potential for another VAR shock or endogeny/exogeny is in-keeping with maintaining low expectations, but remaining disciplined. Within this expectation, certainly some of our quants/studies may fail… once again. Recall the quant below (within our June 15, 2025 Research Report), which failed to deliver on it’s near-term 100% positivity rate with the most recent exogenous event (Israel/Iran War):


Direct quote from Finom Group’s “Recognition of Probabilities In 2H 2025″ Report (June 29, 2025):
“We are getting close to July, and based on this pattern shown below, we could have a nice rally in July… The Nasdaq 100 (QQQ) has the highest index win rate in the month of July at 94%, since 2009, and beating SPY by 6 ppts. The average return also (+4.5%) beats SPY by 1.2 ppts. If you want to outperform you have be where outperformance takes place more often than not.”


Direct quote from Finom Group’s “Recognition of Probabilities In 2H 2025″ Report (June 29, 2025):
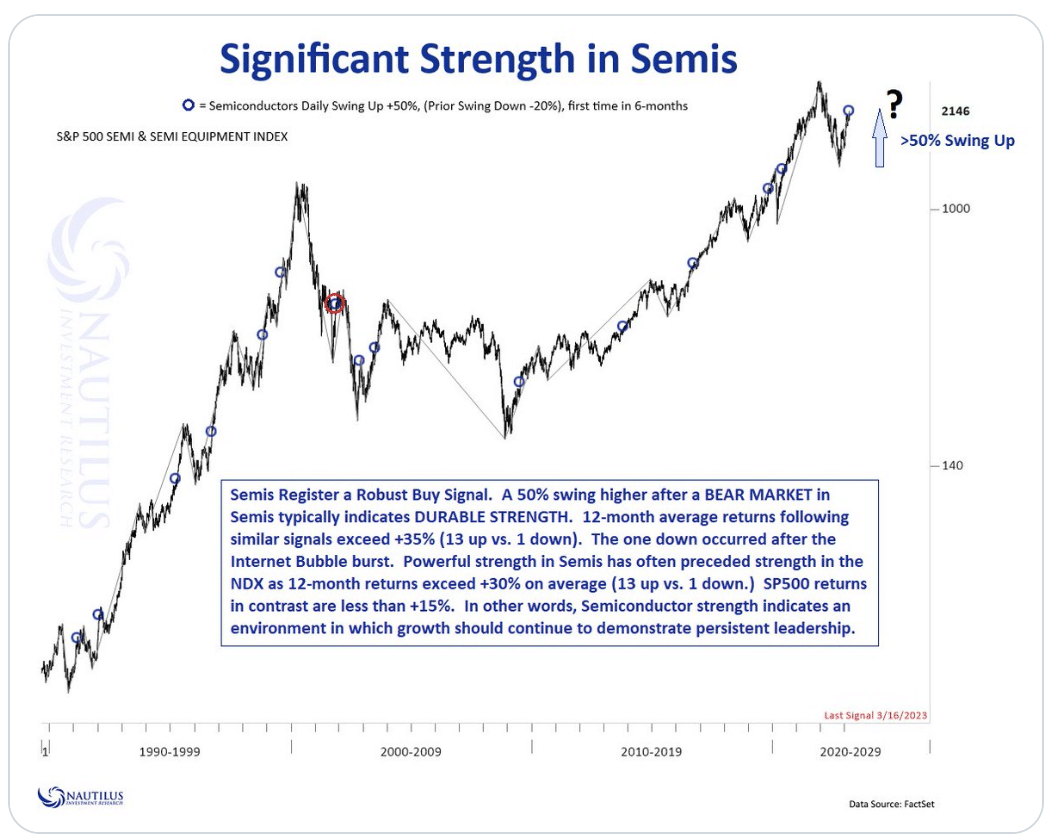
Heavy Semi Quant
Is the rally in Semiconductors “long in the tooth”, as the saying goes?Probably so in the near-term and probably not longer-term. How do we know? Read the below quantitative outline from Nautilus Research, which informs of 50% upswings in the Semiconductor ETF (SMH), after a bear market. The last time this 50% signal triggered was March of 2023. Semiconductors would go on to gain another +75% over the forward 12-month period.
Direct quote from Finom Group’s “Recognition of Probabilities In 2H 2025″ Report (June 29, 2025):
The following quant is a reference point for the final 6 months of the calendar year returns. It doesn’t speak as strongly for July, but more importantly it does speak to exogeny and the current White House Administration (only negative 6-month return under former Trump 1.0 in 2018). As Ryan Detrick of Carson Research’s quant outlines below…
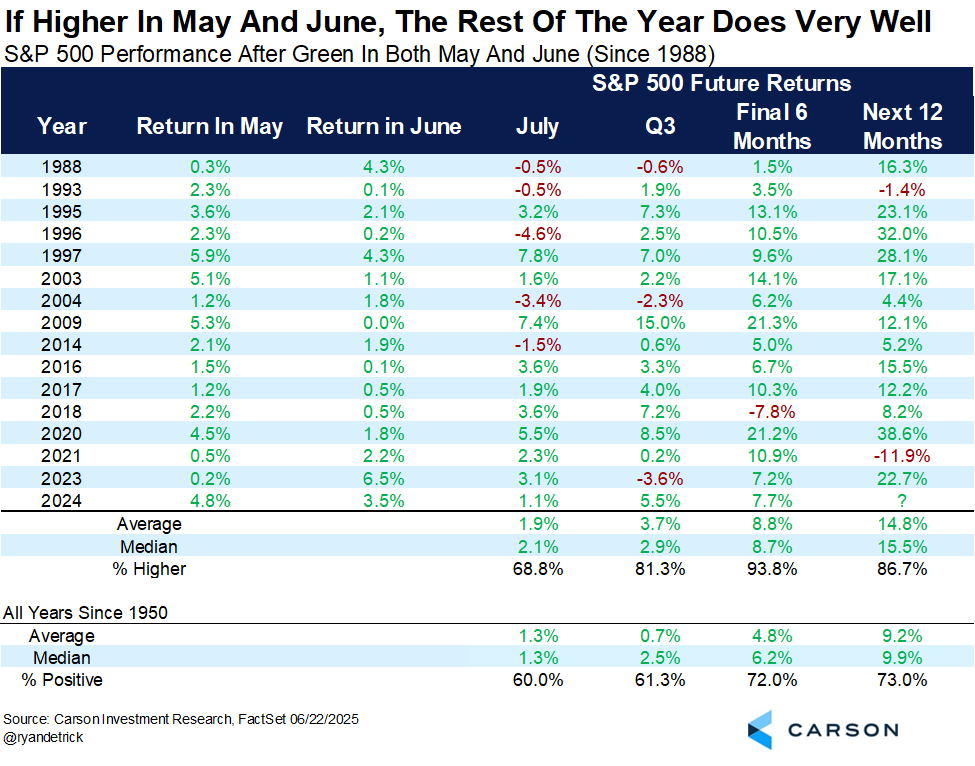
…“Up in May and June? This is a rare, yet bullish clue. The rest of the year is higher 15 out of 16 times and up nearly +10% on average.” Earlier in 2025 I had spoken and evidenced the muted potential returns for the S&P 500 in 2025. Price cyclicality only maintained a double-digit return potential from a Year 5 of a Decennial Cycle, while most other Price cyclicality measures offered 5% or lesser gains in 2025.

Direct quote from Finom Group’s “Recognition of Probabilities In 2H 2025″ Report (June 29, 2025):
With the first half of the year in the rear view mirror now, the market has newly demonstrated breadth thrusts and trending price action that has the potential to deliver double-digit returns for the calendar year. Such an outcome may still demand resolving the trade conflicts more amicably and a passage of tax legislation, but savvy investors who are following the quants and price trend data are favorably recognizing the new uptrend and its potential. Not a prediction, but recognition ✅. With this more positive sentiment arriving at 1H 2025’s end, I’ll also remind Finom Group investors/traders of our proprietary quant from this past Valentine’s Day. Again, you may have discarded this as it dovetailed into a technical bear market, but here it is again:

This quant takes care of the December Low Indicator and the Valentine’s Day Indicator. Taken separately they cancel each other out, but taken together they produce a PERFECT DOUBLE-DIGIT outcome for the S&P 500 by year-end 2025. Again, this is why we don’t discard quants! While this year’s occurrence is just the 6th of its kind, rendering the sample size small and potentially unreliable, we maintain the quant for building the case of potential double-digit returns in 2025.
Direct quote from Finom Group’s “Mindful Market Perspectives Into 2H 2025” Report (July 3, 2025):
Utilities vs NASDAQ: Believe it or not, they’re neck-and-neck through time
One of the easiest methods for building wealth has historically been the power of compounding dividends. Compounding dividends is boring as all get out, but it’s been highly successful through time.
In fact, compounding dividend income has been so successful, that the Dow Jones Utilities Index’s returns have been roughly neck-and-neck with NASDAQ returns since NASDAQ’s inception in 1971!
Chart 1 shows the compound total return of the Dow Jones Utility Index versus that of the NASDAQ Composite since NASDAQ’s origination in February 1971. Several points are worth noting:
-
NASDAQ surges ahead of DJ Utilities only during more speculative periods and bubbles.
-
Utilities have underperformed NASDAQ by less than 65bp/year even when including the current speculative Magnificent 7/AI period.
-
Because such a large proportion of return comes from dividends, Utilities have achieved their returns with considerably lower volatility and beta.
-
The DJ Utilities Index has a beta of only 0.5 to the NASDAQ during the 50+ year period, implying its risk-adjusted returns are superior to those of NASDAQ.

Table 1 breaks down the returns in Chart 1 by decade. Perhaps contrary to most investors’ current perceptions, Utilities outperformed NASDAQ during three decades and NASDAQ outperformed Utilities during three decades.
The table includes the Dow Jones US Dividend Index during the last three decades when it existed. This index is a broader representation of dividend-paying companies than simply utilities, and paints an even more appealing view of dividend-paying companies because it outperforms utilities during all three decades.

Direct quote from Finom Group’s “Mindful Market Perspectives Into 2H 2025” Report (July 3, 2025):
Investors currently want beta not yield
As we’ve pointed out many times, investors’ current appetite for beta risk seem insatiable. Whereas they were extremely hesitant to take any market risk at the beginning of the bull market, today (16 years later) they apparently can’t take enough.
Chart 2 (courtesy of Michael Harnett at BofA Securities) is one we’ve published many times, and shows the beta of the major holdings in private clients’ portfolios. Regardless of whether one examined the top 10 or top 20 holdings, private client equity beta was roughly 0.75 at the beginning of the bull market. Today, the beta of their top 10 holdings is an eye-popping 1.5! Even the beta of the top 20 remains near historic highs.
Throughout the early portion of the 2010s, investors had interest only in “large cap high quality dividend-paying stocks”, because those stocks’ dividends and low betas were considered safer. Today, it seems as though investors are shunning dividends and are willing to take enormous beta risk.

A bird in the hand…
Investors tend to be out of step with the markets. At the beginning of a bull market when momentum and beta strategies are by definition most rewarded, investors’ fears leads them to emphasize dividends and lower-beta equities. In later-cycle periods when dividends and lower beta become more attractive, investors’ confidence leads them to risk-taking and momentum investing.
We have no idea when the bull market will end, and are not suggesting market-timing. However, we clearly are not at the beginning of a bull market and, as we’ve previously written, the profits cycle is starting to decelerate.
The combination of a late-cycle market and decelerating corporate profits suggests a bird in the hand might be worth two in the bush.
Direct quote from Finom Group’s “Mindful Market Perspectives Into 2H 2025” Report (July 3, 2025):
Introducing the Cash/Confidence Ratio
Chart 3 illustrates the cash/confidence ratio which is essentially chart 2 (cash holdings) divided by chart 1 (confidence). Currently, this ratio at 0.0113 is at the fourth highest peak level and is higher than 97.2% of the time since 1952. Investors are scared and loaded, and this should be very encouraging for stock investors!
 |
Many currently suggest stock investors should be cautious. Valuation is high, aggregate investment exposure is pronounced, there are concerns about pending inflation due to tariffs, the Federal Reserve suggests it can be patient in holding interest rates and yields at relatively high levels, economic growth has slowed and may slow even further, and a recession and an earnings collapse are still possible. Moreover, the S&P 500 has already risen by almost 75% during this bull market and has surged by almost 25% just since April 8th. Several analysts and strategists make a compelling case that stock investors should proceed with caution.
However, there is an elephant in the room and it’s a big one! Chart 3 demonstrates that investors can currently buy the U.S. stock market with a backdrop or character which is very similar to what existed at the bear market lows of 1974, 1980, 1982, 1991, 2009, 2020 and 2022. Certainly not all characteristics today are consistent with past bear market lows, but two important criterion which drive the initial stages of most bull markets – pessimism and excessive dry buying powder – are evident.
Although I worry about many of the same issues bearish strategists highlight today, my guess is the big elephant in the room – the ability to buy stocks when attitudes are extremely pessimistic and when substantial idle buying power is sitting on the sidelines – is too compelling to ignore. Current risks associated with valuation, inflation, recession, Fed tightening, Trump tariffs, and geo-political conflicts notwithstanding, as chart 3 demonstrates, the opportunity to buy stocks when everyone is scared about the future and have stockpiled cash cannot be ignored.
The Performance Power of the Cash/Confidence Ratio
Chart 4 illustrates how historically powerful a high cash/confidence ratio has been since 1952. It records the average annualized quarterly S&P 500 total return performance since 1952 for all quarters when the cash/confidence ratio declined compared to how the S&P 500 performed when this ratio rose. For all quarters since 1952 when the cash/confidence ratio declined the S&P 500 average annualized total return was a stunning 26.4% compared to an average annualized S&P 500 total return of -0.31% for all quarters when the cash/confidence ratio rose.
 |
Moreover, during quarters when the ratio declined, the annualized standard deviation of S&P 500 quarterly total returns was only 12.6% compared to 16.9% when the ratio rose. Perhaps most astounding, for all quarters since 1952 when the cash/confidence ratio declined, the S&P 500 suffered negative quarterly total returns only 13.7% of the time, whereas for all quarters when this ratio rose, the S&P 500 suffered a negative quarterly total return 45.9% of the time.
The cash/confidence ratio is currently higher than 97.2% of the time since 1952. Isn’t the cash/confidence ratio much more likely to fall rather than ruse in the coming year?
Direct quote from Finom Group’s “Are Markets Going To Smell Like Fresh Cut Grass Soon?” Report (July 6, 2025):
A Couple Of Reminders
I don’t know precisely when and from what level the market will pullback and consolidate the recent leg of the rally to new all-time highs, I just need the data to inform of how I should behave when it does. If no recession on the horizon and within our June 15th Research Report:
“In other words, the U.S. economy has expressed above average GDP for many quarters since mid-2022, and is only now expressing subdued GDP and with slowing job growth to boot. Given the aforementioned assessments, we hesitate to characterize the economy as “weakening” and rather recognize the more appropriate step function in the rate of change as softening. A recession still appears a lesser probability outcome through at least October 2025, and open to reassessment mid-Q3 2025 absent exogenous impact/s.”

“…What I also find interesting about the price action, is that no recession took place 12-months forward. Only one signal was within the midst of an ongoing recession (2008), a condition not present today…”
As we continue to track the macro-economic fundamentals week-after-week, recall the following from our June 29th macro-market Research Report, as follows:
“To-date, there is a goodly amount of data/evidence to suggest the economy has softened in Q2 2025, but we don’t have enough evidence to suggest it has weakened, is weak, or is signaling a recession. Additionally and as mentioned previously, the stock market has been proclaiming the same analysis by way of its full technical bear market recovery to new highs over the last couple of months. All-time highs at the index level, at the Advance/Decline Line level, and at least from the economically sensitive Industrial sector do not promote the idea of a threatening recession. “

Moreover, and to reiterate, the stock market doesn’t generally offer a recession near-term and after all-time highs are achieved. The question we have often asked ourselves and given the weight of the evidence from the stock market and surrounding market breadth is, “Can the market really be this wrong?”
Direct quote from Finom Group’s “Are Markets Going To Smell Like Fresh Cut Grass Soon?” Report (July 6, 2025):
There’s a bit of parabolic price action that has developed into index all-time highs that is unusual and USUALLY results in price consolidation soon enough. If it doesn’t this week, good-fine-great; more profit taking. If it does, good-fine-great; cheaper prices. That’s the savvy investor mindset voiding FOMO and having enjoyed and/or benefited from the markets’ Mojo!
The combined Zweig and deGraaf Breadth Thrusts also remind that downside or price consolidation should stay limited to less than -10%, when we do the math and as recognized in the UPDATED commentary 😉.
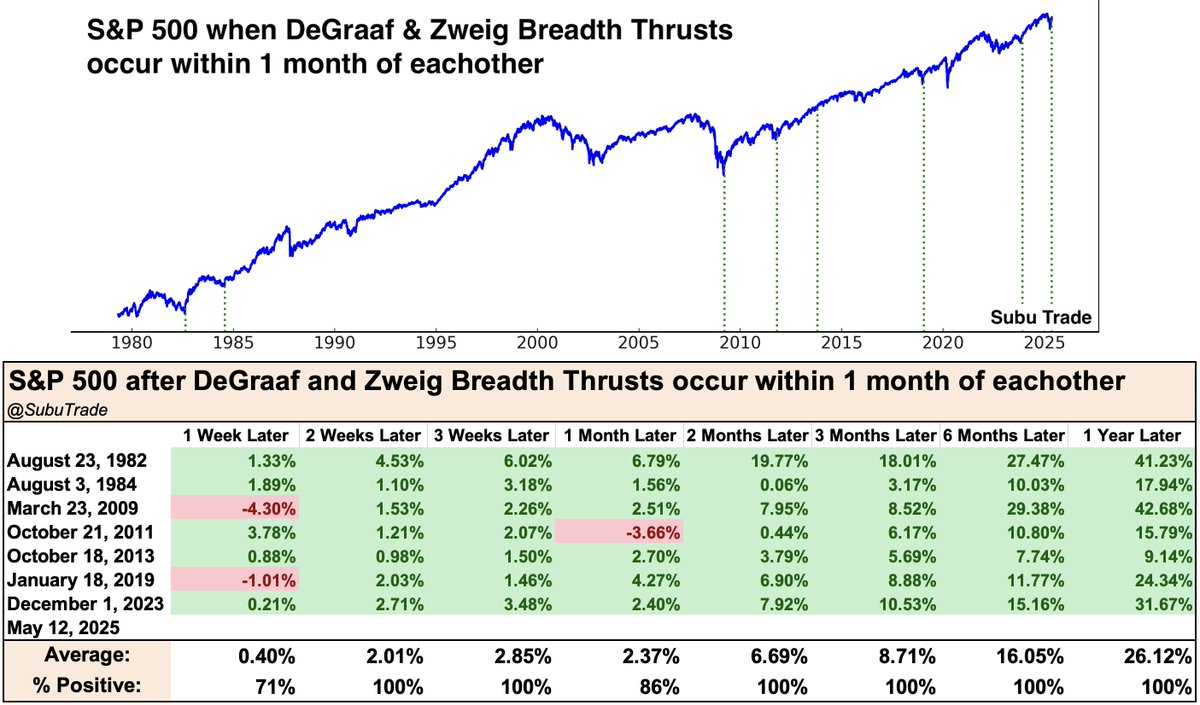
As of May 12, 2025, both a deGraaf and Zweig Breadth Thrust were triggered during the market recovery cycle. One-month forward from the signal date and price, indeed, the S&P 500 delivered a positive return as of this past week and by finishing above the signal date price of 5,844 by Friday’s closing bell. In suggesting the downside could prove limited, the combined breadth thrust study here has a 100% positivity rate 2-months forward from the signal date, offering a 6.7% average return to boot. We’ll know more over the coming trading days whether or not this combined breadth thrust study will remain perfect.
Moreover and in looking at this combined quant study, it doesn’t speak to lower prices surviving 6-months forward, which takes the markets through year-end. The signal date price of 5,844 is ~7% below this past Friday’s closing price (6,279). Again, this is the best consideration as to how investors should perceive and behave when cheaper prices are presented between now and year-end. It’s always a matter of commitment. Taking advantage of cheaper prices near-term by adding equity exposure may also demand taking a bigger near-term drawdown. It takes a commitment to that potential outcome, knowing the inevitable compounding returns to follow.
Direct quote from Finom Group’s “Are Markets Going To Smell Like Fresh Cut Grass Soon?” Report (July 6, 2025):
Alright, let’s get old school in this report and as part of reviewing relevant quants! By old school I’m referring to the quant below, outlined in February of 2025. So not so old school, but you get the point and as we had formerly revisited inside our May 18th macro-market Research Report. As another reminder, this is a reason our weekly Research Reports are essential parts of the due diligence process. Nowadays, data can be found widely accessible, but sequencing and tracking the data is a self-driven process, something we spirit inside our weekly analytics.

So what are we reviewing here in the study above (Steve Deppe)? What should first jump out at you is the white space and very little red shadings. White denoting positive returns and red denoting negative returns, so the more white and less red informs that the technical study holds highly probable higher prices to come. As Deppe informs,“January went into the books for the S&P 500 as a “Bullish Outside Reversal Month” (BORM), the 8th such time January has finished this way since inception. Forward 8-12-month returns following the prior 7 January BORM’s have never closed lower.” Having said that, failures of rather high positivity rates since January’s-end have found many investors/traders discarding this and other quant studies. But we are going to be coming up on the 8-month return mark in just a few short months. On January 31, 2025, the S&P 500 closed at 6,040 and with an 8-month forward 100% positivity rate, an S&P 500 trading in the 5,900s this past week… like many of the former quants this one looks a lot more probable today than it had in March or early April. We would, once again, keep this front of mind 💯.
Sometimes my X posts seem more probable than not, depending on price and date. Sometimes a calendar can serve as a great visual aid as well! So let’s put forth the calendar visual aid, to reference in the future. While some 80 calendar days may seem like a distant future from today, that’s roughly 60 trading days.

I’m not doubtful that price can’t consolidate below this level indicated by the quant between now and September 2025’s-end, I’m simply suggesting the quant informs what to do if that proves to be the case.
Direct quote from Finom Group’s “Are Markets Going To Smell Like Fresh Cut Grass Soon?” Report (July 6, 2025):
Thus far, the quants reviewed cover aspects of calendar date price achievement, recovery price achievement, breadth achievement, and so let’s remind of trend achievement from a quant discipline.

“When the S&P 500 ends a 3-month losing streak by gaining 5%+ in month #4 (May), good things tend to happen in the following month. The S&P 500 is positive 1-month forward EVERY. SINGLE. TIME. and 100% of the time 10-12 months forward. Any intra-month (June) consolidation is a likely buying opportunity. Recall, price would need to finish June above 5,911 to remain with a 100% positivity rate. If price dips below 5,911 intra-month, it is a likely buying opportunity at the index level.”
While this quant outlines 1 negative return across the 2-9 month forward time periods, it remains a high probability that price finishes above 5,911 in each of the subsequent months and through year-end 2025. Again, dips below 5,911 can be achieved intra-month and during bouts of price consolidation. If that comes to pass, the savvy investor is buying that sub-5,911 price action.

The above quant from Wayne Whaley’s latest weekly scan is a good paring with the former trend quant from Steve Deppe. The quant reads and offers the following:
“You may recall that the S&P experienced an 18.9% selloff from the Feb 19th Close of 6144.15 to the April 8th Close of 4982.77, exceeding 20% if measured vs the April 8th intraday Low of 4910.42. From that 4982.77 Closing Low on April 8th, the S&P 500 has now advanced 26.0%, doing so in less than a Quarter, 86 calendar day (April8-July3) to be precise. Looking back through post 1950 history, I can only find five prior occasions in which the S&P 500 has advanced 25% in less than a Quarter and none of those five occasions were anywhere near an impending top. Certainly, one would prefer to have more than five data points from which to draw conclusions upon which to base one’s market exposure but the magnitude and uniformity of the advances across the following 12 months in those five cases appears worthy of our respect. All five cases were positive over the following 1 to 12 months, up at least 19.2% one year later, 31.7% on average. None of the five cases experienced a 4% drawdown as measured from the signal Date.”
Through Whaley’s quant, shallow pullbacks and higher-highs are the greatest probability. Indeed, the sample size is small, but not when paired with the former quant the build the bullish case both near and interim-term.
Since the quant triggered on July 3rd, the 2-month forward positivity rate is 100%, and considering August Republican Post-Election has never delivered a positive return… 6,279 is the singnal/date price. I’m of the opinion that if the White House Administration doesn’t lend endogenous headlines for the market to consider, the Whaley quant and price trend will overpower the August Post-Election quant performance.
Direct quote from Finom Group’s “Soft To NO Landing Bull Market In 2025” Report (July 13, 2025):
Technical and Quant Update/Review


Direct quote from Finom Group’s “Soft To NO Landing Bull Market In 2025” Report (July 13, 2025):
With leadership showing certain near-term cracks via relative performance and/or overextended price trends, a pullback was becoming inevitable. Let me also remind investors/traders that the pullback did not take place without new all-time highs and/or another breadth thrust being triggered this past week, both of which inform investors should be willing buyers of any additional pullbacks, despite headline risk.

As articulated inside the Finom Group Trading Room with Premium members over the last few weeks and via my X account:
“A significant BULLISH signal triggered Thurs. The NYSE Summation Index achieving 900+. Deemed broadest measure of market breadth momentum, with 91% 6-month and 96% 12-month positivity rates. Positivity rates across all time periods above average.” (Chart depicts prior 4 signals, all positive)
Direct quote from Finom Group’s “Soft To NO Landing Bull Market In 2025” Report (July 13, 2025):
Many Finom Group members will recall our proprietary quant from late 2023, which signaled double-digit gains over the forward 12-month period i.e. 2024. The self-titled Golden Bull is a composite quant, consisting of a Zweig and deGraaf Breadth Thrust, NYSE Summation Index > 900, and % of S&P 500 trading above their 50-DMA of 90%.
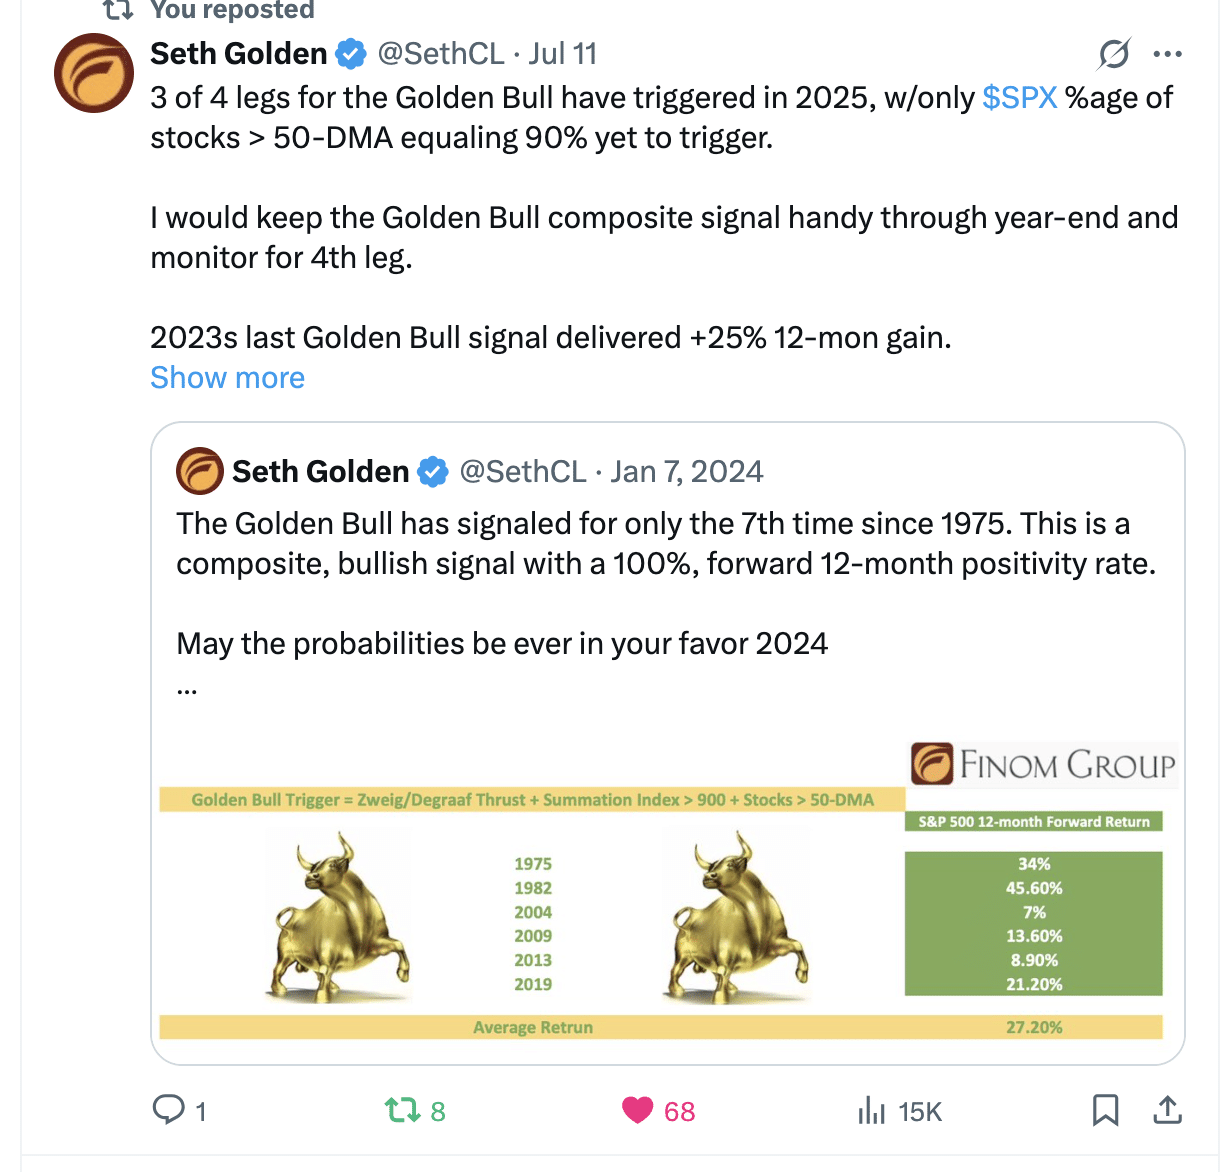
As detailed in the most recent X quoted post above, 3 of the 4 legs of the Golden Bull are now in place with the latest NYSE Summation Index achievement. All that remains is for the market to 90% of S&P 500 stocks above their 50-DMA. No guarantees it occurs, but if it does, 2026 could look better than most Midterm Election years.
Finom Group members should add this signal to the litany of other signals updated and newly outlined from the prior weekend’s macro-market Research Reported and linked. Remember, all your answers to the market outlook probabilities are intrinsic to our macro-market Research Reports, your weekly cheat-sheet, if you will!
Direct quote from Finom Group’s “Soft To NO Landing Bull Market In 2025” Report (July 13, 2025):
Lastly, but certainly not least, the following quant from Nautilus Research recognizes the abbreviated time period for which the S&P 500 and Nasdaq have achieved their recovery and new all-time highs:

- The S&P 500 gained 25% after falling at least 15%
- Bullish trigger 7/3/2025 and price 6,279
- 6-months forward SPX has never been lower i.e. 100% positivity rate.
- Average return from signal date = +8.17%
- If achieved, SPX would = 6,791

Direct quote from Finom Group’s “Soft To NO Landing Bull Market In 2025” Report (July 13, 2025):
Something that we reminded Finom Group members about, also inside the Trading Room over the last couple of weeks and from within the Finom Group 2025 Outlook Report linked:
“On behalf of Finom Group, thank you for reading 2024’s Year-end 2024/Outlook 2025 macro-market Research Report. And since you’ve made it this far, let’s end with a “probable” high note 🎶.With investing, anything is possible, which helps no investor. We aim to better understand the probabilities as savvy investors. One probability we should dismiss centers on the soft landing already achieved by markets, the economy, and with the assistance of the Federal Reserve. All criterion for a soft landing have been satisfied as of November 2024.

In the chart above, the yellow shaded bars signal prior historical soft landing achievements. I would add to this chart the 2018/2019 period, but for the sake of Covid in 2020 derailed the soft landing outcome.What becomes interesting for investors, and considering 2025 is better understood with the following charts of the S&P 500.
The first S&P 500 chart below is that from the first rate cuts from September through December of 1984. The cuts came on the heels of a series of rate hikes in the 1H part of the year.
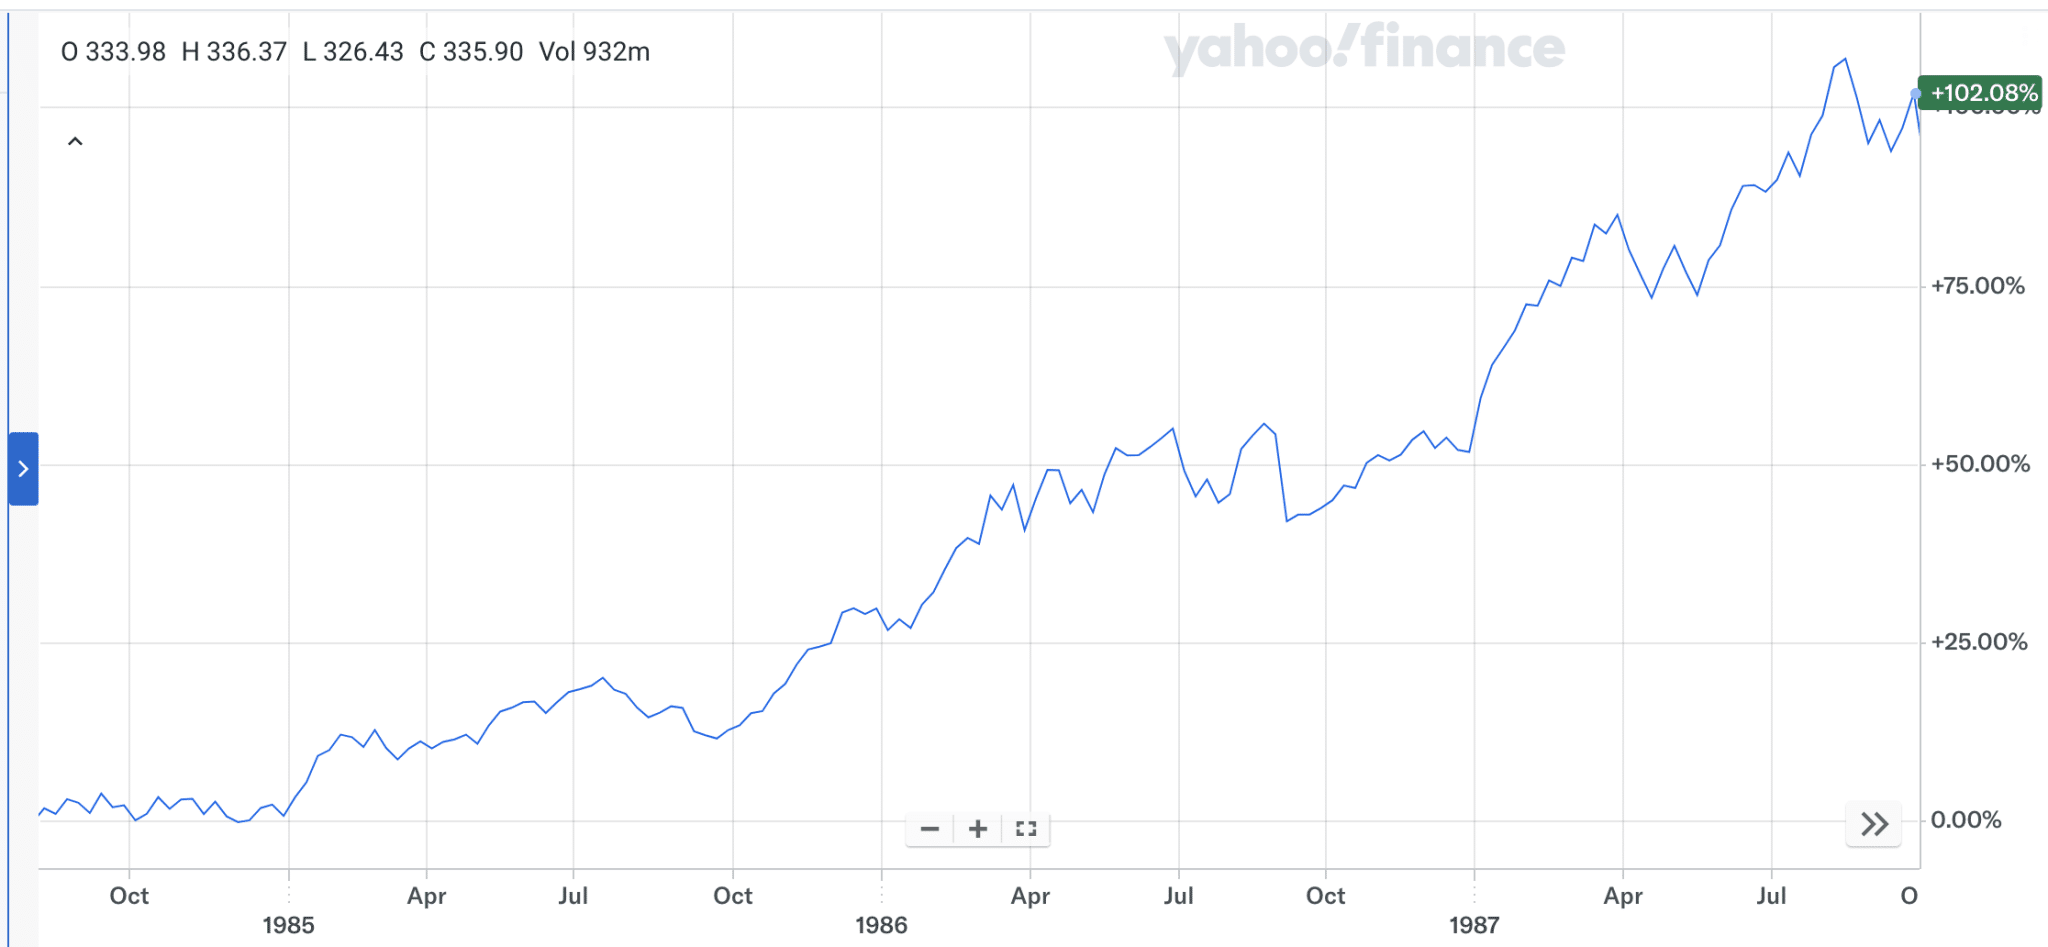
Notice what happened after the Fed began cutting rates? A soft landing was achieved in 1984, and the stock market would rally nearly 100% over the next 3-year period. Now let’s go on to see how the 1994-forward soft landing S&P 500 performed, shall we?
In 1994 through most of 1995, the Fed finalized its rate hiking campaign and would pause any rate action until the very end of 1995, when it lowered rates 25bps. The soft landing or no landing was achieved and certifiable thereafter, as no recession wold come to pass until 2001.

The Fed would essentially hold rates “higher for longer”, around 5% over the next couple of years while the markets gain another 100%+ from the end of 1994 through 1997.
Indeed, there was a soft landing from 1965 through 1967 that didn’t express the 100%+ returns over a 3-year period like that of the 1980s and 1990s example. I’m not dismissing this fact, I’m simply exampling the most recent occurrences and suggesting that soft/no landing scenarios can throw a “monkey wrench” into the equation and as it pertains to Year 3 of the bull market that would be 2025. Remaining optimistic and “keeping it 100%”, as the kids say! Stay tuned, stay informed, and stay with the markets investors/traders!
Are we all caught up now?
Direct quote from Finom Group’s “A Captivating Trend Through Year-End” Report (July 20, 2025):
Let’s not be in the business of looking a “gift-horse in the mouth”, so to speak. The market continues to outperform the expectations of the masses, failing to generate any meaningful or sustained pullback since the April 9th market low. Since then, the largest pullback has been a weekly -2.5% pullback a month ago now. Oddly enough, this is in-keeping with much of our analyzed data sets since several breadth thrusts triggered in April and May. We’ll get into the “pullback/correction” conversation just a bit more in a few minutes, but for now we take a bit of a victory lap from our PepsiCo investment idea/thesis. Recall the following from March 2, 2025:
“As shown in the holdings above, PepsiCo (PEP) is the most recent addition to the Portfolio, with long-term consideration. Since building this core position through four separate 1% for 1%+ scalp/swing trades, shares of PEP have risen some +6% while offering shareholders a healthy 3.5%+ annual dividend. Lastly, our XLV holding and re-investment idea initiated late in 2024 has also outperformed the market and is one of the best performing sector ETF’s year-to-date, which we believe still has much more upside, even if not in a straight line.”

Unfortunately, our steadfast investment thesis for Health Care (XLV) still has yet to positively materialize, but with this past week’s release of PepsiCo’s quarterly results, our investment in the beverage/snack company is expressing strong returns on capital invested. With Thursday’s $10/share surge in shares of PEP, I locked in some profits on the investment and will await an opportunity to recapture shares should cheaper prices be presented, as is my current outlook. I’m doubtful PEP shares will travel higher in a straight line hence forth. A collage of all PEP year-to-date trade ideas completed is presented below, and since being disseminated to Finom Group Premium members:
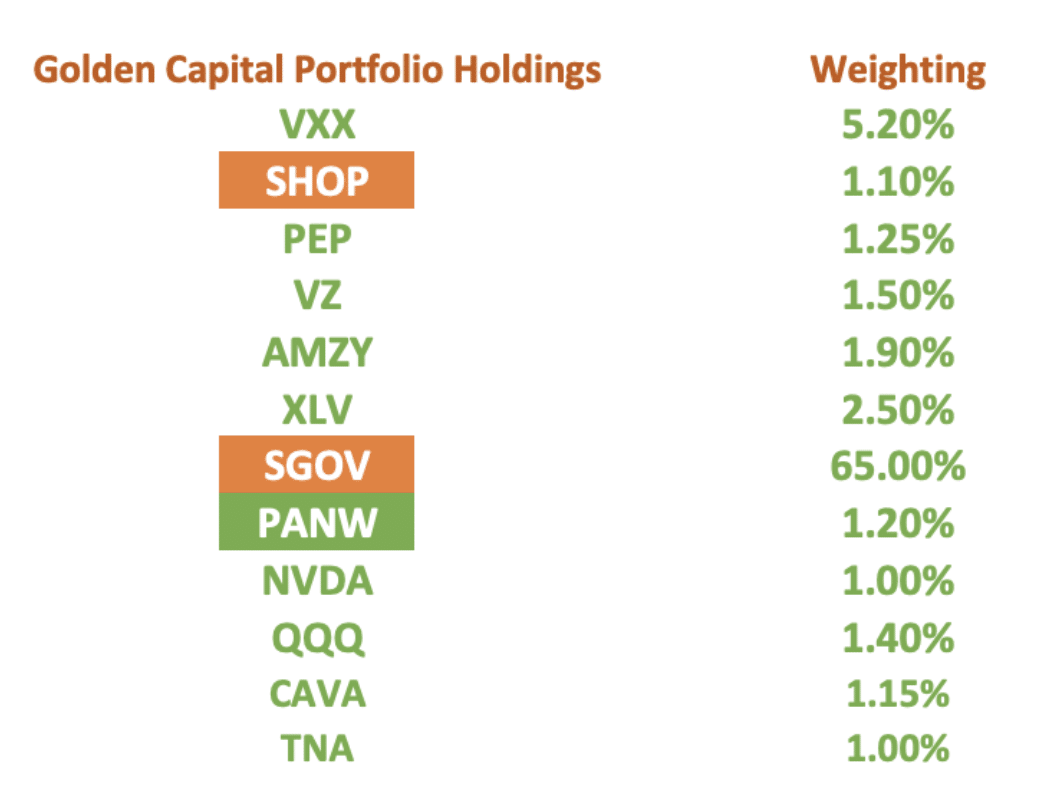
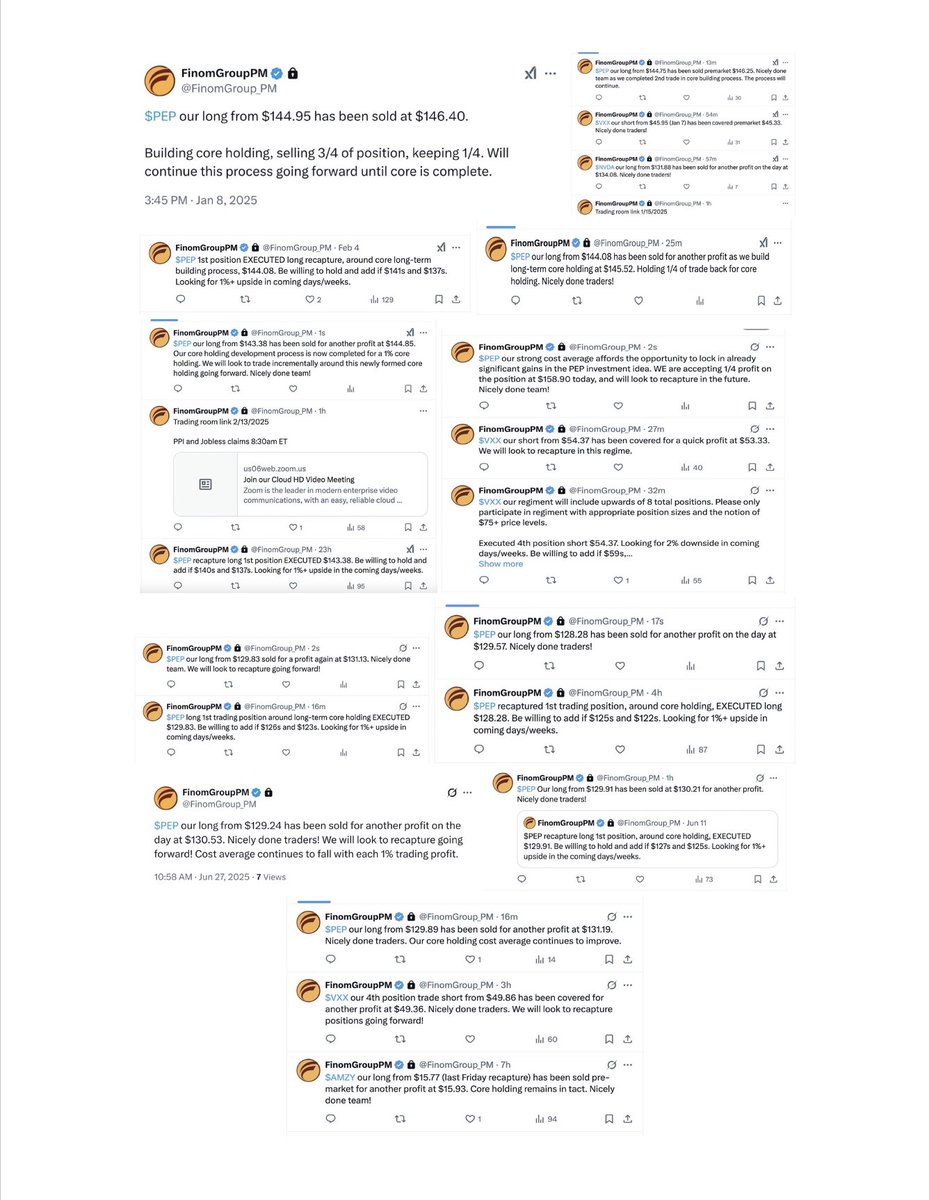
The Golden Capital Portfolio holdings have not changed over the 1H 2025 period, only the Weightings, which will be updated after the quarterly filing period. Most weightings are accurate shy of a now reduced weighting in NVDA, VXX, PEP, QQQ and increased weightings in CAVA, AMZY, and SHOP. Weighting changes are no more than .25% for any given position.
To round out this update on positioning and PEP, yes, it is perfectly acceptable to take your wins and pat yourself on the back, as an investor. Markets offer plenty of opportunity to beat oneself up for shortcomings and even losses, so take the wins and give yourself credit when the credit is due. This has nothing to do with lacking humility or expressing hubris, but rather level-setting the Emotional Quotient and/or balancing investor/trader heuristics. Take the win, pat yourself on the back, and patiently await such an opportunity to do so with Health Care 😉!
Direct quote from Finom Group’s “A Captivating Trend Through Year-End” Report (July 20, 2025):
The Pullback Potential
As outlined in the Finom Group 2025 Outlook Report titled “Soft Landing: Keeping It 100%“, we used the following annual drawdown tracking quant to quantify and qualify the probability of a double-digit 1H 2025 correction, and so it came to pass. This was not the only rationale for such an expectation/outlook, but it proved a significant piece of the puzzle and may serve a similar purpose going forward.

“While there was a 10% textbook drawdown in 2023, that has been absent the 2024 bull market. What the table doesn’t clearly identify without a little more digging, is that back-2-back years WITHOUT a 10% correction are rare, far and few between. So if you’re planning for 2025’s probabilities, there is a reasonably low probability that 2025 won’t deliver a full 10% correction, unlike 2024.”
The reason I (Seth Golden) ask investors/traders to reconsider this quant of annual drawdowns is to opine over whether or not the remainder of 2025 offers much in the way of SIGNIFICANT PULLBACKS⁉️ We already considered that July should prove another positive monthly return for investors, by way of many quants and seasonal data previously outlined.
Direct quote from Finom Group’s “A Captivating Trend Through Year-End” Report (July 20, 2025):
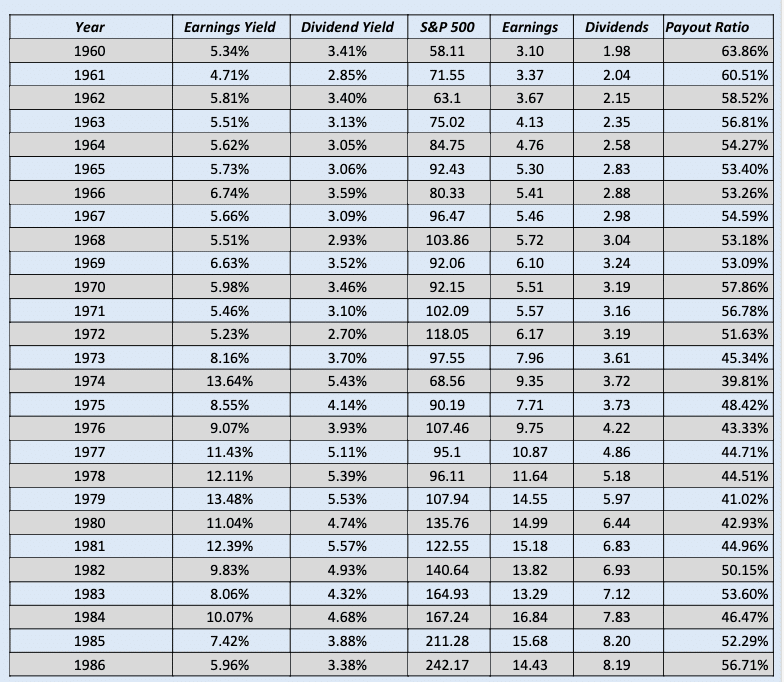
Reconsidering the annual drawdown chart, draw your attention to calendar years 1995 and 2017. Scroll up, double check and confirm that both generated minimal 3% annual Max drawdowns on a closing basis. What made these two years so unique to all other calendar years since 1980 is that in both 1995 and 2017 the analysts and strategists simply could not catch-up to forward Earnings Per Share results. In 1995 the market was coming out of a negative return year with bouts of volatility in 1994 and in 2017 the market was coming through an election year, Brexit and tons of uncertainty related to the Chinese economic situation. In 1995, S&P 500 also produced a Zweig Breadth Thrust, and never looked back. There are a lot of similarities between what the market is recovering from in 2025 as it pertains to the prior years with minimal drawdowns, and why there is a reasonable and probable means for which to consider the remainder of 2025 might produce minimal drawdowns/pullbacks. And when we consider that 2017 was Year 1 of the first Trump presidency like 2025…
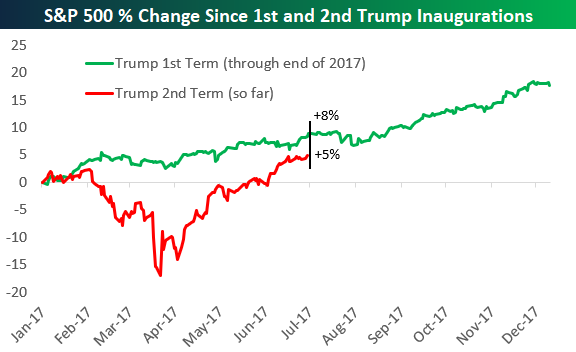
Trump’s 2025 Presidential term began NOTHING like his first, when looking at it through the lens of the S&P 500 price trend. As of July 2025, however, the price trends are now more aligned, much like the cadence of his 1st term’s policy implementation. While the tariff implementations came first this go around, many of those tariffs were put on hold and have been on hold until August 1, 2025. This allowed for the Trump 2nd Term playbook to offer tax legislation prior to full tariff deployments akin to 2017.
Direct quote from Finom Group’s “A Captivating Trend Through Year-End” Report (July 20, 2025):
Given the similarities in fiscal policy deployment as of July 2025 we can better understand why the S&P 500’s recovery has proven so fiercely V-shaped and without meaningful pullbacks, keeping in mind that Earnings Breadth Revisions have performed the SAME V-shaped recovery:
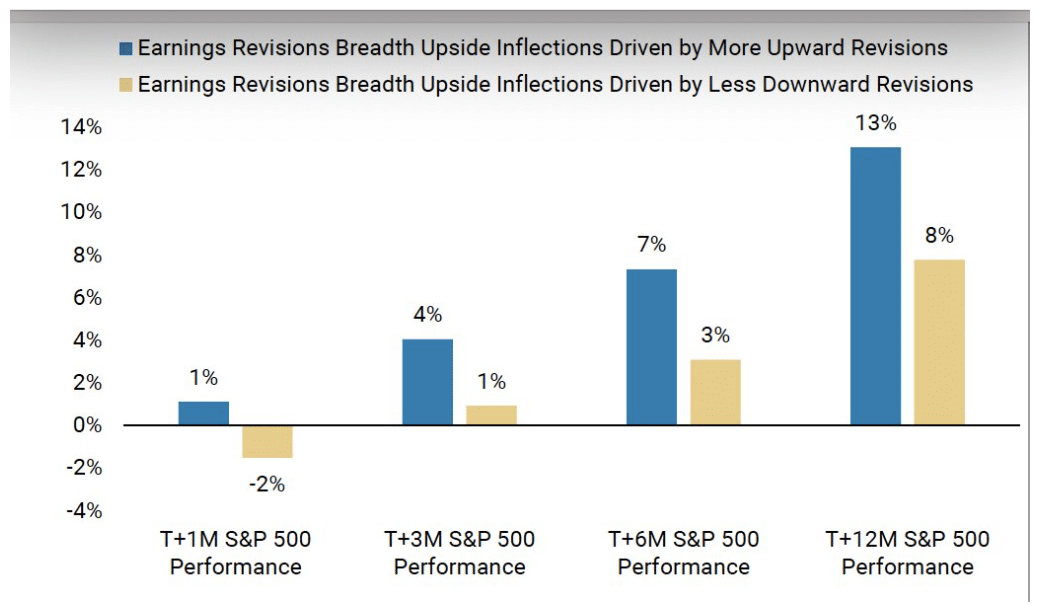

Just a week ago, the Earnings Revisions Breadth trend line was beneath the zero-bound level (chart above). What now happens to the markets if the trend line rallies above the peaks from 2023 and 2024? Remember, in 1995 and 2017 the analysts and strategists simply couldn’t keep up with positively revising their EPS outlook. In the following tables, we recognize the massive Y/Y jump in Operating Earnings from 1994 to 1995 and 2016 to 2017 (highlighted):
I don’t desire to suggest that the similarities between 1995, 2017, and 2025’s seemingly relentless efforts for analysts/strategists to catch back up to the former FY2025 EPS estimate will guarantee a -3% or less drawdown/pullback the rest of the year, but if we’re not considering the 4-year Presidential Cycle and the driving force of markets over time (earnings growth rate), then what are we doing, guesstimating ??
Direct quote from Finom Group’s “A Captivating Trend Through Year-End” Report (July 20, 2025):
The Analogues And Flows
Our recognition of Presidential Cycles and analogous price trends is a recognition of what I have trademarked as scheduled fund flows. As we tip past the mid-July time period, we understand that when viewed through the Composite Cycle perspective, the forward Q3 time period tends to be quite choppy and lacking for an actual price trend:

Remember that the Composite Cycle representation is an average price trend for the year. 2025 has both deviated from the price trend, but re-established price trend with the Composite Cycle since April. The deviation has resulted in a lesser gain than the Composite Cycle year-to-date. This once again proves our base case that fund flows are scheduled and that we should keep such studies as part of our annual market expectations; it’s a guide, not a guarantee.
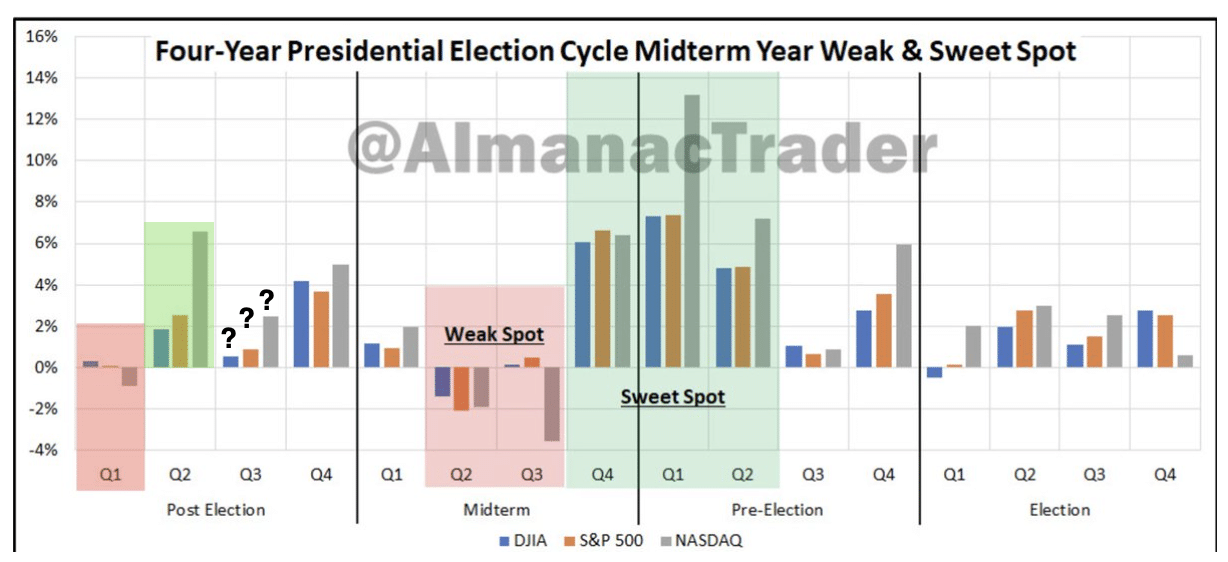
If we extrapolate the 4-Year Presidential Cycle from within the Cycle Composite 2025, this is what we get. On average, the Q3 Post Election year builds on Q2’s performance, but at a much slower rate of return with July’s return proving the worst and improvements rates of returns from there.
Direct quote from Finom Group’s “A Captivating Trend Through Year-End” Report (July 20, 2025):
And if the graphic above doesn’t clearly outline where fund flows and potential returns are for this time of the calendar year, the following chart helps to put it into perspective:
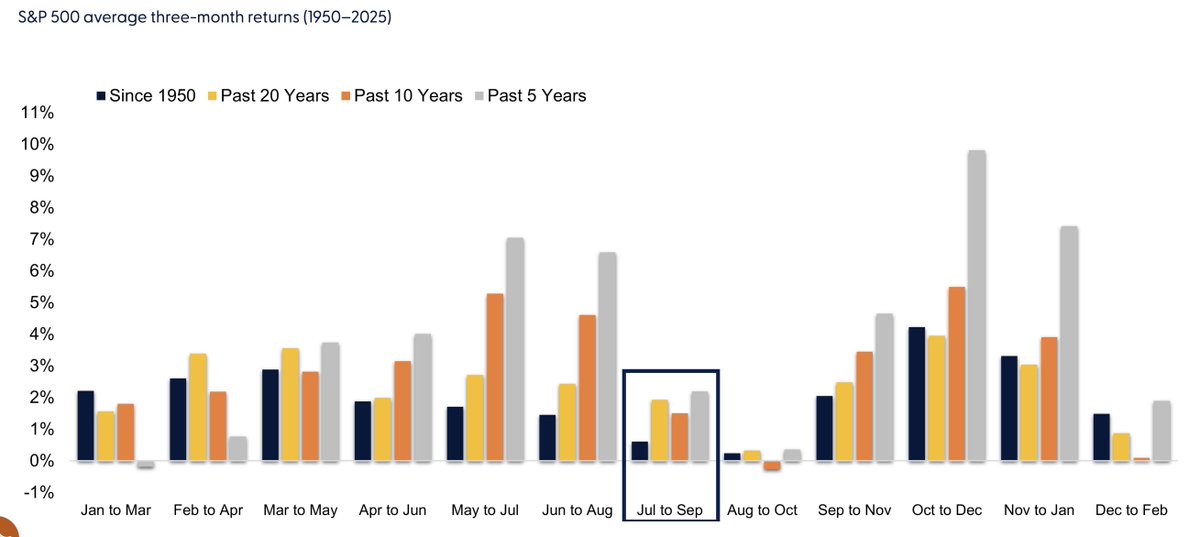
The July to September period has offered the 2nd worst returns for investors all the way back to 1950. Unfortunately, it is followed closely by the worst 3-month period for returns the August to October time period. The whole Sell in May and go Away never made too much sense. A potential better saying might be offered by “Sell in July but prepare to Buy.” Recall that in 2024, the market peaked exactly at this time of the year and before a drawdown of -9% took place. This is not to suggest a repeat of July 2024, as the fundamental (EPS) and quant backdrop don’t support such a drawdown, but rather to further validate the seasonally weaker fund flow period… also evidenced by the Goldman Sachs reminder below:
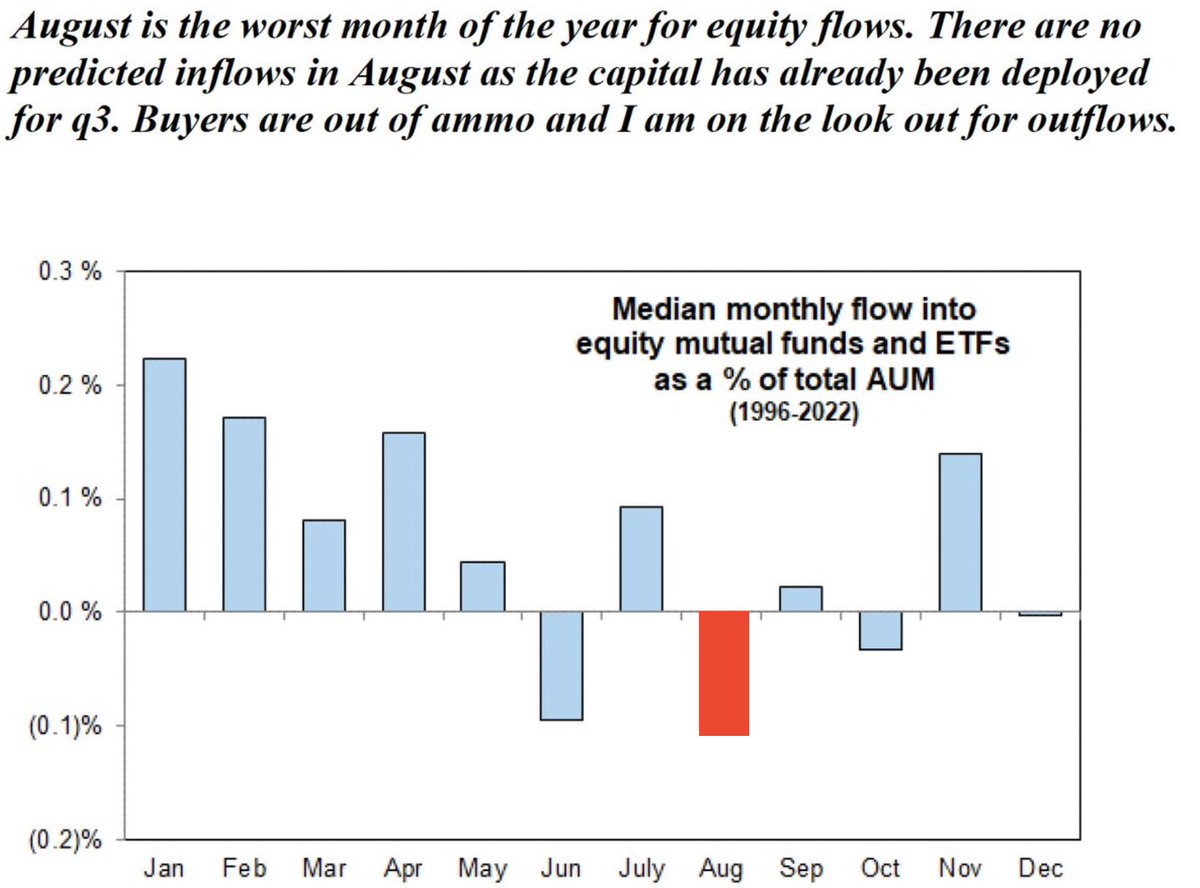
The monthly Fund Flow chart above is a simple reminder and validation concerning the time of year, so as to level-set expectations, nothing more and nothing less… and nothing is guaranteed. If the market, and due to a variety of inputs, decides to outperform the quants and seasonal fund flows, so be it, but pay attention as there is usually a message the market is trying to megaphone/send.
Direct quote from Finom Group’s “A Captivating Trend Through Year-End” Report (July 20, 2025):
Speaking of such a message and outperformance…

This past week was July monthly Op/EX week. The Nasdaq has finished in the red more often than not, since 1990, for the trading week. The Nasdaq outperformed this quant with a positive return during the July 2025 Op/EX week. The week after the July Op/EX has been a coin toss, so far as positivity rates with 18 ups and 17 down returns. Again, when the market outperforms the probabilities, pay attention!
Direct quote from Finom Group’s “A Captivating Trend Through Year-End” Report (July 20, 2025):
Last, but certainly not least with respect to the upcoming calendar period for fund flows we look at the S&P 500’s simple annual year average returns by month, since 1990. The following is not considering Post Election year or anything like that, just the average year’s monthly return performance. On average, the Summer months have provided investors with an opportunity to buy pullbacks, and that is the posture I take when reviewing the data.

The weight of the evidence still informs of higher-highs, if only by the end of the summer months. Our experience and the data suggests the Cycle Composite is the greatest analogue for which to consider the scheduled fund flows, and as such we anticipate a choppy period through the remainder of Q3, with a modest higher-high to be achieved by September 30, 2025. This expectation should also consider modestly higher inflation, which we anticipate monitoring by the White House Administration and within its pending tariff negotiation/s framework. Should inflation more meaningfully reflate in the coming months, we would have to anticipate a potentially larger, negative market response.

Direct quote from Finom Group’s “A Captivating Trend Through Year-End” Report (July 20, 2025):
For now, the indexes remained OVEREXTENDED, but not terribly overheated or overbought. The Nasdaq Composite is the only large-cap index that is overextended/overheated if we adjust the RSI parameter to a 5-Day reading (85). None of this denies any index the ability to consolidate price, but rather we recognize it as why the indices have respected and stayed above their 20-DMAs for so long now and without a significant pullback.
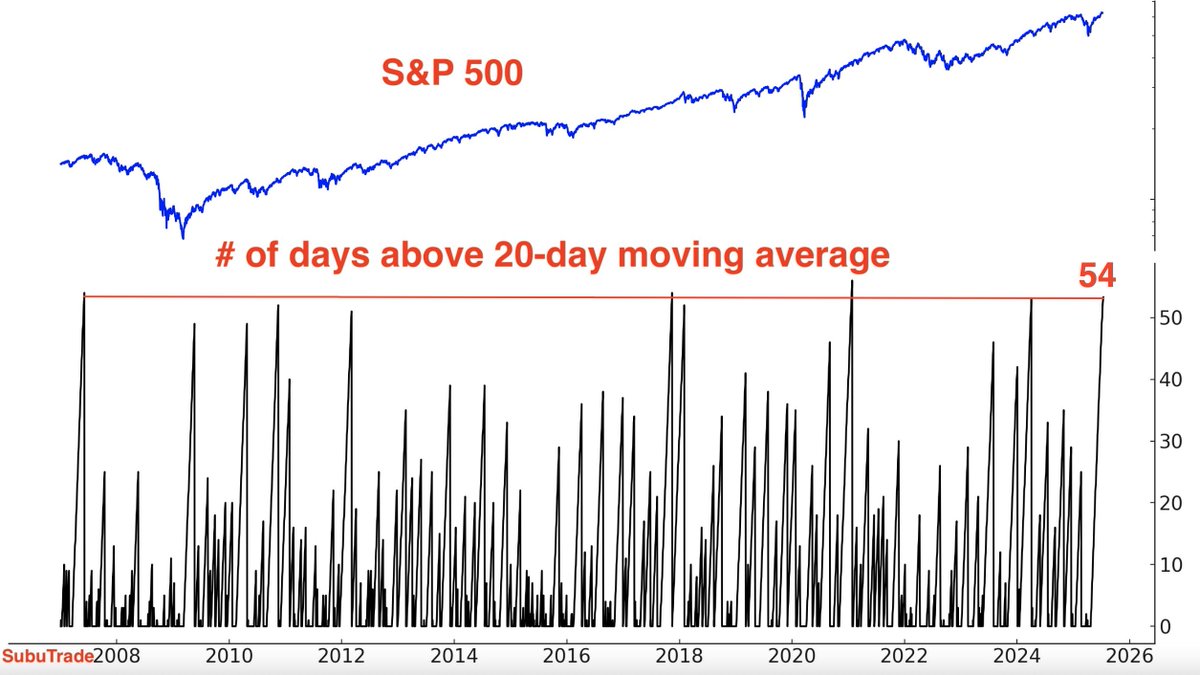
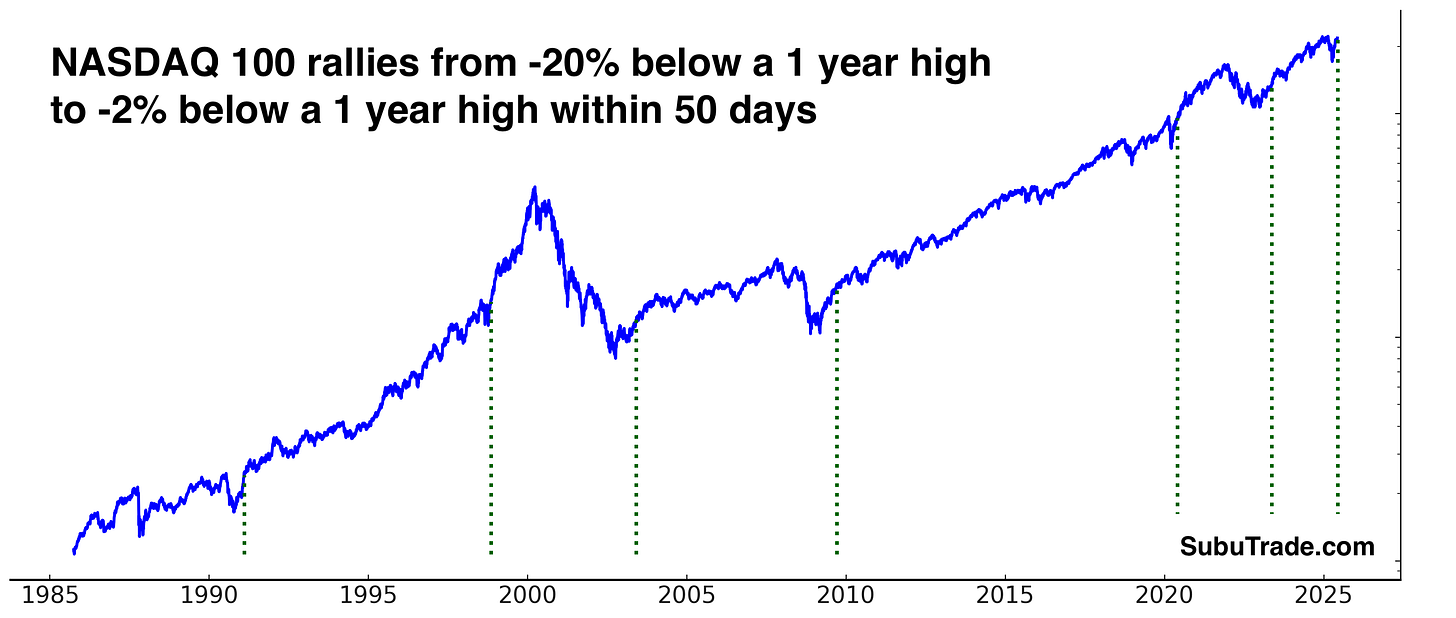
S&P 500 is now above its 20-DMA for 58 straight days (as of July 18, 2025). Even the hottest bull markets don’t find SPX maintaining such overextended conditions without a pullback below the moving average in short order. This is a bullish signal overall! Similar win streaks saw the benchmark index rise 93% of the time (per SentimenTrader) over the forward 3-month period (October 2025) and 100% of the time per Subu Trade. We’ll dig into the discrepancy between the two strategists’ data. It is like a result of starting dates as SentimenTrader goes back to pre-WWII era. Back to those divergences…😉

Direct quote from Finom Group’s “Use Volatiliity To Your Advantage; Don’t Fear It” Report (July 27, 2025):
…however, the 2009 -2014 vs. 2020 -2025 analogue is still in play:
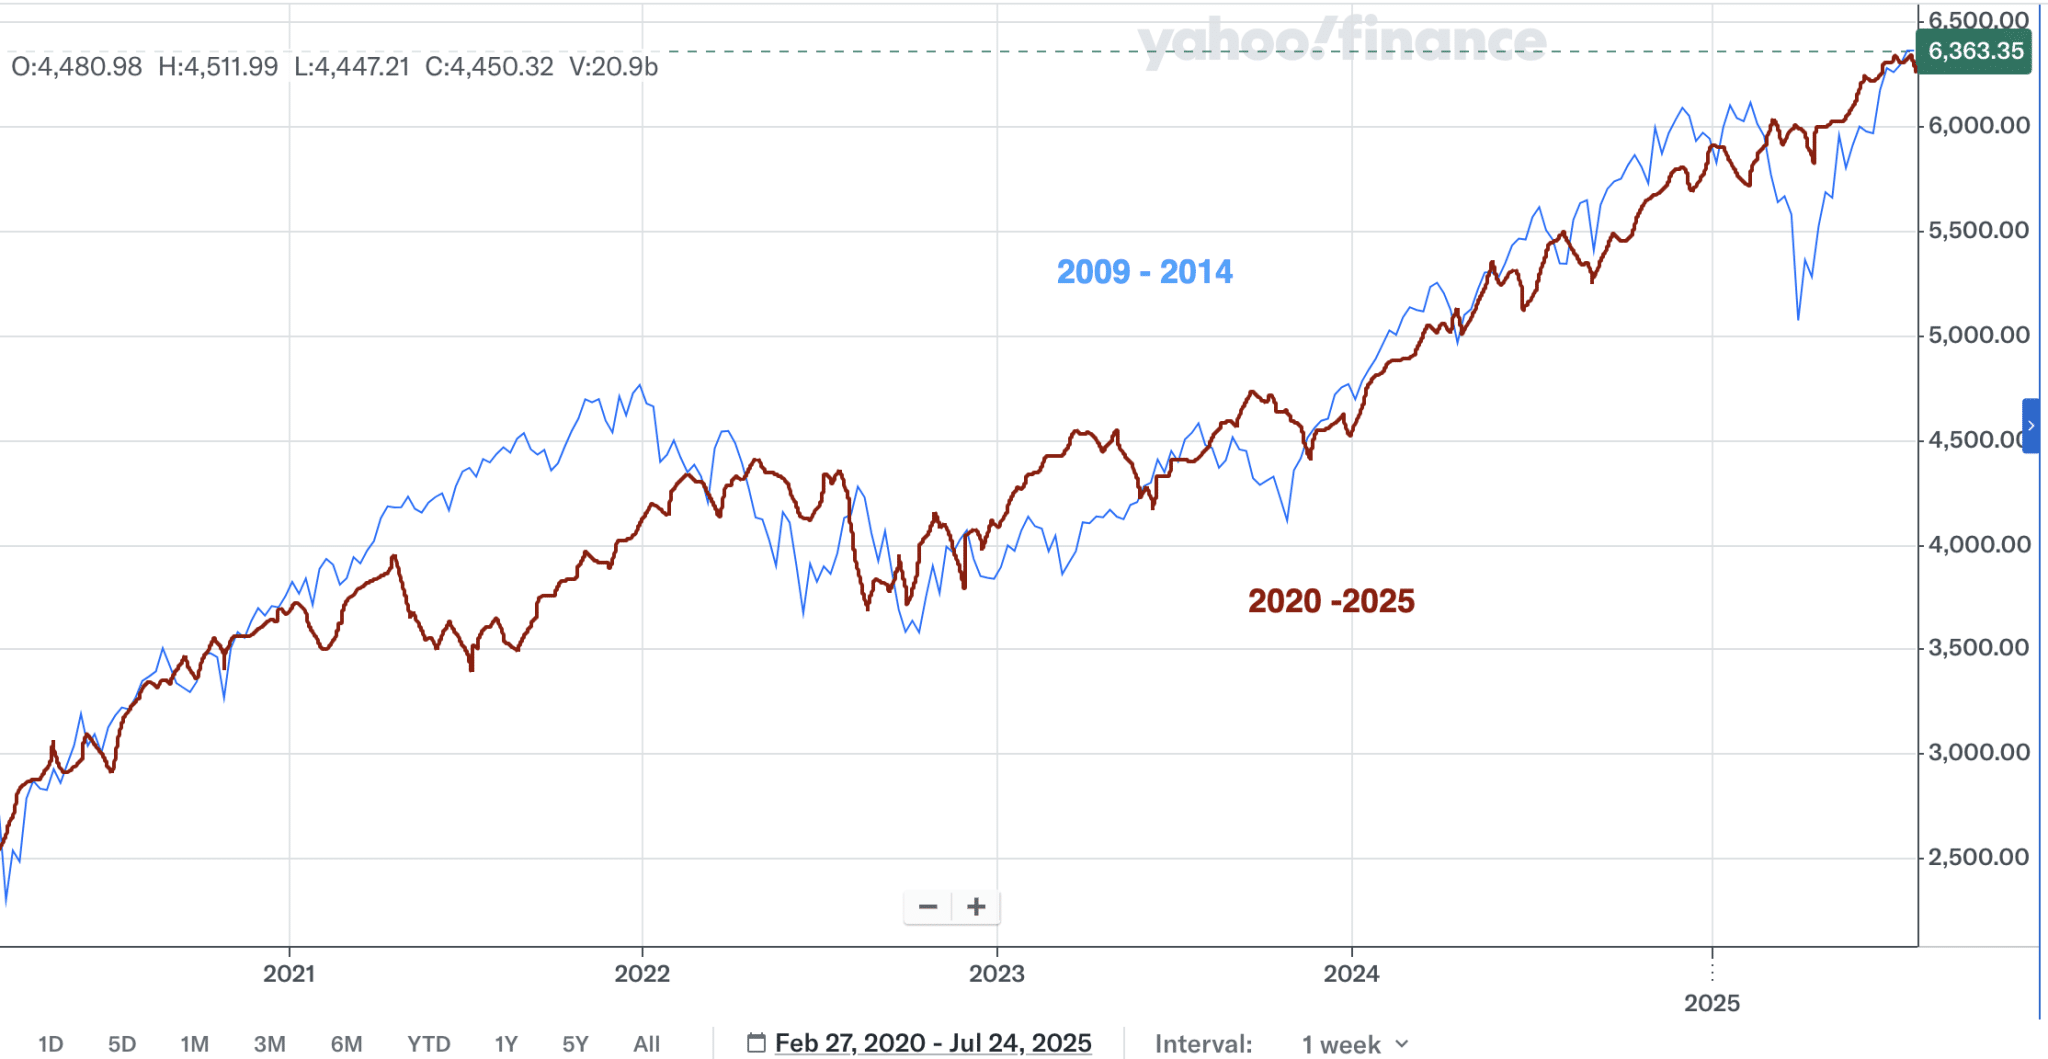
While the Cycle Composite offers an average path performance based on 3 different cycles and time periods, even the average July pathway has found the S&P 500 outperforming in July of 2025, to-date.

Indeed, July 2025 seemed to be following the typical July performance, but that ended with 5 consecutive days of all-time highs this past week. Kind of an amazing feat of strength in and of itself; 5 consecutive days of all-time highs, but I digress. Where the index typically peaks and consolidates would have usually taken place already, but as the chart above depicts, such price action did not occur. Whether it has been outperforming the Cycle Composite or the average July monthly performance, there is the same message from Mr. Market’s price action, outperformance.
Direct quote from Finom Group’s “Use Volatiliity To Your Advantage; Don’t Fear It” Report (July 27, 2025):
With both the S&P 500 and NYSE Daily Advance/Decline Line having made 52-week highs this month (July), the historical odds for further gains through year-end are very, very good.

“With both the S&P 500 and NYSE Daily Advance/Decline Line having made 52-week highs this month (July), the historical odds for further gains through year-end are very, very good. Our technical and quantitative framework of data inform of higher-highs by year-end 2025. The S&P 500 has never had a July confirming signal and avoided higher-highs, with an average return of 6.4%. Even the lesser returns identified in the table would likely see the S&P 500 challenging the 6,400s. The big picture is more important than the next week or even the next month!✅ “
Direct quote from Finom Group’s “Use Volatiliity To Your Advantage; Don’t Fear It” Report (July 27, 2025):
We now have QQQ lagging SPY and Semiconductors underperforming Technology while Semiconductors are testing the 21-DMA. The combination of these technical happenings does not predict the future and can be remedied by earnings results from mega-cap Tech this coming week (AMZN, MSFT, AAPL, META), but I think such occurrences while also considering VIX 14 informs that investors hold “lowered expectations ⤵️ “ for the forward 30-day period. Market leaders are not presently leading (QQQ and SMH). And while I don’t put a lot of “stock” into looking at measures of volatility through a technical lens, I do value unusual setups such as what we see in the chart of the Nasdaq’s VIX (VXN chart below):
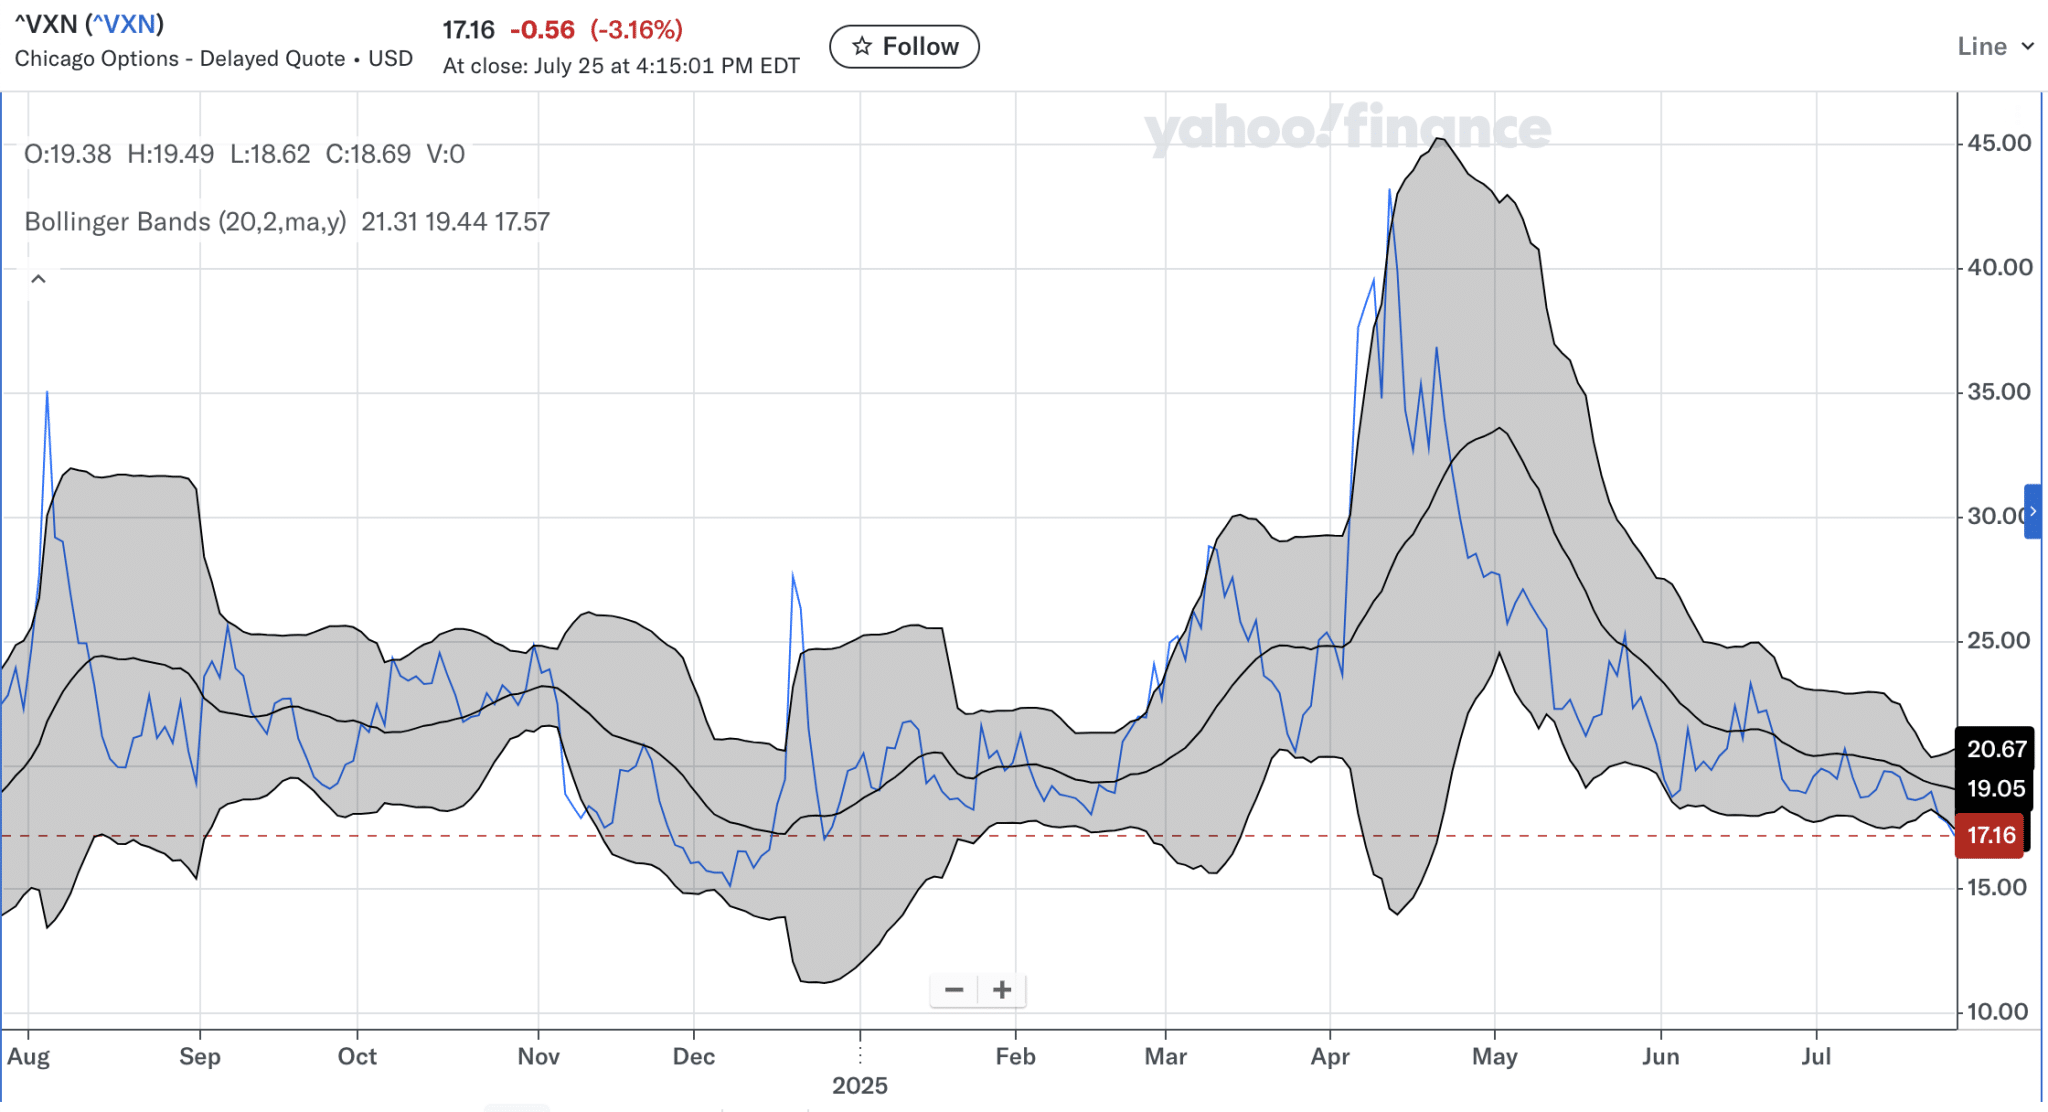
Achieving the lowest VIXN level of the year this past Friday, the lowest reading since December of 2024, and closing below its Lower Bollinger Band speaks to extreme tranquility in markets, longer-term bullishness, but also likely near-term mean reversion of volatility rising 📈. The last time VIXN closed below it’s Lower Bollinger Band in November of 2024, the Nasdaq Composite would retreat some 600pts or -3 percent. Again, not a prediction, but recognizing the former behavior of the market for probabilities hence forth.
If we take the technicals at face value and combine them with the approaching fund flow weakening period ahead, we should anticipate some consolidation near-term. The last time I said that the markets fell in the week ahead… by less than -.3%. I say this to reinforce that any pullback, ANY PULLBACK at all… be on your best behavior folks! The market message is UNAMBIGUOUSLY very bullish longer-term! Down is good, UP IS SIMPLY BETTER 💯🎯


