
Welcome to our Finom Group June Monthly Macro-Market Recap
The Imperative of Discipline and Data in a Turbulent 2025 Market Landscape
As we approach the midpoint of 2025, the overarching sentiment among market participants is one of bewilderment, perhaps even exhaustion. The first half of this year has defied conventional Wall Street “wisdom”, challenged established analytical frameworks, and relentlessly tested the fortitude of investors across the spectrum, from seasoned institutional managers to burgeoning retail traders. If one were compelled to encapsulate the market’s essence in a singular descriptor, terms like “Volatile,” “Unpredictable,” or “Chaotic” might readily spring to mind. These words, while undeniably accurate in their reflection of daily price swings and news-driven disruptions, merely scratch the surface of the deeper, more profound narrative unfolding. For the discerning investor, the word that resonates with the most enduring significance, the one that serves as both a diagnostic and a prescriptive, is discipline, or rather “agressive discipline”, per Brad Carter.
This is not merely a buzzword or a platitude offered in times of uncertainty. Rather, 2025 has unequivocally proven itself to be a market environment that has meticulously, almost brutally, stress-tested every facet of an investor’s operational process, their intrinsic patience, and their ultimate resolve. The very fabric of established investment methodologies has been pulled taut, examining whether they can withstand the unprecedented confluence of endogenous and exogenous shocks that have characterized these past six months.
Consider the immediate technical posture: the short-term downtrend persists, albeit exhibiting more of a sideways drift than a precipitous decline. Despite the persistent headwinds, the S&P 500 has managed to tenaciously cling to the critical 5,900 level. This resilience, while superficially encouraging for those aligned with a bullish outlook, carries an underlying caveat. The lack of broad market participation – anemic breadth, in market parlance – remains a pervasive and escalating concern. As highlighted by Finom Group in their incisive June 22, 2025, report, “First Half Of 2025 Comes To An End With Exogeny Afoot,” the S&P 500’s ability to maintain its perch above 5,900 is indeed “encouraging for the bulls”. But does the supposed “lack” of broad participation remain a concern, or could we be on the verge of a new tech-driven bull market? This observation was not merely a technical detail; it spoke volumes – no pun intended – about the fragility underpinning headline index performance if Inflation risk was to resurface.
For those who engage with Finom Group’s insights, the objective is unequivocally clear: you are not here for market hype, fleeting rumors, or superficial analysis. Your pursuit is a deeper understanding – a quest to uncover “what’s really happening beneath the surface.” This entails dissecting the multifarious forces that are actively driving volatility, identifying the truly salient signals amidst the cacophony of daily noise, and, most critically, discerning the strategies that have demonstrably succeeded, and those that have spectacularly failed, in a year that has, with disconcerting consistency, defied nearly every prediction proffered by traditional forecasting models. This recap serves as your compass, guiding you through the complexities and reinforcing the principles necessary not just to survive, but to thrive.
This report (by Luis Solorzano) RECAP is intended to provide members with a clear and concise overview of the most important insights from our most recent research and communications, offering a direct connection between our published analysis and the real-world market events of the past several months.
This recap draws directly from key excerpts of Finom Group’s major research reports and daily or weekly member communications, specifically covering the period from May to June 2025. Each section highlights a particular report or communication, beginning with a direct quote by Seth Golden from the original research report. Following some excerpts, you may find additional commentary by Luis highlighted in RED of how those insights have been validated—or, in some cases, challenged—by actual market developments as of today. The intention is to bridge the gap between our research and the unfolding market environment, making it easier to see the relevance and application of our guidance.
By organizing our research alongside current market evidence, this recap helps members recognize the links between our forecasts and what has actually transpired in the markets. It also provides valuable context for our recommendations, allowing you to better understand the reasoning behind them. Whether you are a long-time member or new to Finom Group, this document offers a clear snapshot of our most relevant research and commentary, saving you the time/effort of sifting through every report to stay informed.
You can use this recap to review past research and see how it stands up in light of recent market action, to inform your current investment decisions with the rationale and evidence behind our guidance, or to introduce new members to the core ideas and track record of Finom Group’s research. Each section is clearly labeled with the source and date of the original material, followed by direct quotes and a summary of current market evidence. Additional commentary from Luis Solorzano in RED is included to provide perspective and context.
With this introduction, you are now ready to explore the recap. The following sections will walk you through our most important research and commentary, and show you how they connect to the markets as they stand today.
Direct quote from Finom Group’s “Only 2 Ways For The Market To Go From Here” Report (May 4, 2025):
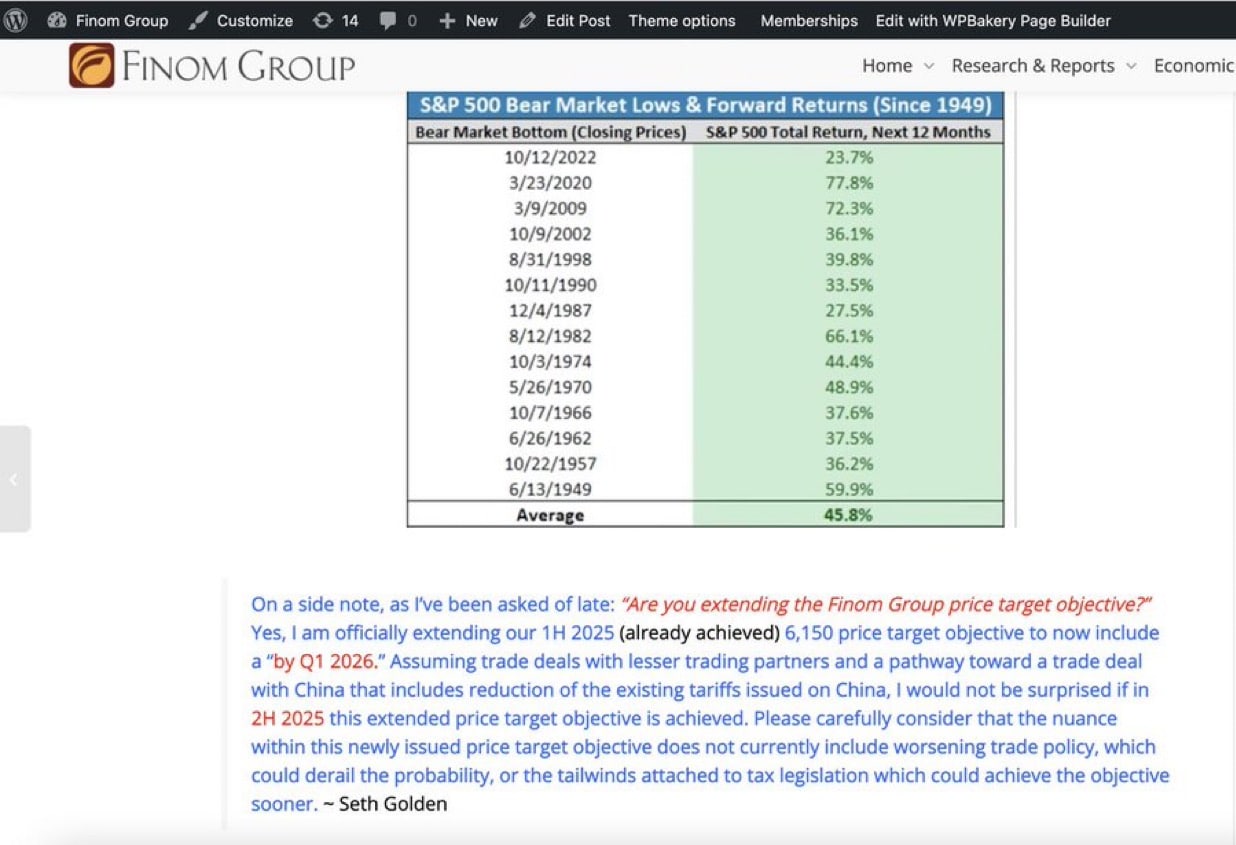
On January 1, 2025, Finom Group’s Seth Golden made a significant forecast: the S&P 500 could reach 6,150 within the next 12 months, a substantial, albeit muted, 5% increase from its 2024 closing price of 5,881. This prediction stands in stark contrast to the ominous Wall Street targets of 4,500-7,000 before Trump 2.0 Inaguration.
Fast forward to June 25, 2025, and SPX has already surpassed 6,000, with the potential to reach 6,150 once again. This target now appears not only realistic but also conservative.
Regardless of the geopolitical outcomes, I firmly believe that Trump’s intentions are to preserve the long-term economic trends we are witnessing. The future remains uncertain.
These trends encompass the emergence of enthusiam towards Gen AI and positive demographic factors that are positively impacting the economy and markets. Consequently, the recession watch remains in effect until 2026. Stay informed and remember that our primary responsibility is to respond to local price weakness with a long-term mindset, avoiding panic. As we all know, fear, uncertainty, and doubt (FUD) are constant, and the only thing that truly changes is the intensity of these emotions and how well you are able to manage them on your own. Should these factors influence your decision-making? I do not believe so. Remember, US Large Cap Tech stocks are still early in a secular bull run just like the internet in the 1990’s, per Datatrek.
A potential positive development for the equity markets could be a Supreme Court decision in June 2024, regarding the overruled Chevron doctrine. This decision could lead to reduced government interference by agencies in the United States. This decrease in compliance costs and internal regulatory oversight could result in increased productivity. There is a glimmer of hope that market forces will encourage corporations to prioritize the interests of not only their shareholders but also the broader economy and its participants.
As Seth Golden aptly stated, “Please carefully consider that the newly issued price target objective currently does not include worsening trade policy, which could potentially derail the probability, or the tailwinds associated with tax legislation that could achieve the objective sooner.”
Direct quote from Finom Group’s “Pessimism: The Enemy of a Portfolio is the Enemy of Returns” Report (May 25, 2025):
The Pullback Arrives
As the chief equity strategist at Finom Group, I (Seth Golden) have been recognizing and outlining that breadth thrusts consist of powerfully overbought/overheated/overextended market conditions. They can prove so powerful that the breadth thrusts triggered often have more upside at the index level, before ultimately and inevitably delivering a pullback in price (from inside last week’s macro-market Research Report).
“With the S&P 500 rallying some 1,100 points off of the lows in as little as 6 weeks, overheated/overextended conditions need but a headline to nudge them off course, even if for just a moment in time and to relieve certain of the overbought/overextended conditions.
- Good News: Growth has outperformed relative to Value (chart above) and driven the performance ratio to 3-year highs, confirming an economic growth-scare has been removed
- Bad News: Performance ratio is 2std above 20-DMA
- Opportunity: Value/Small/Mid catch some rotation
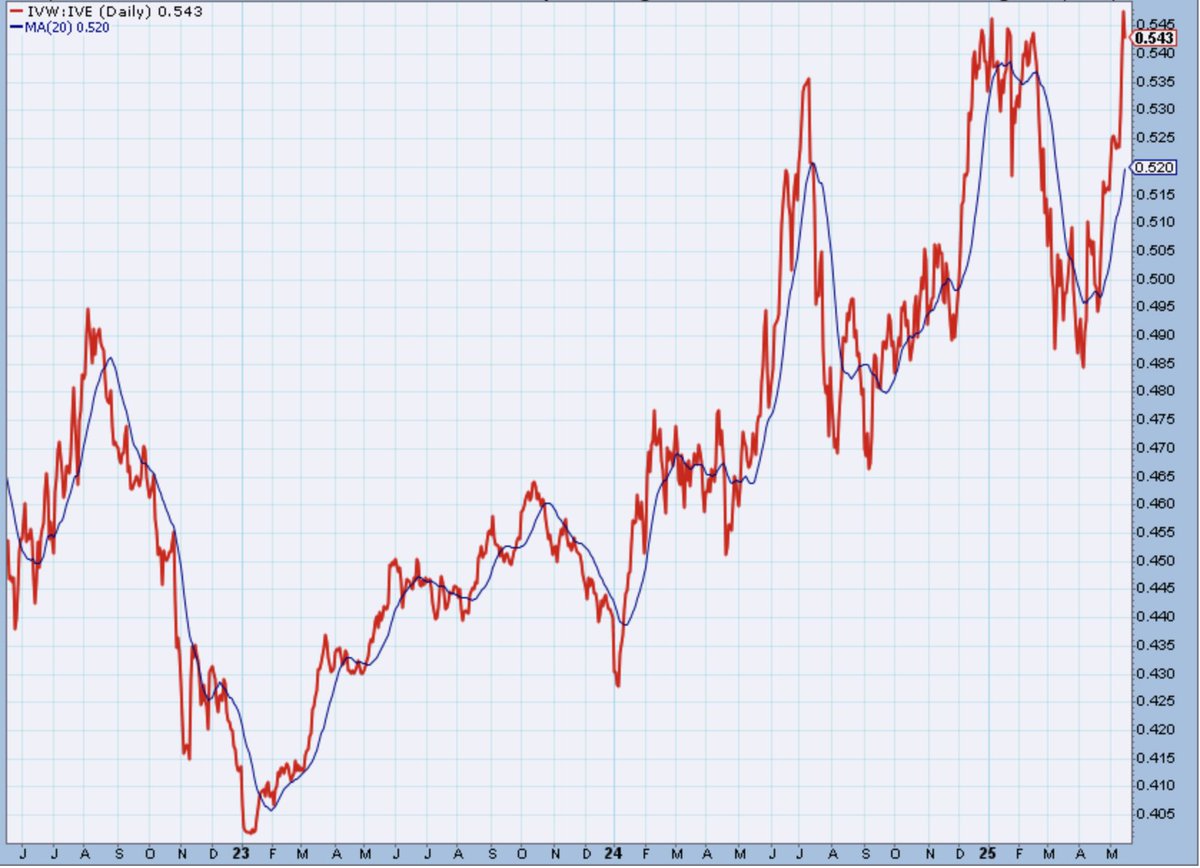
The April 2025 pullback unfolded almost exactly as Finom Group anticipated: after a powerful breadth thrust and a rapid 1,100-point S&P 500 rally, the market became technically overbought and vulnerable to even minor negative headlines, which triggered a swift but ultimately healthy correction. This brief pullback, and relatively shallow correction was not a sign of underlying weakness but rather a natural response to stretched conditions, as evidenced by the performance ratio of Growth versus Value reaching extreme levels. True to the report’s forecast, the dip was short-lived; systematic dip-buyers and resilient fundamentals helped the S&P 500 quickly recover and resume its uptrend, rewarding disciplined investors who stayed the course and highlighting the importance of respecting quantitative/technical signals and market psychology rather than succumbing to fear or pessimism, regardless of their apparent failures.
Direct quote from Finom Group’s “Pessimism: The Enemy of a Portfolio is the Enemy of Returns” Report (May 25, 2025):
Although I would like to see the former quant for the combined breadth thrusts finding favor come Monday, I’d rather find investors favoring downside, if not only for the meager sample size of the quant, but also for re-leveraging portfolio exposure for the long haul. Isn’t it always the case that when the market is rising we don’t have enough exposure, and when the market is falling we feel as if we don’t have enough exposure. We’ll see what the coming week brings, but the history of the markets’ long-term trend suggests you can never have enough long-term market exposure.
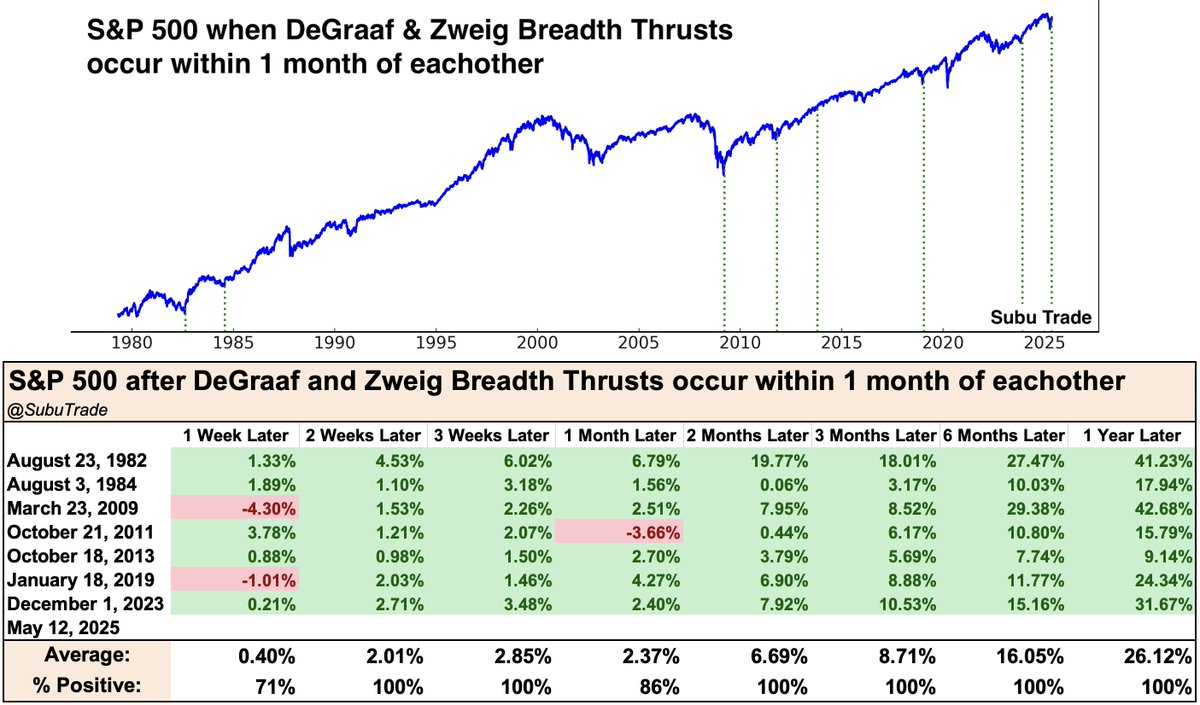
The preference for investors to favor downside after a rare combined DeGraaf and Zweig Breadth Thrust—despite the small sample size—proved to be a classic behavioral trap, as the historical record overwhelmingly showed strong positive S&P 500 returns in the months following such signals. The data confirms that after these dual thrusts, the S&P 500 has delivered positive returns 100 percent of the time at the two-, three-, six-, and twelve-month marks, with average gains of 6.7 percent at two months and 26.1 percent at one year. In 2025, this pattern repeated: although some investors hesitated or hoped for a pullback to increase exposure, the market’s long-term trend rewarded those who stayed or added to positions immediately after the signal, underscoring the lesson that waiting for the perfect entry often results in missed opportunity and that, historically, it is nearly impossible to have “too much” long-term exposure after such rare breadth confirmation events. July 12th is coming up, folks! If we dip under 5,844, you know what to do… 😉 💯
Direct quote from Finom Group’s “Markets Dancing Toward All-Time Highs, But When The Music Stops…” Report (June 8, 2025):
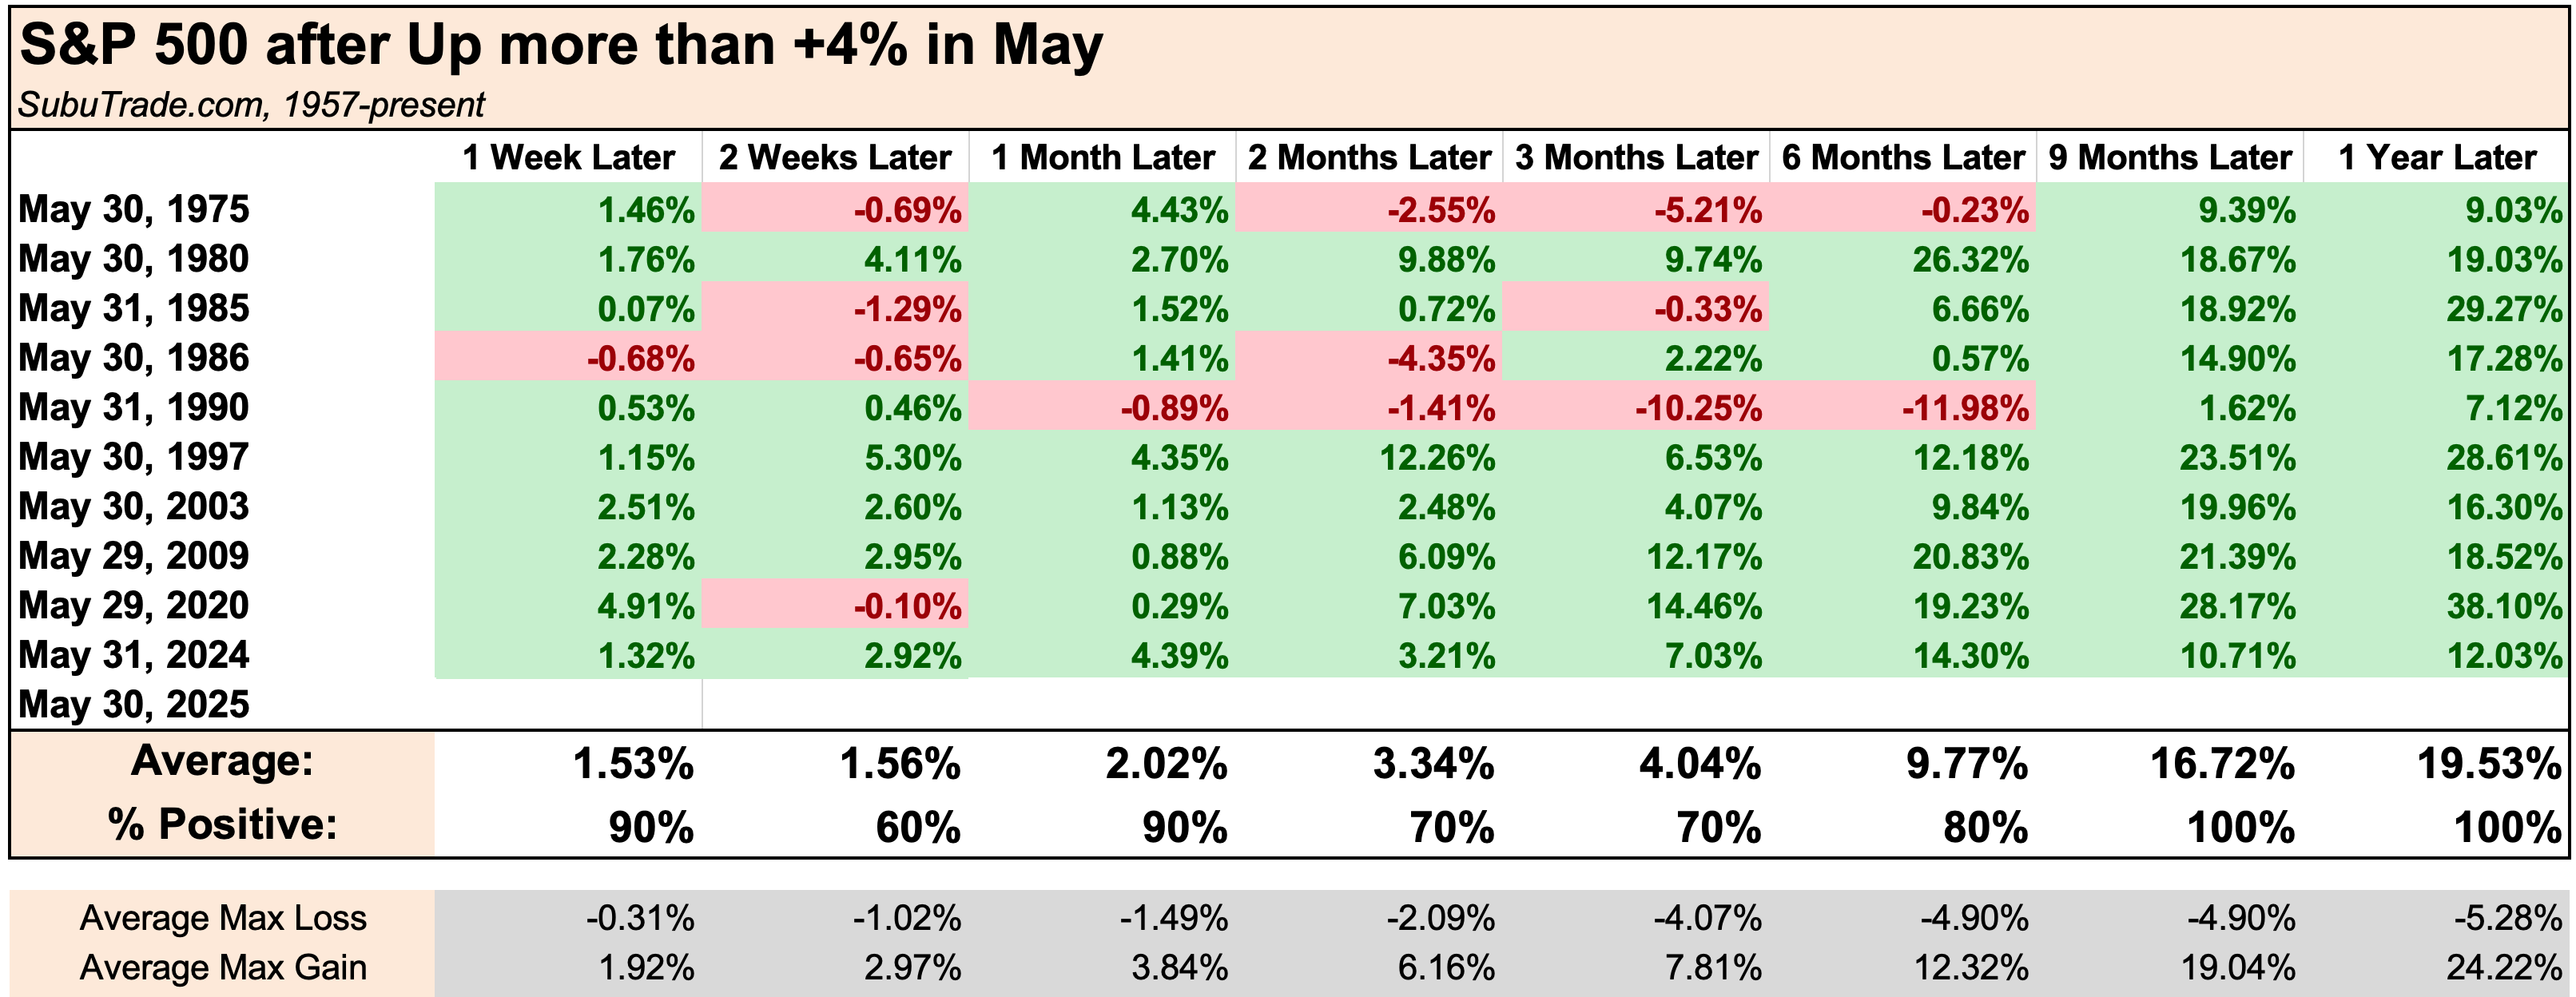
Another quant that gave us confidence for this past week’s probabilities was just how strong the month of May proved.
While not as perfect as the prior quant, it’s pretty darn close. The week following a May monthly 4%+ gain, the S&P 500 has been higher the following week 90% of the time; only 1-pullback week of the 10 occurrences. The probabilities from this particular quant are not as favorable for this coming week, but once again improve thereafter.
Direct quote from Finom Group’s “Pessimism: The Enemy of a Portfolio is the Enemy of Returns” Report (May 25, 2025):
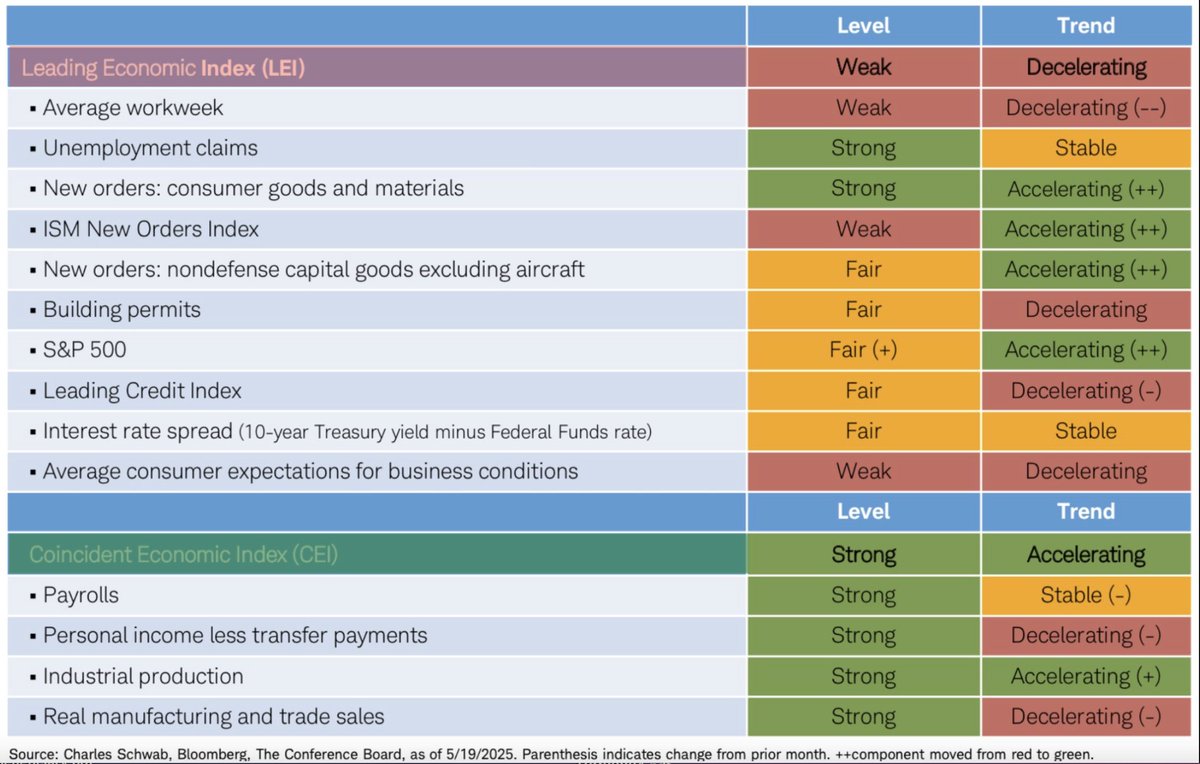
With a bigger sample size than the “combo quant” from @SubuTrade, and continuing to recognize the conditions that led to the markets’ recovering all their turn of year losses, it’s still a magnificent feat of bullish strength to see markets gain 15%+ in a mere 25 days. There’s a lot of positive price action going forward, with only 1 negative return 6 months later and no negative returns a year later. Naturally, the only interim losses came via the Dotcom and Great Financial Crisis periods. What I also find interesting about the price action, is that no recession took place 12-months forward. Only one signal was within the midst of an ongoing recession (2008), a condition not present today, and as recognized in the Coincident Economic Index below (bottom section of table, green).
It’s almost comical, although I’d rather not poke the bear so to speak, that the Leading Economic Index (top Burgundy, LEI) has been in what has typically signaled an ongoing-recession territory for the better part of the last 2 years… and yet no recession.

Direct quote from Finom Group’s “Pessimism: The Enemy of a Portfolio is the Enemy of Returns” Report (May 25, 2025):
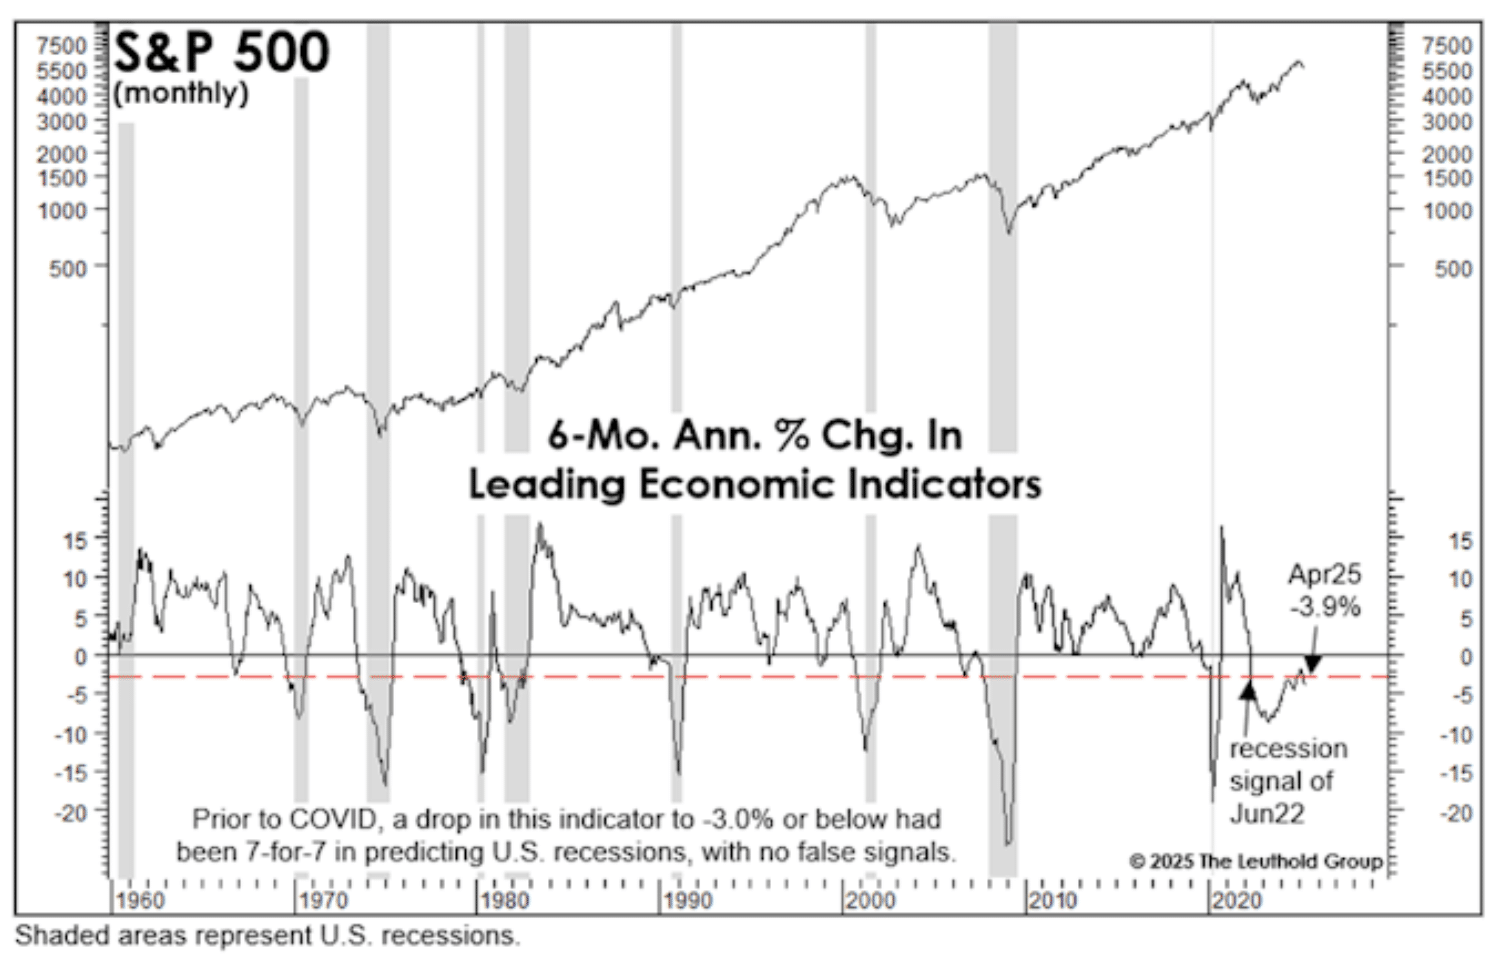
Mixing it up a little bit with some macro-economics, the Index of Leading Economic Indicators dropped again in April, extending the period of drawdown from the December-2021 peak to 40 months. The longest peak-to-trough drawdown in LEI history was 47 months (Sep. 1978-Aug.1982). That period, of course, captured the famed double-dip recessions of 1980 and 1981-1982.
The LEI also fired another recession signal in April, which is based on a rule of thumb we’ve monitored for years. Specifically, the LEI’s 6-month annualized percentage change fell to -3.9%, below the -3.0% threshold that’s correctly forecast 6 of the last 8 recessions and “confirmed” the other 2 when those recessions were just a month old.
The LEI has been so far off the mark in this cycle that the message has been completely dismissed by investors. That’s understandable, but it’s also a pricey proposition with the S&P 500 now at 21x 12-Month Forward EPS estimate. By the way, we’d view April’s LEI decline as a new recession signal, but what that may be worth given the formerly failed signals remains unknown. We’re simply recognizing the signals history at this point, not forecasting anything more than that.
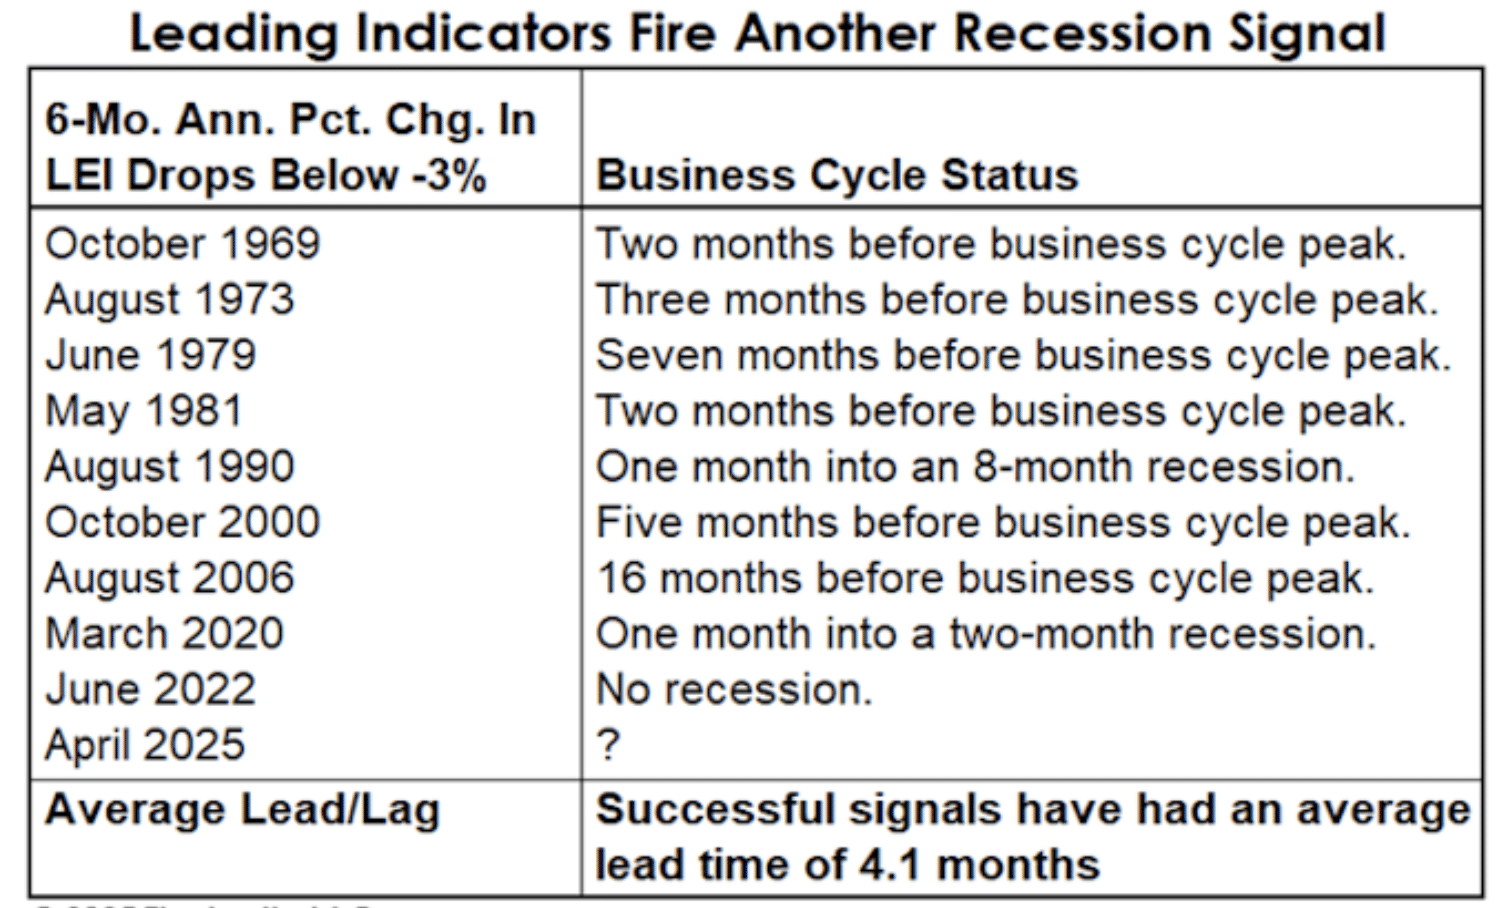
The historical performance of the simple LEI rule of thumb is outlined in the table above. Prior to the 2022 failure, the average lead time between the breach of -3.0% and the business cycle peak was 4.1 months. I’d be of the opinion that like past, post recession periods, the LEI will go through various weighting adjustments as well as individual metric changes. Some will be removed and replaced with new metrics. Reverting back to our discussion on market breadth thrusts and the go-forward probabilities…
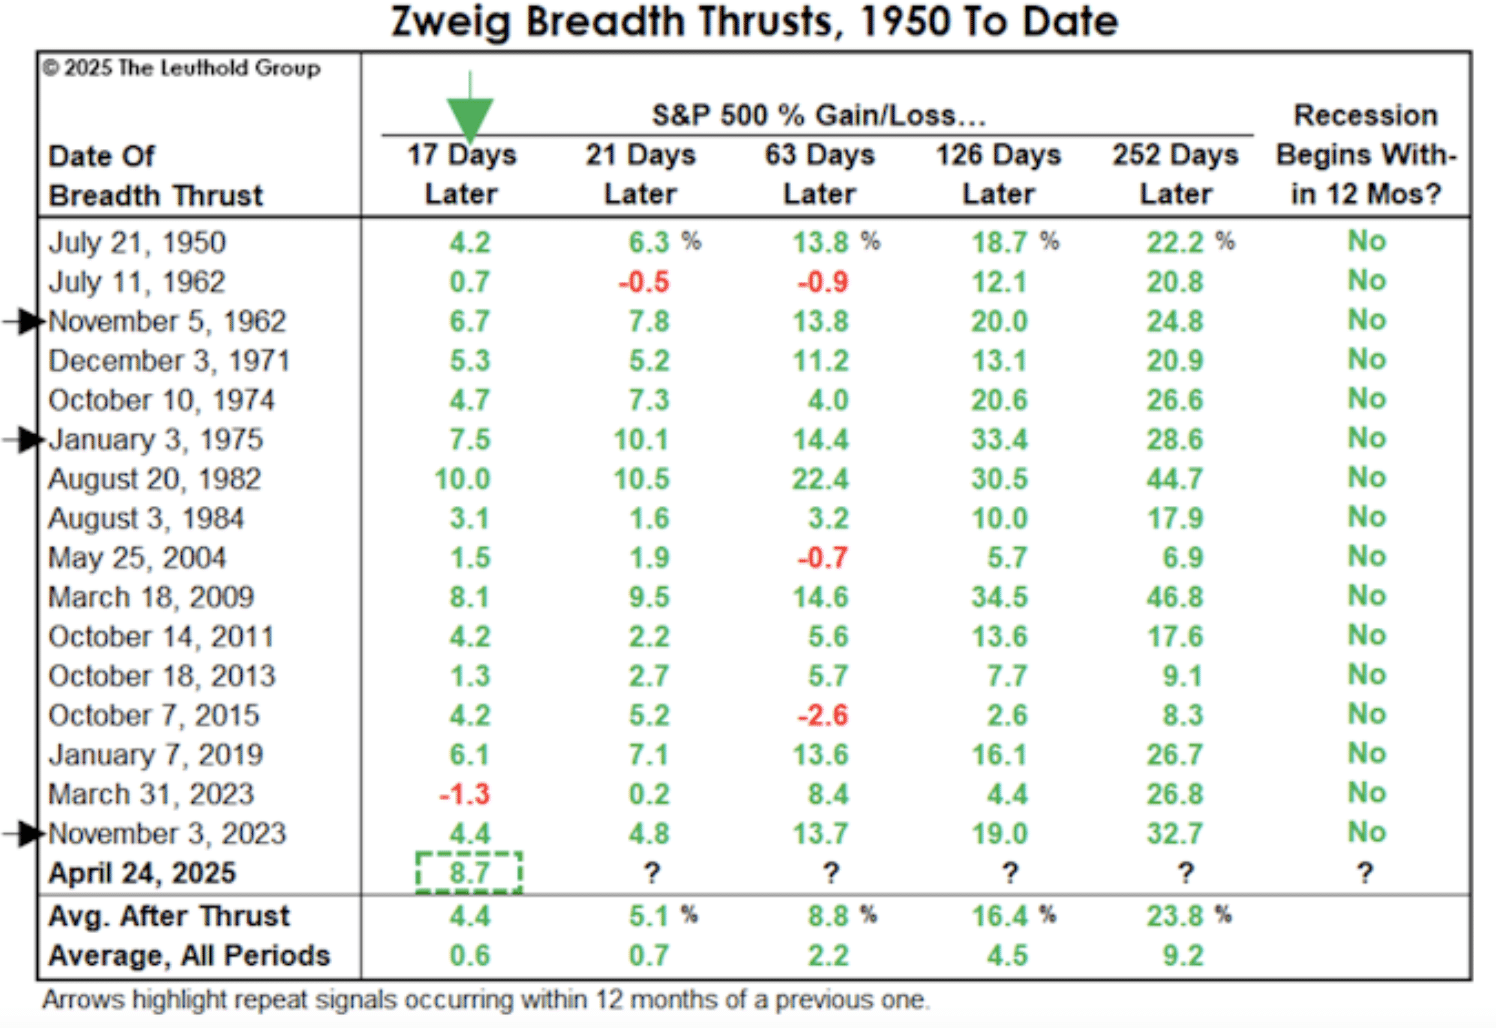
The 17-day gain following the latest Zweig Breadth Thrust signal was 8.7%, the second-best on the quant list for all ZBTs since 1950. For what it’s worth, the top-two signals for the forward 12-month performance (Aug. 1982 and Mar. 2009) were also followed by big gains out of the gates (+10.0% and +8.1%, respectively). This is not to say that the 12-month forward results from the current signals 17-day forward strength will replicate 1982 and 2009’s signal, but we’d definitely keep this quant handy going forward. 😉 ✅
Direct quote from Finom Group’s “Pessimism: The Enemy of a Portfolio is the Enemy of Returns” Report (May 25, 2025):
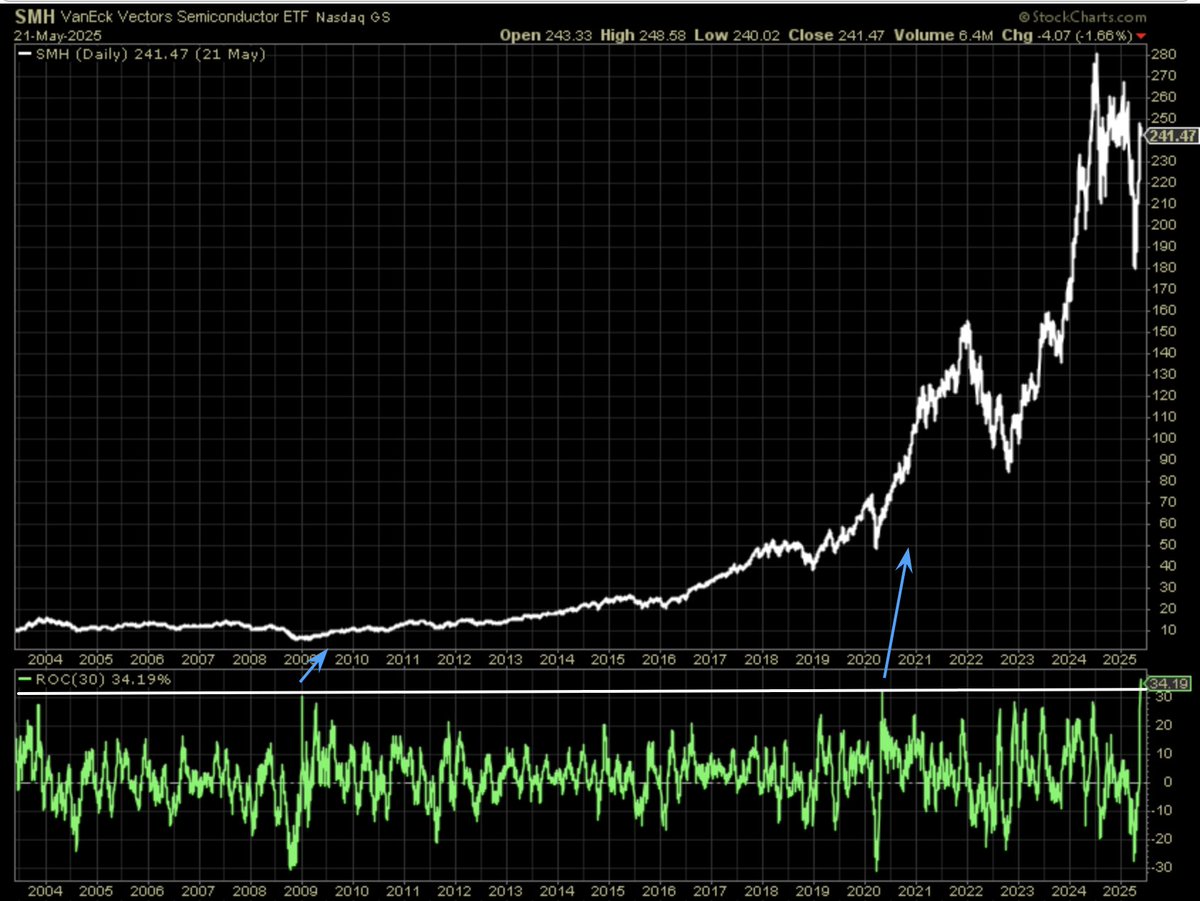
I’ve long since stated, “A new bull market will demand the largest industry in the market (Semiconductors) to lead the largest sector of the market (Technology).” And so it has been that Semiconductors and Technology have proven leadership once again, and coming out of the technical bear market. As the chart indicates, the Semis 30-day ROC has been the greatest since 2003. Can the Semis be this wrong? Yes. Have Semis been this wrong in the past? No. In other words, for investors to bid up the Semiconductor industry ETF this much and this rapidly would demand an endogenous/exogenous event to arrive, again. What we’re really forced to ask ourselves here is whether or not there are millions upon millions of investors this gullible? It’s possible, but is it probable. We deal in probabilities as investors/traders! Here’s what I also like about the Semis’ rally…
Good and strong bull markets or bullish trends will eventually delivery overheated conditions. The fact that the Semis were able to achieve a 14-day RSI greater than 70 during the bull run informs of something the stock has not done in almost 12-months. That’s a long time for Semis to go without meaningful relative strength, which served its weak price action for the last 10 months. I’m of the opinion the 70 reading on the 14-day RSI is indicative of a regime change for Semis, and again one that is likely only to be undone by way of exogeny/endogeny, for which investors/traders can’t control.

Direct quote from Finom Group’s “Pessimism: The Enemy of a Portfolio is the Enemy of Returns” Report (May 25, 2025):
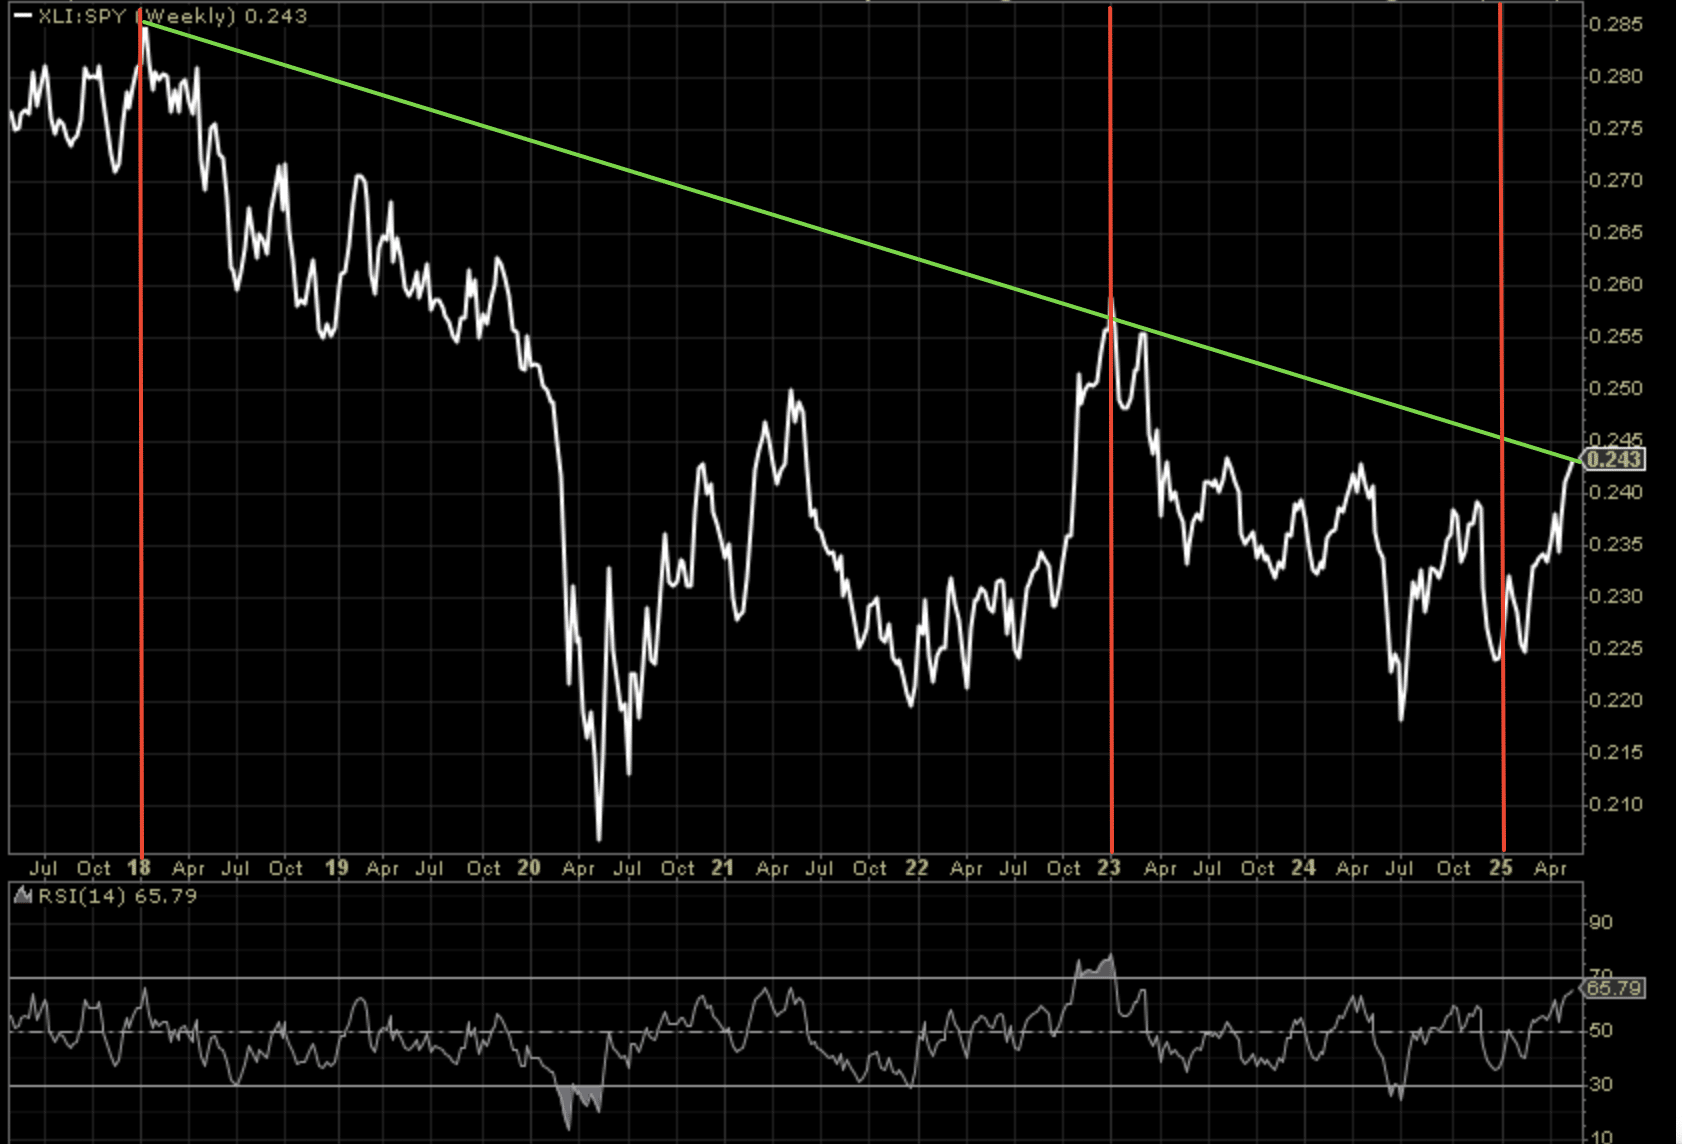
While it is clear to see that Semis still have work to do in order to recapture their glorious highs and establish new all-time highs, this aspect of the cyclical trade references investors’ belief in the expansion cycle, akin to what has been expressed in other cyclical sectors like Industrials. For all the woe is U.S. manufacturing rhetoric, the Industrial sector ETF (XLI) has made an all-time high during the markets’ renewed uptrend.
Again, we focus on the achievement of a 70 RSI for the first time in a while for Industrials, but also highlight the all-time high price achievement for the sector, unlike Semis. It’s not to suggest Semis can’t achieve new all-time highs in 2025, just the facts to-date. Here’s something else I found interesting that might also lend itself to assuaging those investors/traders concerns in about the survivability of the expansion cycle, given the litany of threats it faces and faces on many fronts:
I have both often stated and evidenced how the character of the markets can change at the beginning of a new calendar year, and that’s what I have highlighted with the red lines in the relative performance ratio of the Industrials vs. S&P 500 index ETF (SPY) above. It’s clear from the downward sloping performance trend line in green, that Industrials have well underperformed the SPY since 2018’s New Year peak. The price trend is not at long-term key resistance. I’m not of the opinion resistance proves a concrete wall in 2025, although it may prove interim resistance. Harkening back to the red line observations around the turn of the calendar year, it’s clear that now nearly half way through calendar year 2025, this turn of year performance is unlike others in the past, which may prove a key detail in favor of my thesis that resistance will likely be overcome. Having said that, like anything else within the current Presidential regime, endogeny/exogeny can prove to overwhelm the technicals, fundamentals, and quants.

Direct quote from Finom Group’s “Markets Dancing Toward All-Time Highs, But When The Music Stops…” Report (June 8, 2025):
It’s long been understood, and through dedicated studies and evidenced research, that Buy and Hold is the ONLY absolute strategy that can market perform. “Active cash management” skills for investing can produce a bolt-on/vertical to the Buy and Hold strategy. From an active perspective, the objective is to know better “when” to deploy more capital to the standing Buy and Hold strategy, but make no-mistake about it folks, the deployment of more capital should be aligned with the Buy and Hold principle strategy. Anything shy of Buy and Hold has proven investor psychology failures, which ultimately show themselves behaviorally.
From this active cash management perspective we look to discover cheaper prices, if not the cheapest of stock/ETF prices during market pullbacks/corrections/bear markets. Let’s look back at some of these active cash management signals for cheaper prices that we outlined/discussed within the Finom Group macro-market Research Report from April 6, 2025:
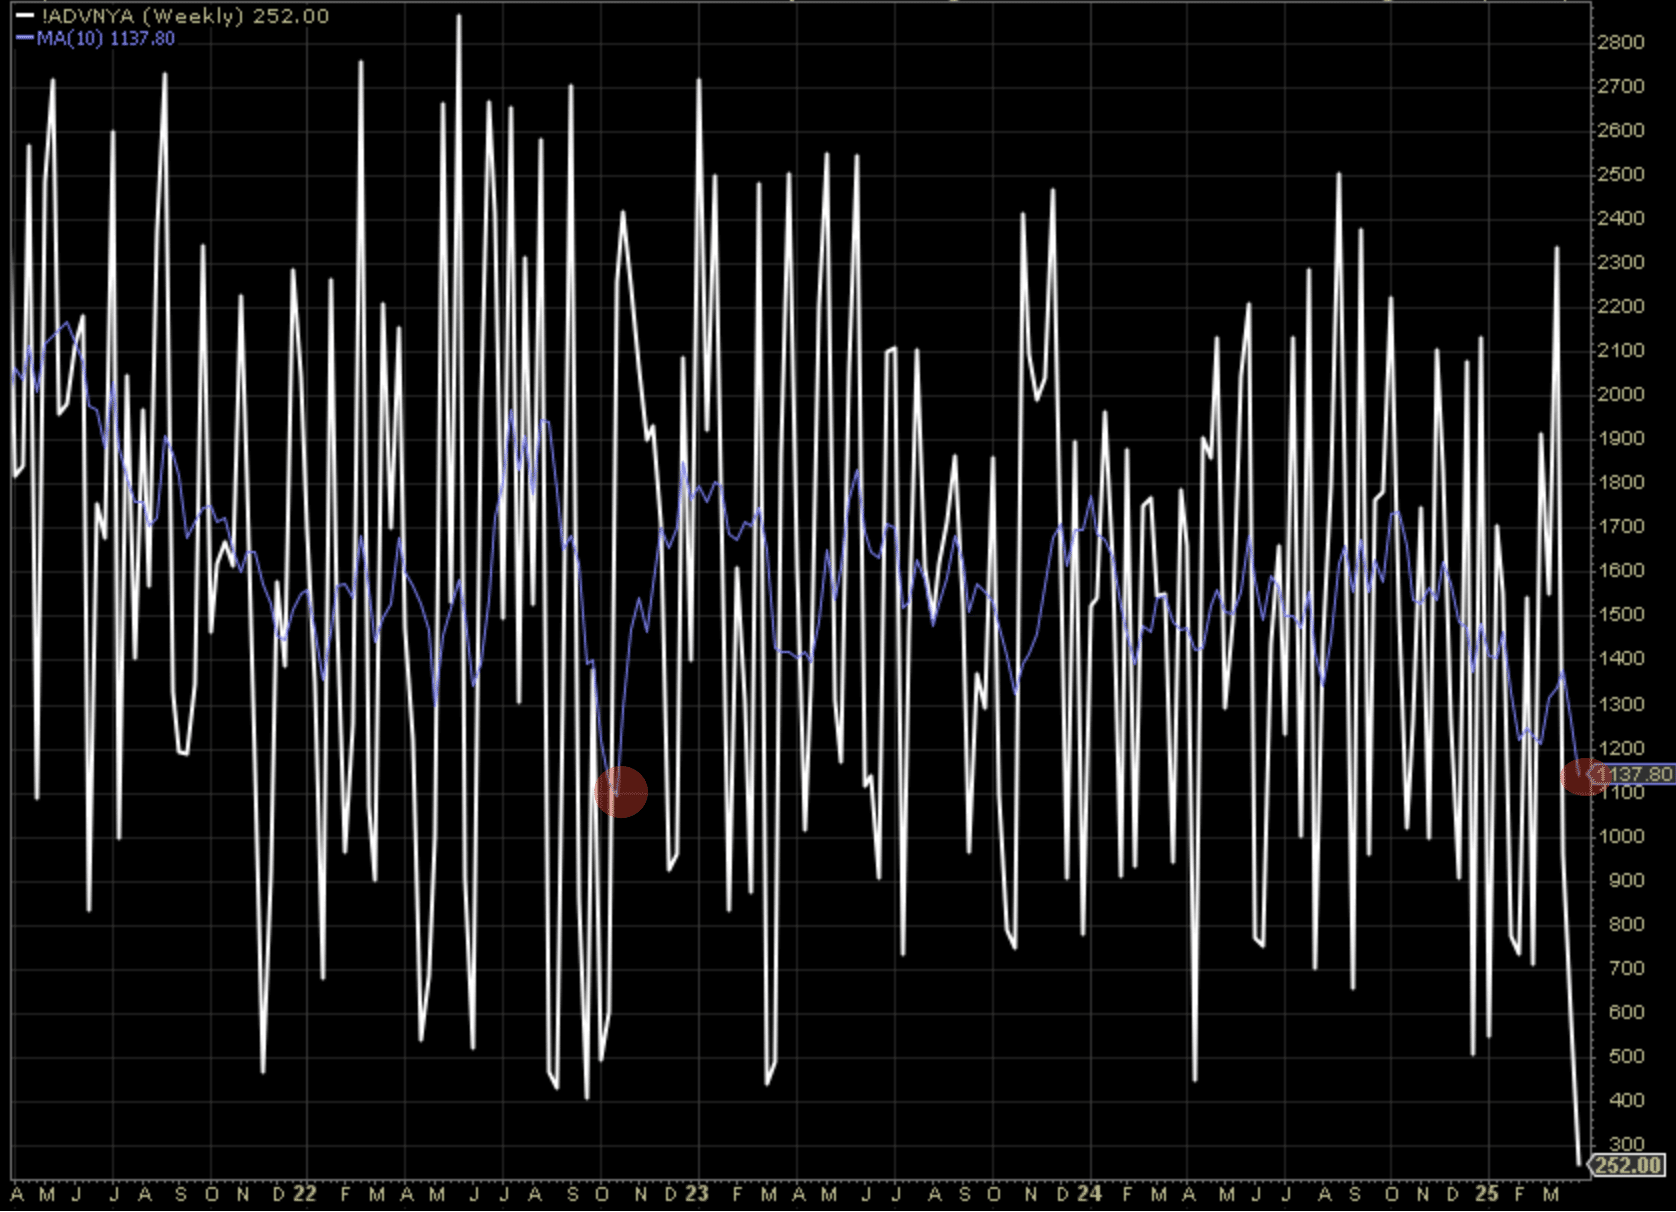
“Not only are the total NYSE Advancers at the lowest level in the post-pandemic era, lower than even during the 2022 bear market, but the 10-week moving average of the NYSE Advancers had only once been lower than they are today, at the ultimate low of the 2022 bear market. My takeaway here is that if we have expressed fewer absolute NYSE Advancers than the prior bear market, we may still yet have one more down-leg to go before the 10-week moving average of NYSE Advancers marks the ultimate low for the stock market. No guarantees of course, and how quickly we could recover remains open for analysis, which I plan to get to shortly.
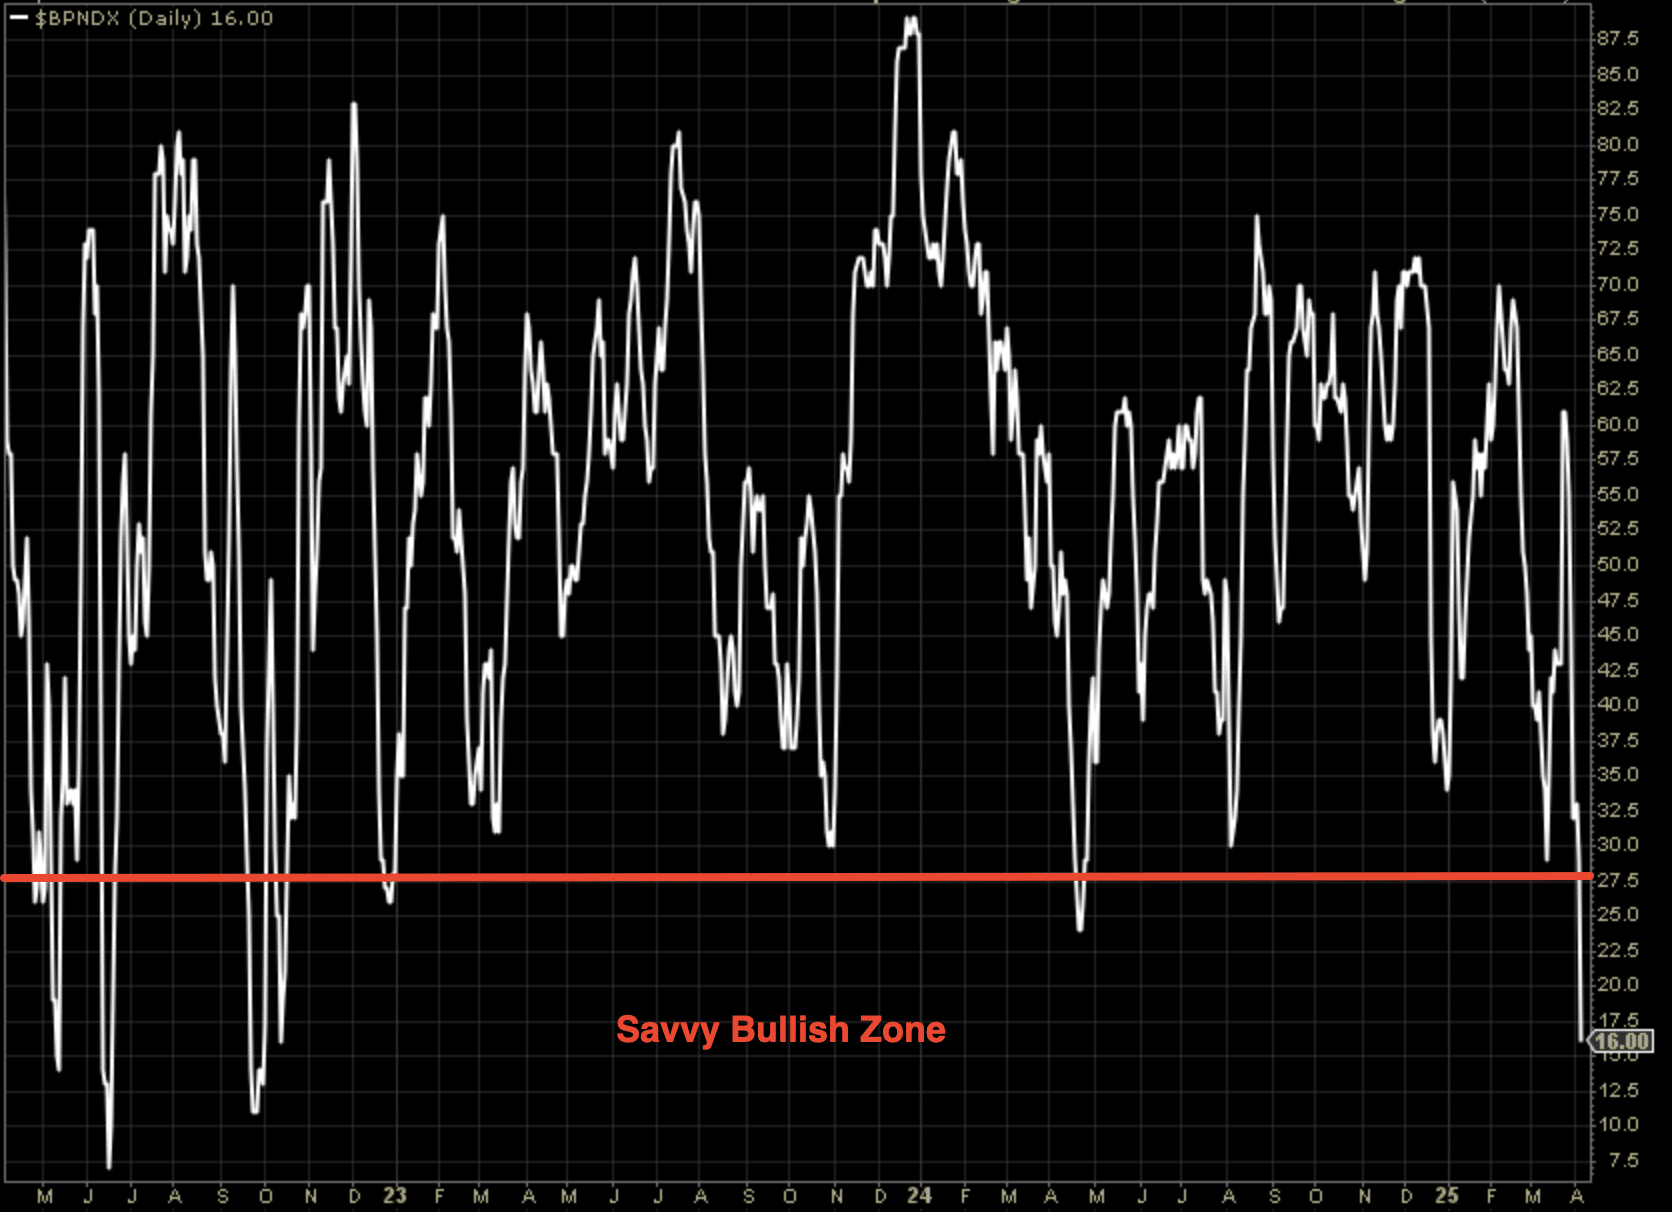
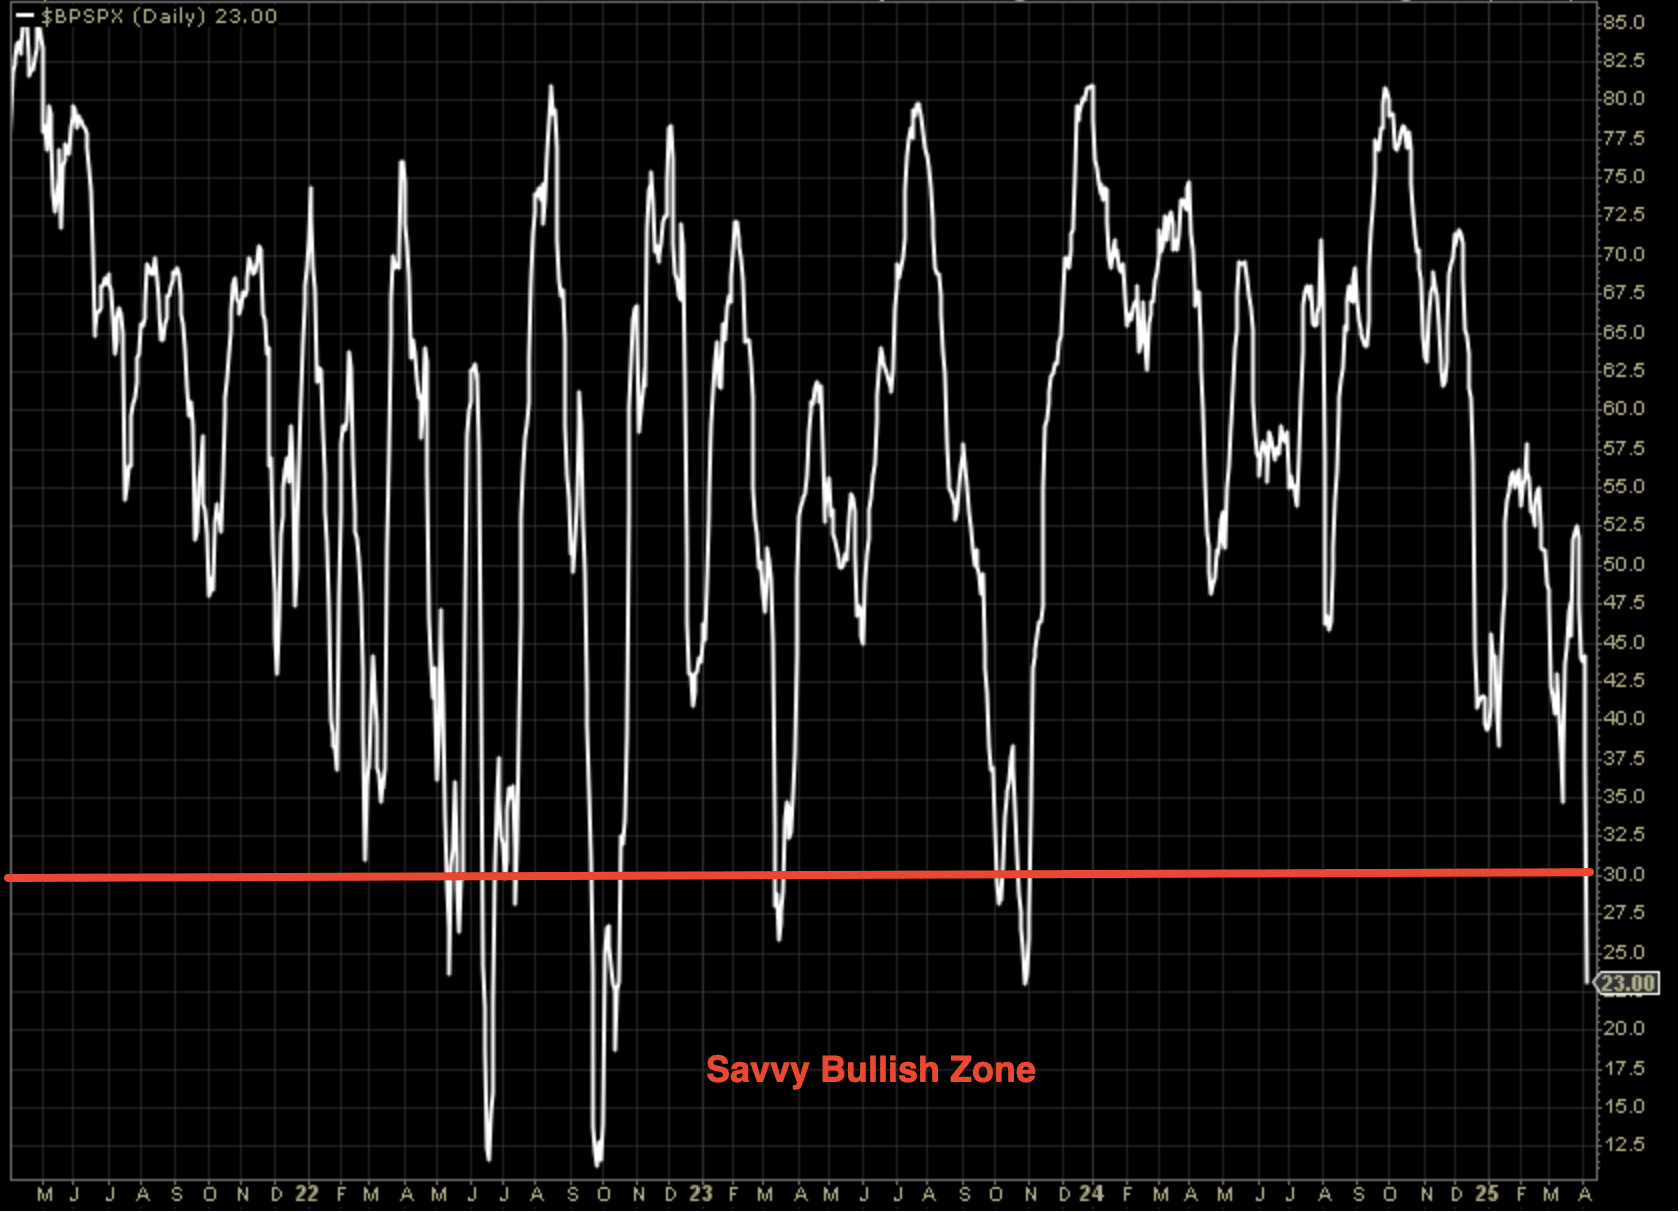
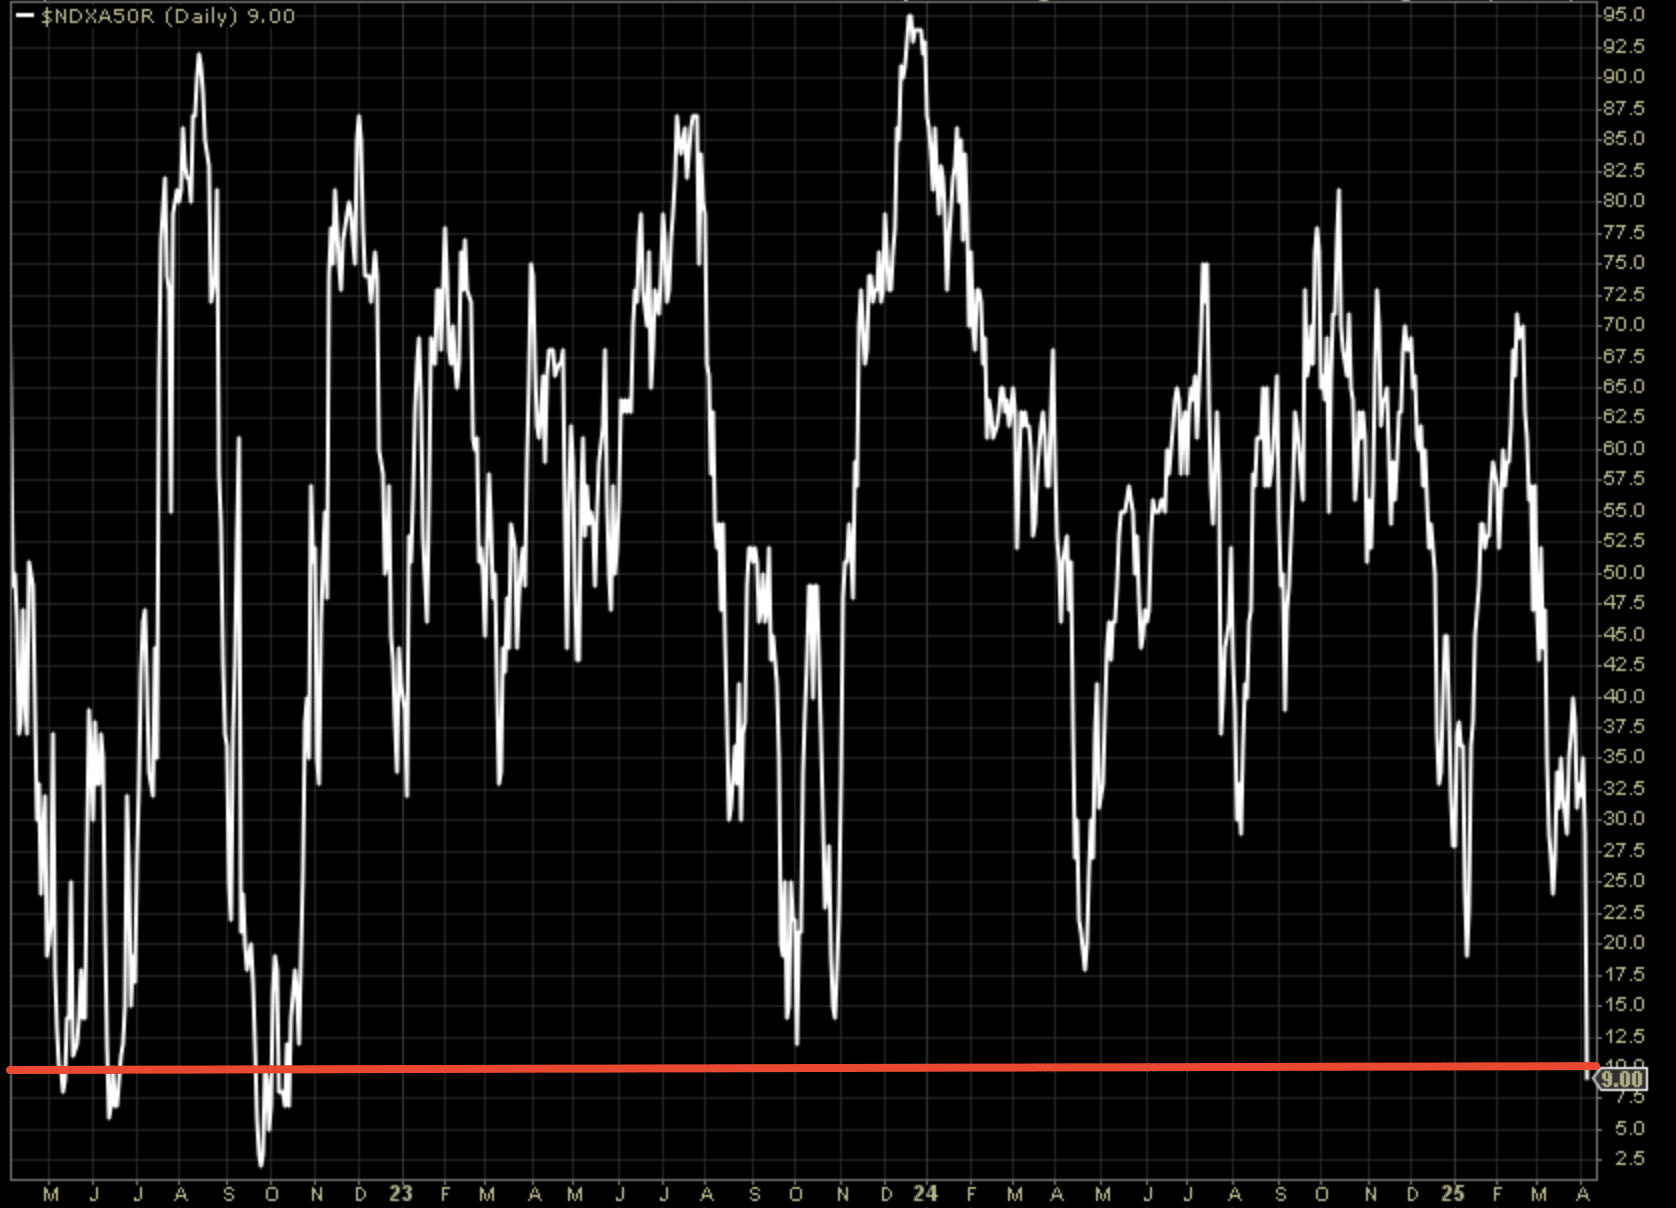
Almost All Bullish Percent Indices are now in oversold territory or what I more appropriately refer to as Savvy Bullish Zones.(Nasdaq 100 and S&P 500 Bullish Percent Indices depicted below)
Could these find lower levels? Yes! Should you still be buying? Yes! Historically, sentiment doesn’t survive in its current pessimistic/bearish state for very long.
Other index breadth stochastics paint a similar picture, simply confirming the litany of oversold and/or historic buy zones. The top chart identifies the percentage of stocks within the Nasdaq 100 trading above their 50-DMA, which has dropped below 10% for the first time since 2022’s bear market. If you had only bought that bear market, right?
The bottom chart identifies the percentage of stocks trading above their 20-DMA within the S&P 500. Had you bought every oversold condition since 2022, you either achieve a tradable bounce profit or the ultimate low in October of 2022. Again, I can’t predict whether or not buying the market this coming Monday will prove a trading profit or the ultimate low. That admission should inform investors to take advantage of cheaper prices regardless, but use the uncertainty to leave room for additional downside via how one position sizes their dip-buying regiment/s.”

Our June 8, 2025 Finom Group report underscores that Buy and Hold remains the only absolute strategy for achieving market returns, but that active cash management—deploying capital during corrections or oversold conditions—can enhance results when aligned with the core Buy and Hold principle. The April 6, 2025 analysis highlighted that, even as breadth and sentiment reached deeply oversold “savvy bullish zones,” investors should continue buying, since historically such pessimistic states are short-lived and tend to precede strong recoveries. Ex post, this guidance was validated: the S&P 500 bottomed on April 8, 2025, and those who followed behavioral heuristics—using market stochastics and evidence-based rules of thumb to buy during fear—were rewarded with a rapid, double-digit rally. The episode illustrates that while market timing is unpredictable, disciplined buying during corrections, rather than waiting for perfect signals or succumbing to pessimism, leads to superior long-term outcomes, as confirmed by both historical averages and the actual 2025 rebound. Finom Group’s approach of updating price targets (6,150 “by Q1 2026”) and outlooks during corrections, not rallies, further demonstrates the effectiveness of a weight-of-the-evidence, process-driven strategy over reactive or sentiment-driven investing.
Direct quote from Finom Group’s “Markets Dancing Toward All-Time Highs, But When The Music Stops…” Report (June 8, 2025):
Many corrective lows will produce breadth thrusts, all of which we’ve well outlined since they had actually triggered in late April and May of 2025.
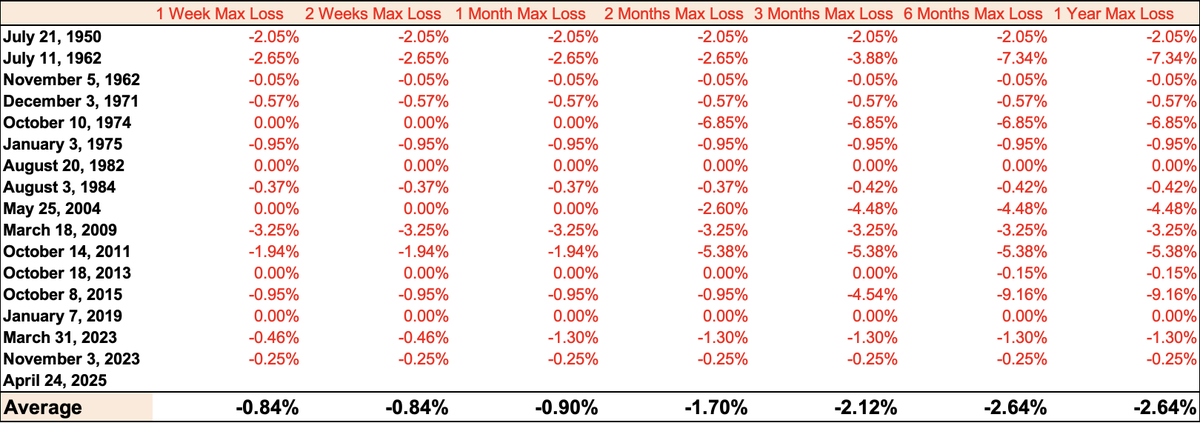
That’s a blistering amount of green on the table folks! I’m not saying that Warren’s technical bottom indicator can’t be proven right, but the weight of the evidence suggests if a technical bottom has not been achieved, then it DEMANDS reinforcing endogeny or a new exogenous event. Not Seth Golden, the weight of the evidence says what it says. Took ya’ll back to 2019 with this analysis 😉! There’s not much that gets passed us at Finom Group ✅, including MAXIMUM DRAWDOWNS from a Zweig Breadth Thrust:
From a practical portfolio management perspective, the history of the S&P 500’s post-ZBT performance also informs that it is the greatest “Buy The Dip” breadth thrust indicator. So if you think I’m not excited about a ZBT and won’t be buying future dips… com’on!
When reviewing the Max Drawdown table above, it is important for investors of all experience levels to recognize that the determination is a Maximum Decline from the closing price. For example: recall the ZBT from March 2023 and a correction of 10% actually starting the week of July 30, 2023. The correction, however, never got below the ZBT signal price date. So can there be a bigger pullback than what is evidenced in the Maximum Drawdown table above? Absolutely! But from what starting price is unknown. With that being said, a reasonable baseline expectation of savvy investors is always to be on the lookout for the next 5% pullback. Incorporating such an expectation into one’s game plan is best to include buying the decline at the index level. This is an “evidenced opinion” of course.”

The breadth thrusts triggered in late April and May 2025—specifically the rare Zweig Breadth Thrust (ZBT)—proved to be powerful signals for a durable market bottom and the start of a new bull phase. Historically, as outlined by Martin Zweig and confirmed in multiple studies, a ZBT is one of the most reliable technical indicators for identifying major market turning points, with post-signal S&P 500 gains averaging over 24% within 12 months and positive returns in nearly every instance over six- and twelve-month horizons. In 2025, this pattern held: after the ZBT, the S&P 500 not only avoided a deeper correction but also delivered strong, sustained gains, validating the Finom Group’s evidence-based approach that emphasized buying into breadth thrusts as “the greatest ‘Buy The Dip’ breadth thrust indicator.” While it’s possible for a larger pullback to occur after a ZBT, the historical maximum drawdowns following such signals have been limited, and the market almost never revisits the signal price on a closing basis. The experience of 2025 reinforced that, for practical portfolio management, these rare thrusts are high-probability opportunities to increase exposure, and waiting for further downside after such signals usually results in missed gains rather than improved risk-adjusted returns. This outcome highlights the importance of trusting robust technical evidence over skepticism or the hope for a perfect entry, especially when breadth thrusts coincide with maximum pessimism and oversold conditions.
Direct quote from Finom Group’s “Markets Dancing Toward All-Time Highs, But When The Music Stops…” Report (June 8, 2025):
With these significant breadth signals completed by mid-May, and alongside their “positivity percent rates”, we moved to analyze the forward average returns and to formulate an S&P 500 price target objective. These breadth thrusts are just pieces of larger price target modeling, but significant pieces. Forward earnings estimates, inflation data trends, historical analogues, and price cyclicality also go into the Finom Group model. We would like to suggest that this is a uniform Wall Street practice, but it certainly isn’t. If it were, there would not have been so many, and early in the year, Wall Street price target modifications, which Seth presciently predicted at the onset of 2025:
“After reading the majority of strategists’ reports, examining their price targets and rationale for said price targets, also analyzing price-trend and cyclical price data, I have X-out those price targets which have limited to no supportive price-trend/cyclical price rationale. In other words, such price targets demand a unique occurrence, Dotcom period price replication. Always a probability!” (December 30, 2024)
By March, strategist will begin slowly revising downward their 2025 price targets. No, I take no victory lap in suggesting +6500 targets had no merit based on price history, and no the targets cuts are not about FY2025 EPS, as EPS does not correlate to 12-month forward SPX. As I have been disseminating to Finom Group members, there is no historic data that aligns for price targets above 6,500, despite Wall Street’s heralding. The market follows, more often than not, a fund flow cycle that is very, very repetitive and predicated on a number of variables, once again outlined to Finom Group members since October of 2024. ~Seth Golden January 10, 2025
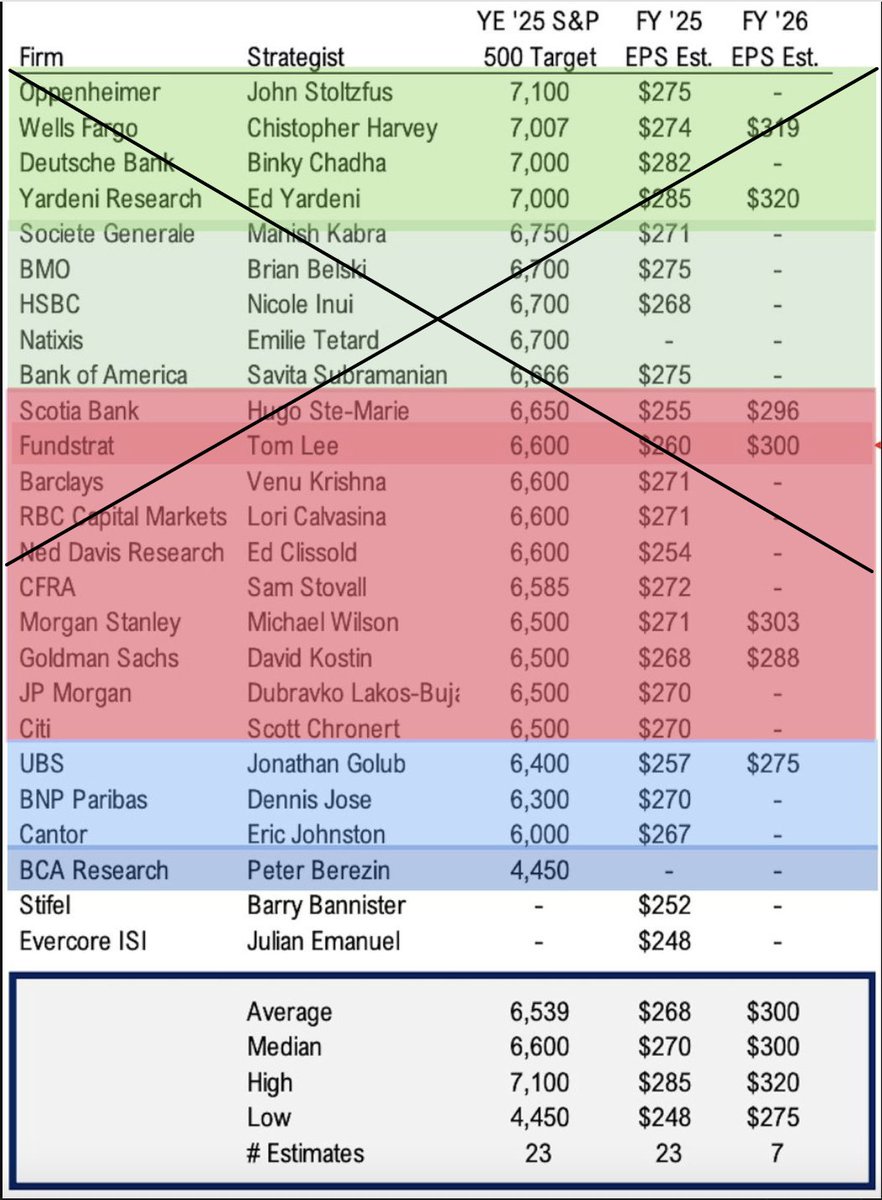
Cyclical data NOT informative of 6,700+ price levels, for whatever its worth!
Direct quote from Finom Group’s “Markets Dancing Toward All-Time Highs, But When The Music Stops…” Report (June 8, 2025):
We were NOT bearish coming into 2025, we simply understood and calculated the price cyclicality, trends since 2023, and then some! It’s a whole lot to basically suggest that a great deal of what we’ve outlined within and since our 2025 Outlook report was published has come to fruition (post below from December 5, 2024).
It is not a whole lot to take some self-inventory now with the S&P 500 back at 6,000 and offer that even Finom Group’s Seth Golden did not hold the opinion 6,000 would occur this quickly, and seemingly without interruption.

Direct quote from Finom Group’s “Markets Dancing Toward All-Time Highs, But When The Music Stops…” Report (June 8, 2025):
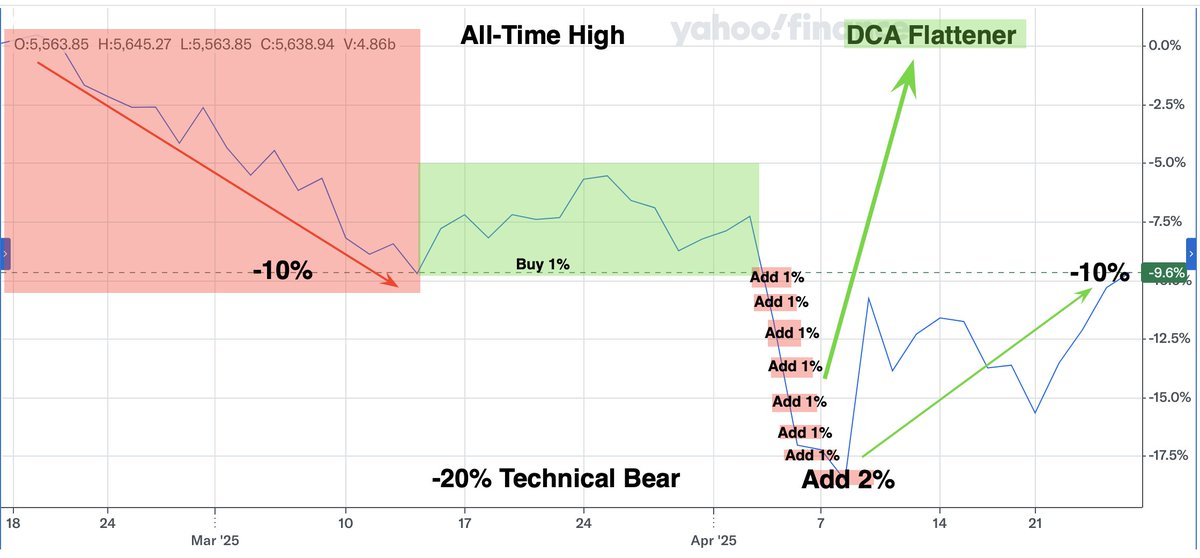
It doesn’t matter though! That’s right; it doesn’t matter! How quickly the market retraced from 4,900 back to 6,000+ is quite irrelevant, what mattered most was how investors behaved since the -10% correction threshold we had well-forecasted for 1H 2025. If it didn’t take on some form of the following game plan…
Speaking of game plans… the rendering of a game plan below is that of how the average investor/trader could have benefited from the current correction/bear market.
Speaking to an index ETF portfolio only(which we understand is not the typical portfolio), had you bought +1% for each -1% downside in the technical bear market, an index ETF portfolio would be up 📈 +4% since the former ATH while the S&P 500 remained -10% from the former ATH and down -3.3% YTD (+2% add at bear market, chart and annotations from 8/28/2025). This dollar-cost-averaging exercise would have helped the average investor/trader outperform the market, get back to even quicker than the market, and now finds the index ETF portfolio with gains on the year. Additionally, this dollar-cost-averaging exercise is why I(Seth Golden)often suggest there is no such thing as a bad market, only lost opportunity. It’s the lost opportunity that investors often accrue and compound, with great misfortune. DON’T find yourself amongst this herd of sheep 🐑!
Direct quote from Finom Group’s “Markets Dancing Toward All-Time Highs, But When The Music Stops…” Report (June 8, 2025):
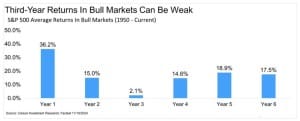
What we are doing by analyzing multiple quant studies is known as cross-referencing data/quants. This can often help to deliver even greater certainty or probabilities, sometimes even exclude probabilities. The following is an example of such exclusionary results, by way of the price cyclical data related to Year 1 of a 4-year presidential cycle, and only that period of the cycle.
What we can see from within the BofA Global Research chart is that June is a subdued month for the S&P 500, generally barely delivering a positive return.

Direct quote from Finom Group’s “Markets Dancing Toward All-Time Highs, But When The Music Stops…” Report (June 8, 2025):
What we can see from within the BofA Global Research chart is that June is a subdued month for the S&P 500, generally barely delivering a positive return. As noted in the chart, this data goes all the way back to 1928. If we only go back to 1950, however, the S&P 500 averages a negative return for the month of June, down more often than not as well.

Direct quote from Finom Group’s “Markets Dancing Toward All-Time Highs, But When The Music Stops…” Report (June 8, 2025):
The seasonal and quantitative data above is obviously limited to a finite period, and is completely void of the current price trend. Has the market followed the price path for a post-election year in 2025? No, not entirely, but it has quickly gotten back on course! That is where we recognize that such seasonal price paths are an average, not an outlook but a baseline expectation; what we might expect to see in price not what we are guaranteed to see occur, based on post-election years. So what if we add or cross-reference the post-election year price cycle with something broader in scope?
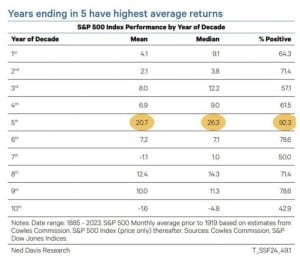
I usually turn to NDR’s Cycle Composite, which is a mashup of all the 1-year, 4-year, and 10-year decennial cycles since 1900. As I’ve pointed out a time or 100 over the years, the trend projections of this work is usually pretty good; sometimes scary good. After getting off course in early 2025, however, the S&P 500 has quickly gotten back on course! This is a much broader rendering of price cyclicality and bodes favorably for the early summer and into fall months. Again, even this is an average rendering of price cyclicality!

Direct quote from Finom Group’s “Markets Dancing Toward All-Time Highs, But When The Music Stops…” Report (June 8, 2025):
In the NDR Cycle Composite, of course is the Cycle Composite in blue and YTD S&P 500 performance in orange, for which the YTD performance is back on path. As such, we are recognizing the price trend in 2025. And as such we can now cross-reference further with the quant study below from Steve Deppe:
When the S&P 500 ends a 3-month losing streak by gaining 5%+ in month #4 (May), good things tend to happen in the following month. The S&P 500 is positive 1-month forward EVERY. SINGLE. TIME. and 100% of the time 10-12 months forward. Any intra-month (June) consolidation is a likely buying opportunity. Recall, price would need to finish June above 5,911 to remain with a 100% positivity rate. If price dips below 5,911 intra-month, it is a likely buying opportunity at the index level.

Direct quote from Finom Group’s “Markets Dancing Toward All-Time Highs, But When The Music Stops…” Report (June 8, 2025):
All of our quant and price cyclicality data checks out positively for investors in June, despite the post-election year tendencies. The savvy investor remains optimistic and a buyer of dips, according to the analytics performed. As a reminder, exogeny/endogeny can prove disruptive. Remain flexible and open-minded to a wide range of outcomes, but always lean into the greater probabilities with one’s portfolio as a discipline. 💯
Moreover and as we’ve also outlined since 2020’s market recovery cycle, analogues are quite consistent.
“Could the market still deliver double-digit returns? Absolutely, however, we think the best emotional quotient is one that attaches and leans into positivity rates more so than average or median returns. What might a double-digit return look like?
The Nasdaq Dotcom analogue is broadly, and almost eerily, tracking its mid-1990s experience in terms of its bull run and occasional pullbacks. Since the Nasdaq’s low in December of 2022, it’s up +73%. That’s close to the Nasdaq’s +68% gain over the same period from the start of 1995. If we think about the Nasdaq’s bear market correction that just took place, keep this in mind: The S&P 500 and Nasdaq are currently up more than +20% from their lows just 6 short weeks ago! Six week sprints of +20% or more from the low 6 weeks ago are extremely rare. All we got is April 2020, November 1998, and November 1974. Coincidence that such a correction and“correction of the correction” happened during the Dotcom bull market as well, which was also part of the Finom Group 2025 Outlook?”
With the aforementioned analogue still in play and even part of the long-term Golden Capital Portfolio playbook, the following analogue reiterated in 2025 is the one I’m more closely tethered and focused:
We’ve discussed the 2009s and 2020s analogue since Covid 2020. Finom Group members can review our Covid 2020 macro-market Research Reports to discover the origination and tracking of the 2009s and 2020s analogue by utilizing the Research and Reports tab atop the Home page, and simply scroll back to 2020 publications. Back then, the analogue assumed that if the 2020 recovery was going to track the 2009 recovery, the S&P 500 would then achieve 3,761 by year-end. 3,760 proved the high of the calendar year, closing the year at 3,756. Still don’t believe in “scheduled fund flows”??
Fast forward to 2025, using the same analogue, and here is what the updated analogue looks like:
But Trump: It’s in there! But stagflation: It’s in there! But rising yields: It’s in there! But tariffs: It’s in there! Can the analogue deviate or over-exaggerate from time to time, as they did with the 2025 exaggerated continuation and then downside move? Yes, but if you don’t believe that as quickly as the negative endogenous fiscal policy/tariff was relieved that markets would just as quickly remedy the technical bear market, then you don’t believe in scheduled fund flows or such analogues. It’s that simple. Remember, we do these things to ourselves out of fear, doubt and supposed risk management.


Direct quote from Finom Group’s “Markets Dancing Toward All-Time Highs, But When The Music Stops…” Report (June 8, 2025):
Because human behavior is quite repetitive, analogues are useful investor tools. They shouldn’t be the sole tool of an investor, THE decision-making tool, but rather one of the tools in the toolbox of a savvy investor. All analogues are created equally, after all they are are simply pattern recognition of chosen time periods.
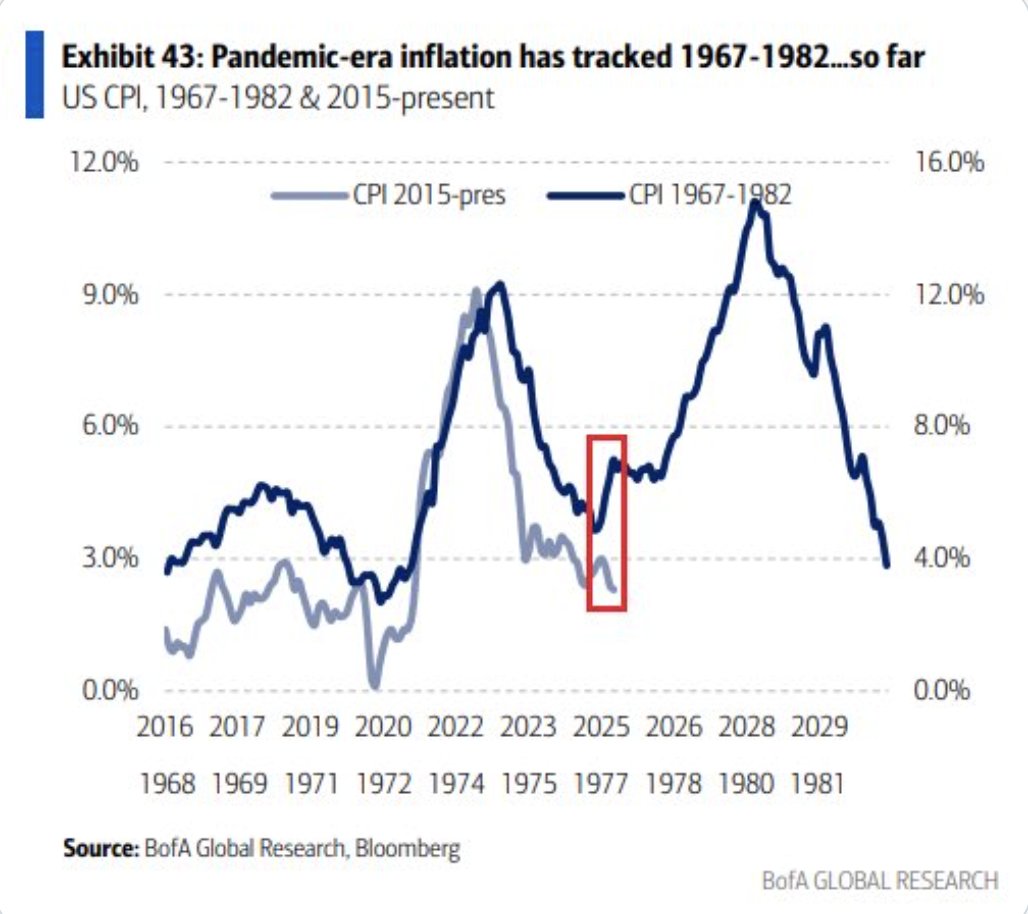
The most correlated macro-economic variable to S&P 500 price action has always been inflation. It has been why the 2022 inflation spike and price action thereafter has been followed so closely, and has found many market participants tracking the 1970s – 1980s inflation regime.
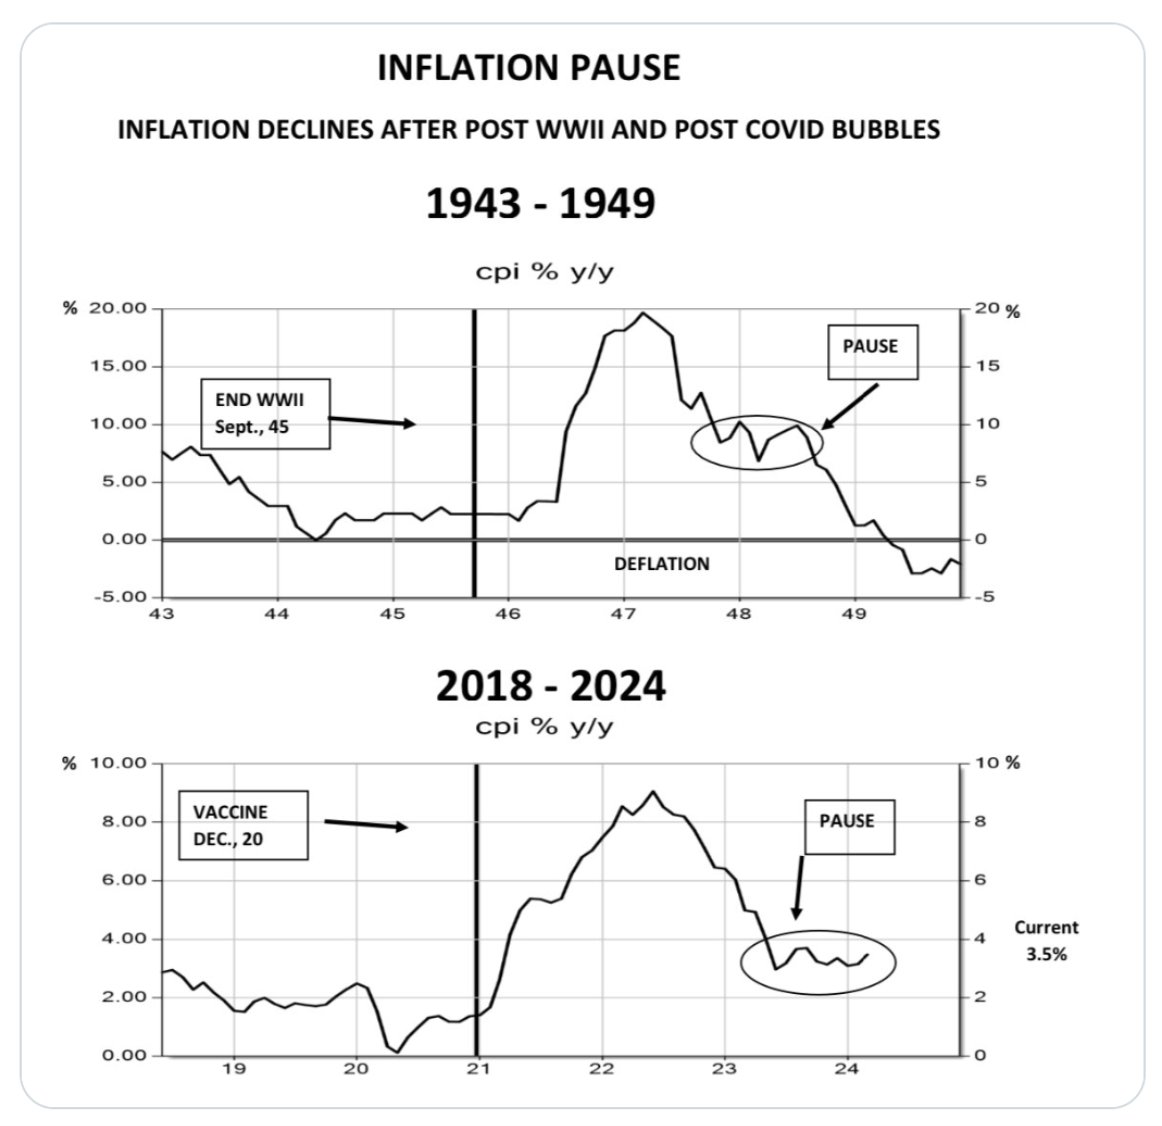
While it is fair to suggest that the present day inflation regime has mirrored its predecessor, more recently there has been a divergence in the analogue, as depicted in the chart above. We never favored this analogue at Finom Group, given the former inflation regime was stimulated by an endogenous event (Saudi Oil Embargo), and with the most influential inflation variable lacking for a like regime today. Instead, we favored the 1940s post-WWII era inflation regime that we analyzed in 2024 and as depicted below.
Like the post-WWII inflation boom/bust cycle, there was an intermediate “pause” before disinflation resumed. The 1H 2024 disinflation pause concerned many market participants whom expected a second wave of inflation akin to the 1970s – 1980s inflation regime. But again, without a commodities inflation spike, mostly an impossibility to not disinflate after the pause, and that is exactly how it has played out since 1H 2024 (Garzarelli Capital chart).
Direct quote from Finom Group’s “Markets Dancing Toward All-Time Highs, But When The Music Stops…” Report (June 8, 2025):

While most Wall Street strategist DID NOT have 5,600s or lower as part of their 2025 playbook, we certainly did when recognizing a high probability afoot for a 10%+ correction in 1H 2025. The Whaley Breadth Thrust maintains a perfect 💯 track record 12-months forward. On the July 16, 2025 signal date the S&P 500 closed at 5,667. It’s quantifiably accurate to forecast the S&P 500 higher than the signal date price, given the Whaley Breadth Thrust occurrence.
Direct quote from Finom Group’s “Markets Dancing Toward All-Time Highs, But When The Music Stops…” Report (June 8, 2025):
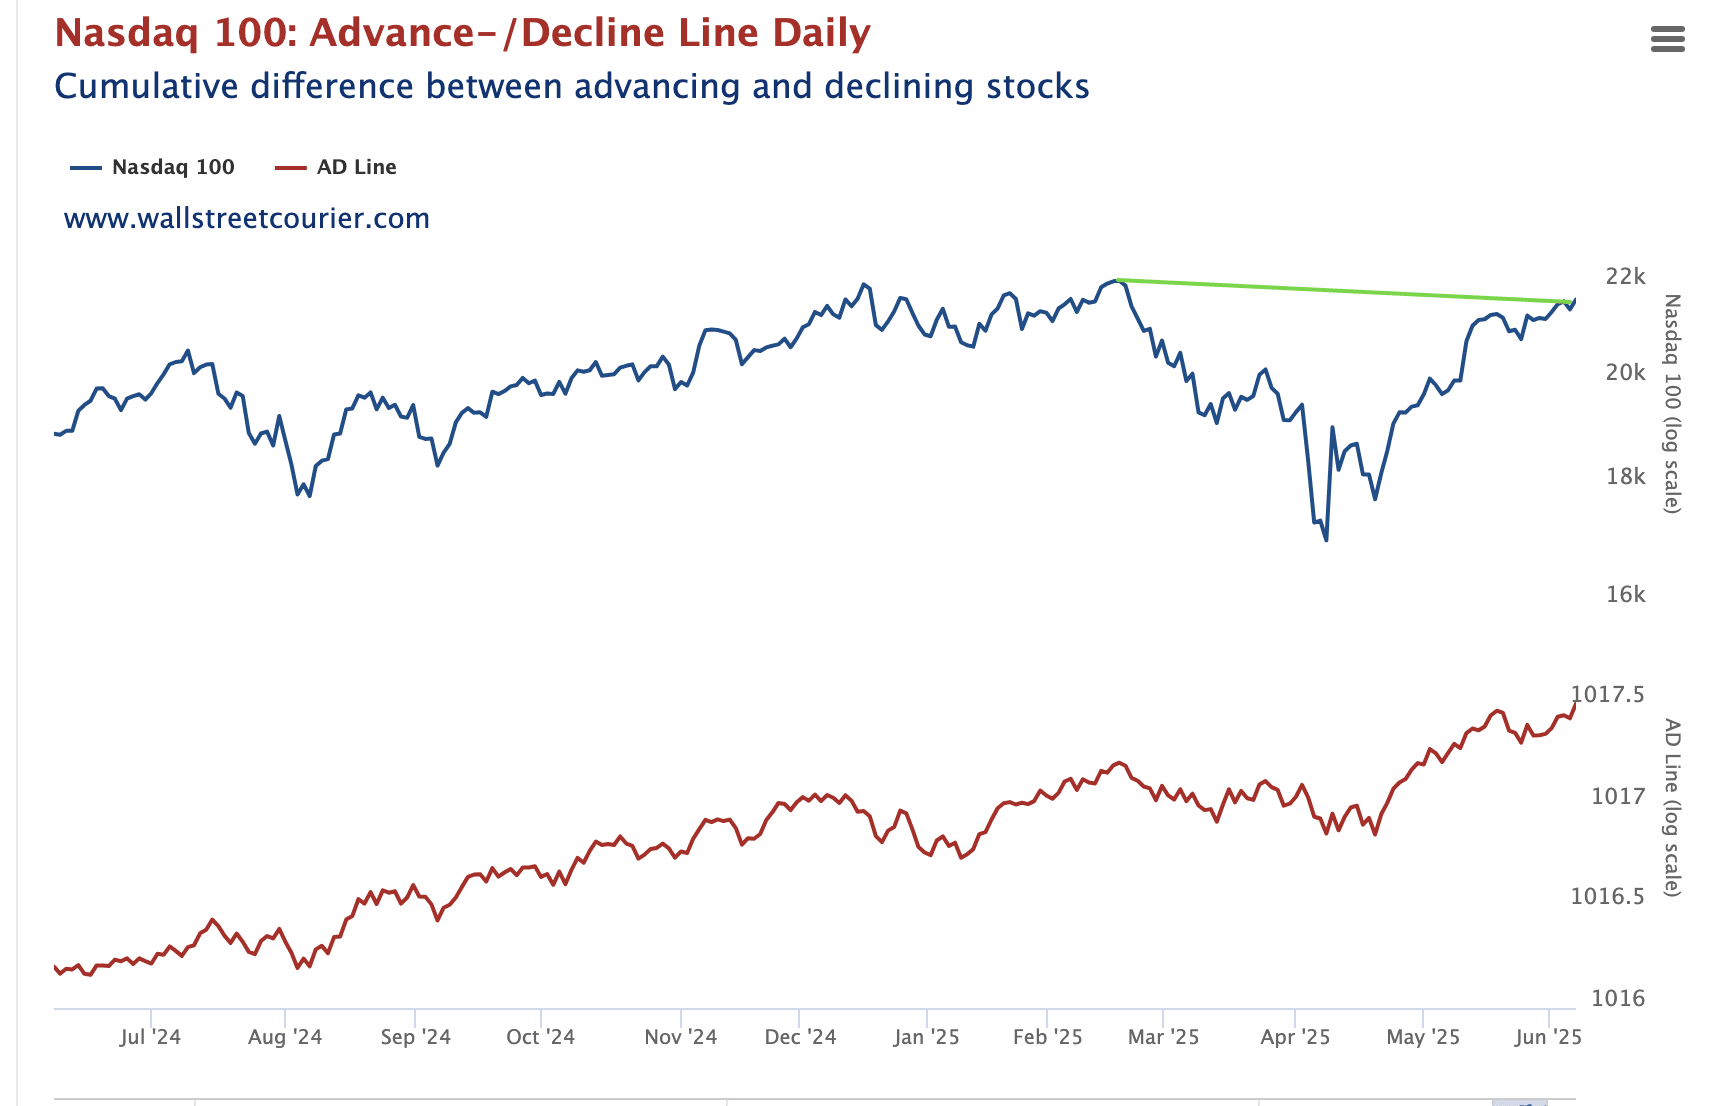
Moreover and as it pertains to Growth indices, we had formerly recognized that both the S&P 500 and NYSE Advance/Decline Lines made new all-time highs. Initially, this became part of the overheated/overbought market characteristics that resulted in a brief pullback, before indices found higher recovery-highs. As of this past week and with Growth leading the totality of the markets’ recovery cycle, the Nasdaq 100 achieved another all-time high Advance/Decline Line, and the 2nd in the index’s recovery cycle without the index itself achieving an all-time high.
While there may be some sustained overheated/overbought conditions within the Nasdaq 100 that could deliver a consolidation akin to the mid-May price consolidation period, we recognize the new all-time high in the Advance/Decline to be a harbinger of higher-highs to come for the Nasdaq 100 itself. I have been using periodic weekly Nasdaq volatility to buy dips in TQQQ, selling on the rips and while maintaining a long-term QQQ core holding. The TQQQ trading regiment allows for compounding returns, without the demands of long-term capital allocation.
Aged well… 😉 $SPX batter up!
Direct quote from Finom Group’s “Markets Dancing Toward All-Time Highs, But When The Music Stops…” Report (June 8, 2025):
Two 2️⃣ Additional Points Of Analysis With Respect To The Nasdaq 100’s Leadership
-
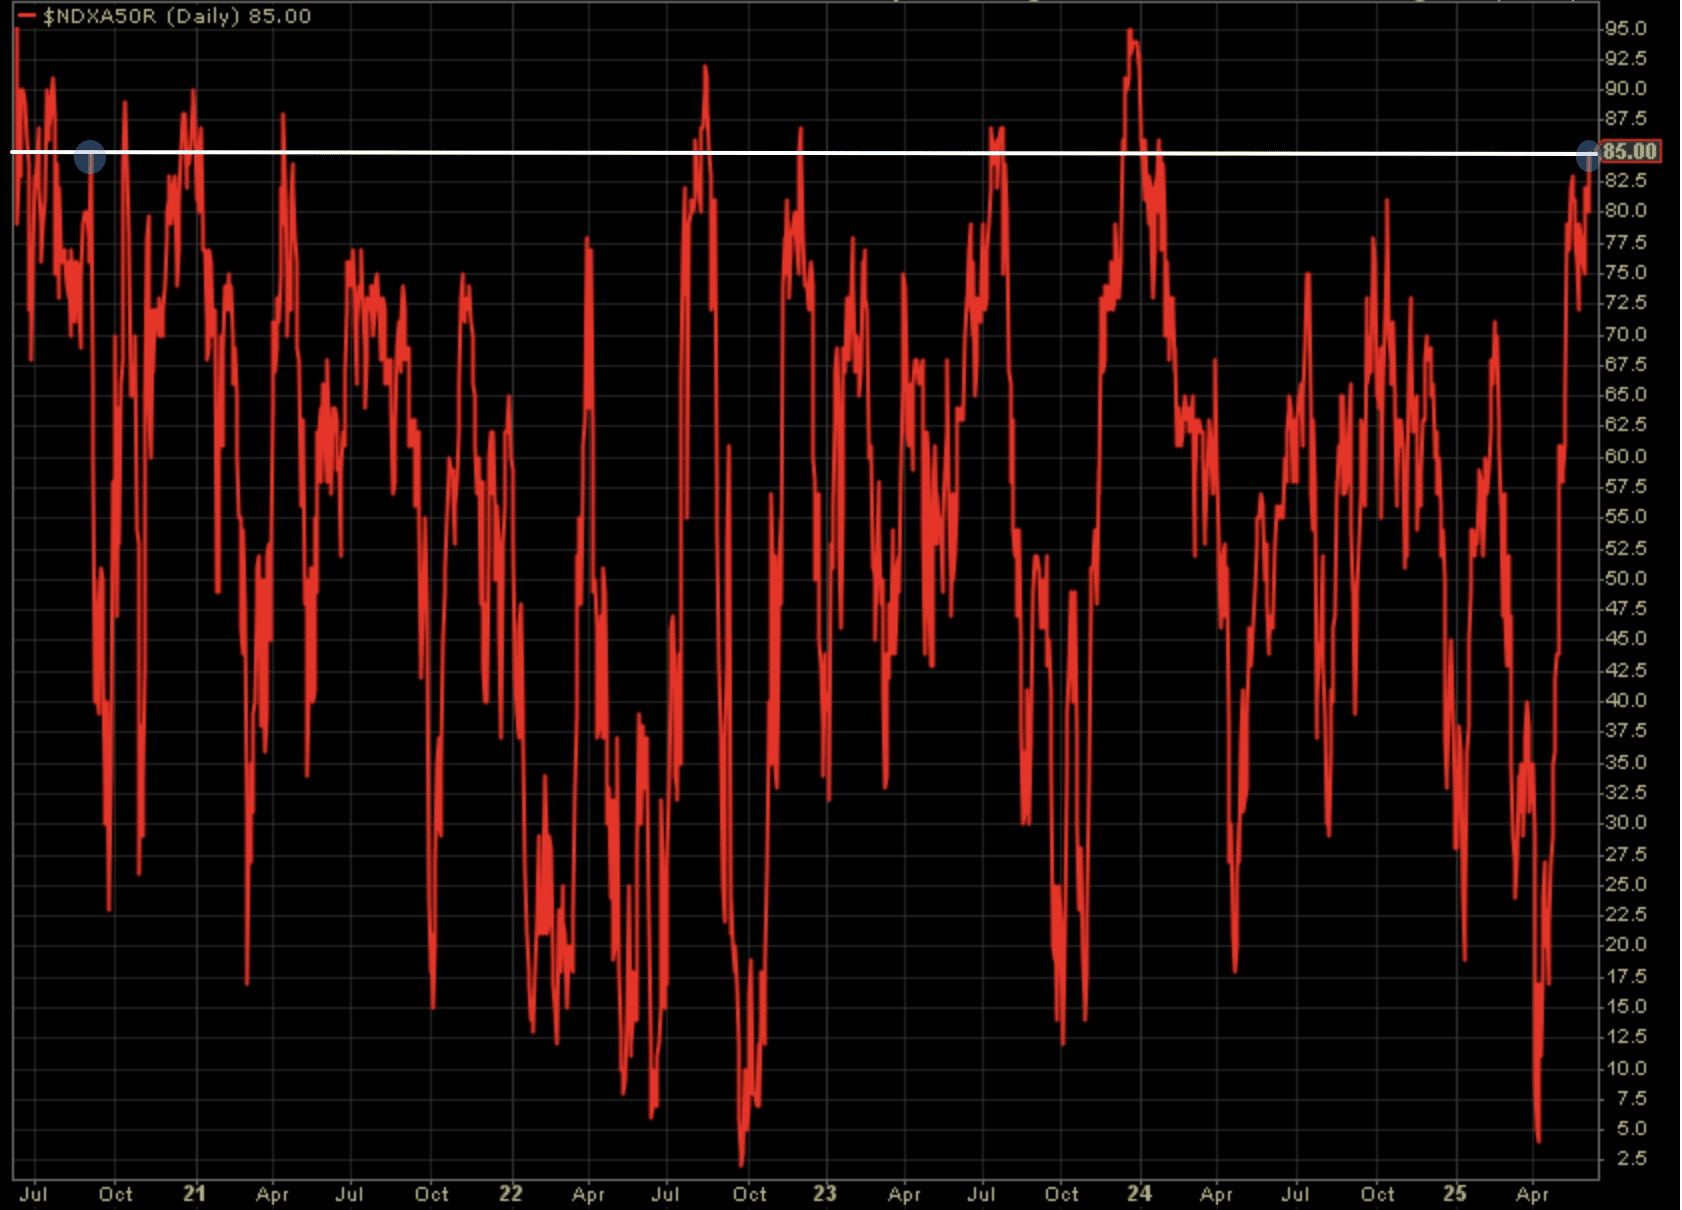
The percentage of stocks trading above their 50-DMA hit 85% and a recovery cycle high this past week.
-
Only one other time has it stopped here, without going higher (blue shaded).
-
There may be one final push higher, but overheated/overbought conditions are presented for the sake of recognizing future pullback potential.
Direct quote from Finom Group’s “Markets Dancing Toward All-Time Highs, But When The Music Stops…” Report (June 8, 2025):
Final Thoughts
In 2024, we recognized the distant potential for a severe market correction, not just within our 2025 Outlook report but throughout the year and by way of the Nasdaq Composite High-Low Logic Index. The extreme reading held a high probability that a severe correction would occur within the forward 9 – 12 months period. And so it did (Please use the Finom Group search engine and key words with quotes “High-Low Logic” to discover past reporting on the stochastic issued February 2024. Rendering and quant below).
The reason I bring this to investors’ attention is to further reiterate primarily that investors should always be prepared, with cash on the sidelines, to take advantage of large corrections as a form of risk management and discipline. The following is not a forecast, but an early consideration for future large corrections akin to our early consideration of the High-Low Logic Index last year.
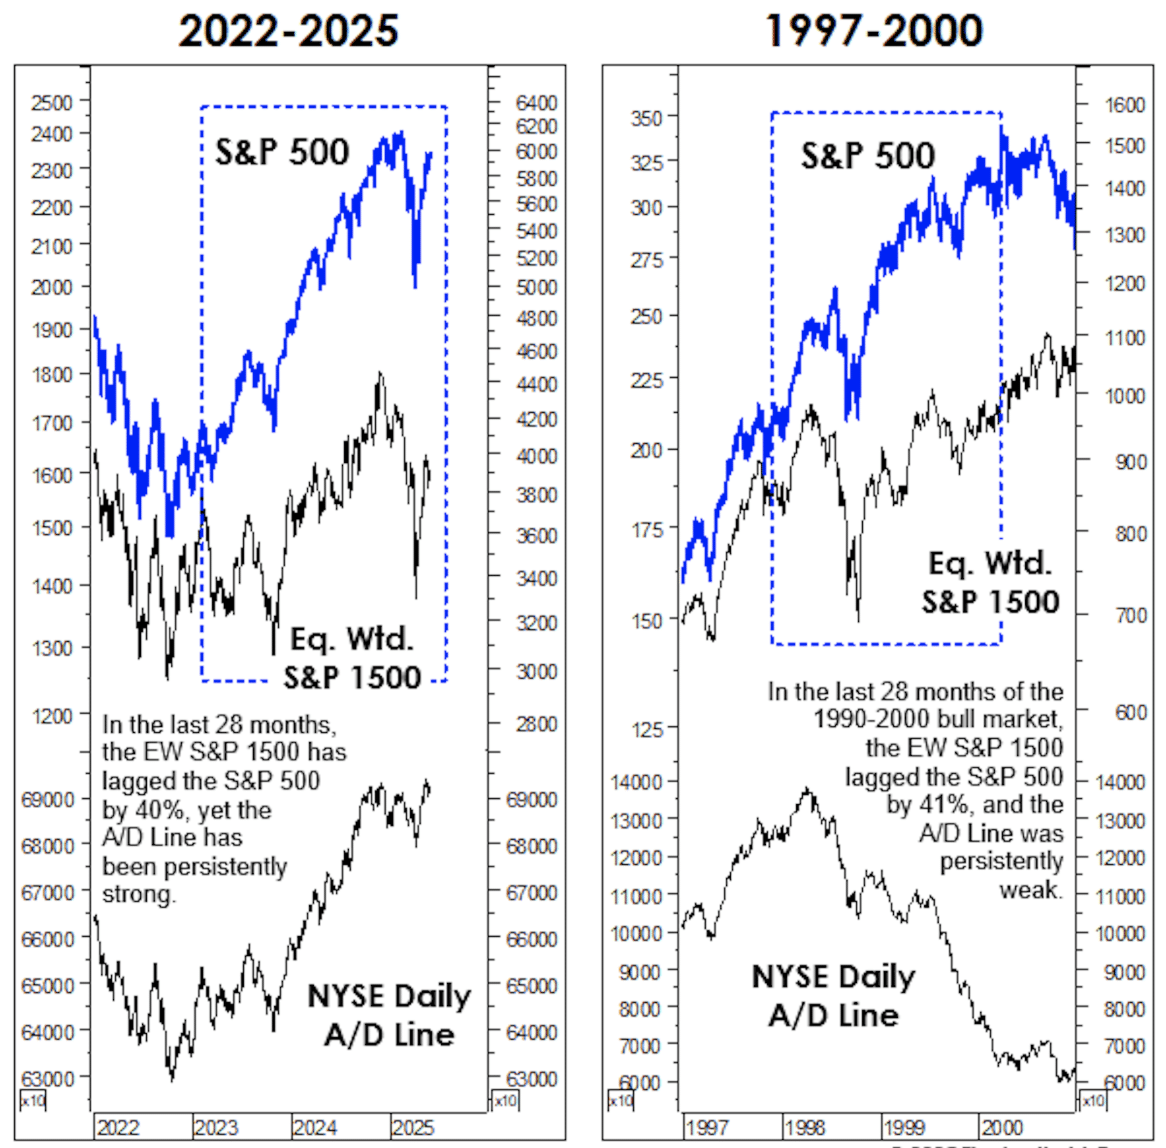
We’re trying to draw the obvious parallels between the currently bifurcated stock market and that of the late 1990s Dotcom period, which is why we’ve continued tracking the analogue. But here, we do it solely to illustrate that the NYSE Daily Advance/Decline Line may be giving a too-rosy a picture to market technicians.
Some would argue the bull market made an “internal” peak in mid-May, when the NYSE A/D Line made a new all-time high. The conventional view would be that the “external” peak (S&P 500 and DJIA) should, therefore, be at least a few months away. Yet, despite the relentless ascent of the A/D Line, the Equal-Weighted S&P 1500 has gained a mere 2.5% since February 2, 2023. The S&P 500 is up 42.1% during that same 28-month period.
For what it’s worth, there was a nearly identical return gap between these two measures during the final 28 months of the 1990-2000 bull market. (The S&P 500 gain between November 24, 1997 and March 24, 2000 was 61.4%, versus +20.4% for the Equal Weighted S&P 1500.)
As shown in the charts, however, the A/D Line provides radically different renderings of these otherwise analogous episodes. From 1997 to 2000, the A/D Line probably understated the market’s internal strength, and most stock market technicians cried “wolf” too early. Today, though, the NYSE Daily A/D Line clearly overstates the underlying health of the market, and technicians who rely on this measure are missing the fact that a terminal “distribution” phase in the market has likely been underway for a long time. This is a major reason why being a stock picker in the current bull market period, and since Covid, is a really, really bad idea.
The Artificial Intelligence boom is likely going to disrupt and disengage the population from certain goods and services in the coming years, likely rendering hundreds if not thousands of company goods and services unusable, with such business operations and company stocks displaced and delisted. It was hard for the media to imagine such an outcome during the Dotcom boom, but the market internals/technicals were signaling this very outcome, which was ultimately realized in the Dotcom bust. There are nearly half as many stocks publicly traded since the Dotcom bust. Simply put, most stocks never recover. The Equal-weight S&P 1500 may be signaling a repeat, even if the A/D Line isn’t… or hasn’t yet? This is not a present-day red flag, but rather a recognition that the music (A/D line at all-time highs) is still playing, just don’t get too crazy dancing with individual stocks in your portfolio.

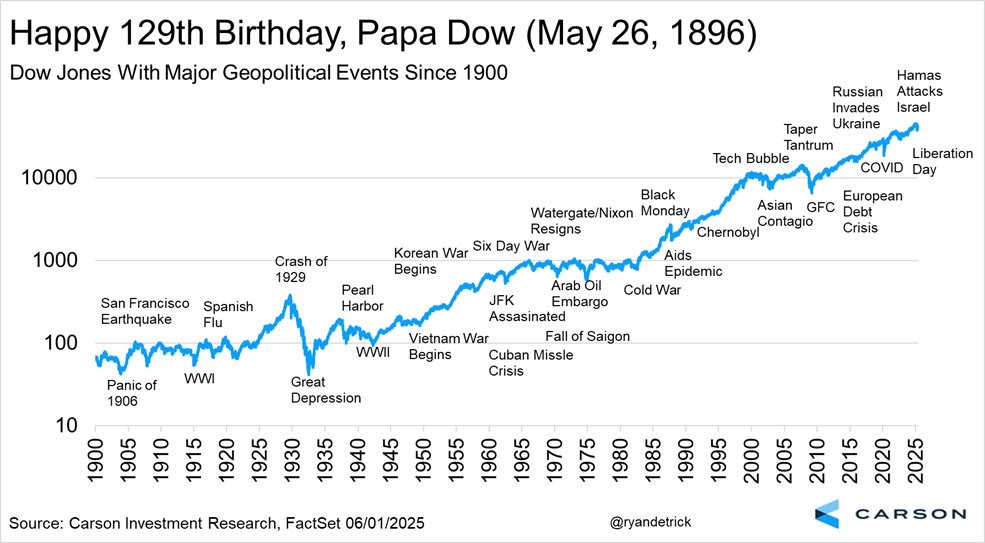
Direct quote from Finom Group’s “A Year of Endogeny And Exogeny” Report (June 15, 2025):

“Geopolitical events have often created short, sharp market shocks, but with little lasting impact beyond weeks,” says the Deutsche team led by strategist Jim Reid. After the initial anxiety dies down the macroeconomic drivers take back control. So on this basis you should generally buy into geopolitical risk,”. But they add: “The question is whether we’re entering a new phase given that tensions are rising, or whether geopolitical risk continues to create more fear than reality.”
Direct quote from Finom Group’s “A Year of Endogeny And Exogeny” Report (June 15, 2025):
Put any reason you desire before realizing cheaper prices and the behavioral demand of the savvy investor is to recognize cheaper prices as a buying opportunity. Charts and annotations like that of the one from Carson Research are simple reminders to investors on how to behave when cheaper prices arrive, regardless of what headlines are driving cheaper prices. While it may feel uncomfortable to buy WHEN prices are faltering, that sensation informs the savvy investor they are DOIN’ IT RIGHT!
Direct quote from Finom Group’s “A Year of Endogeny And Exogeny” Report (June 15, 2025):
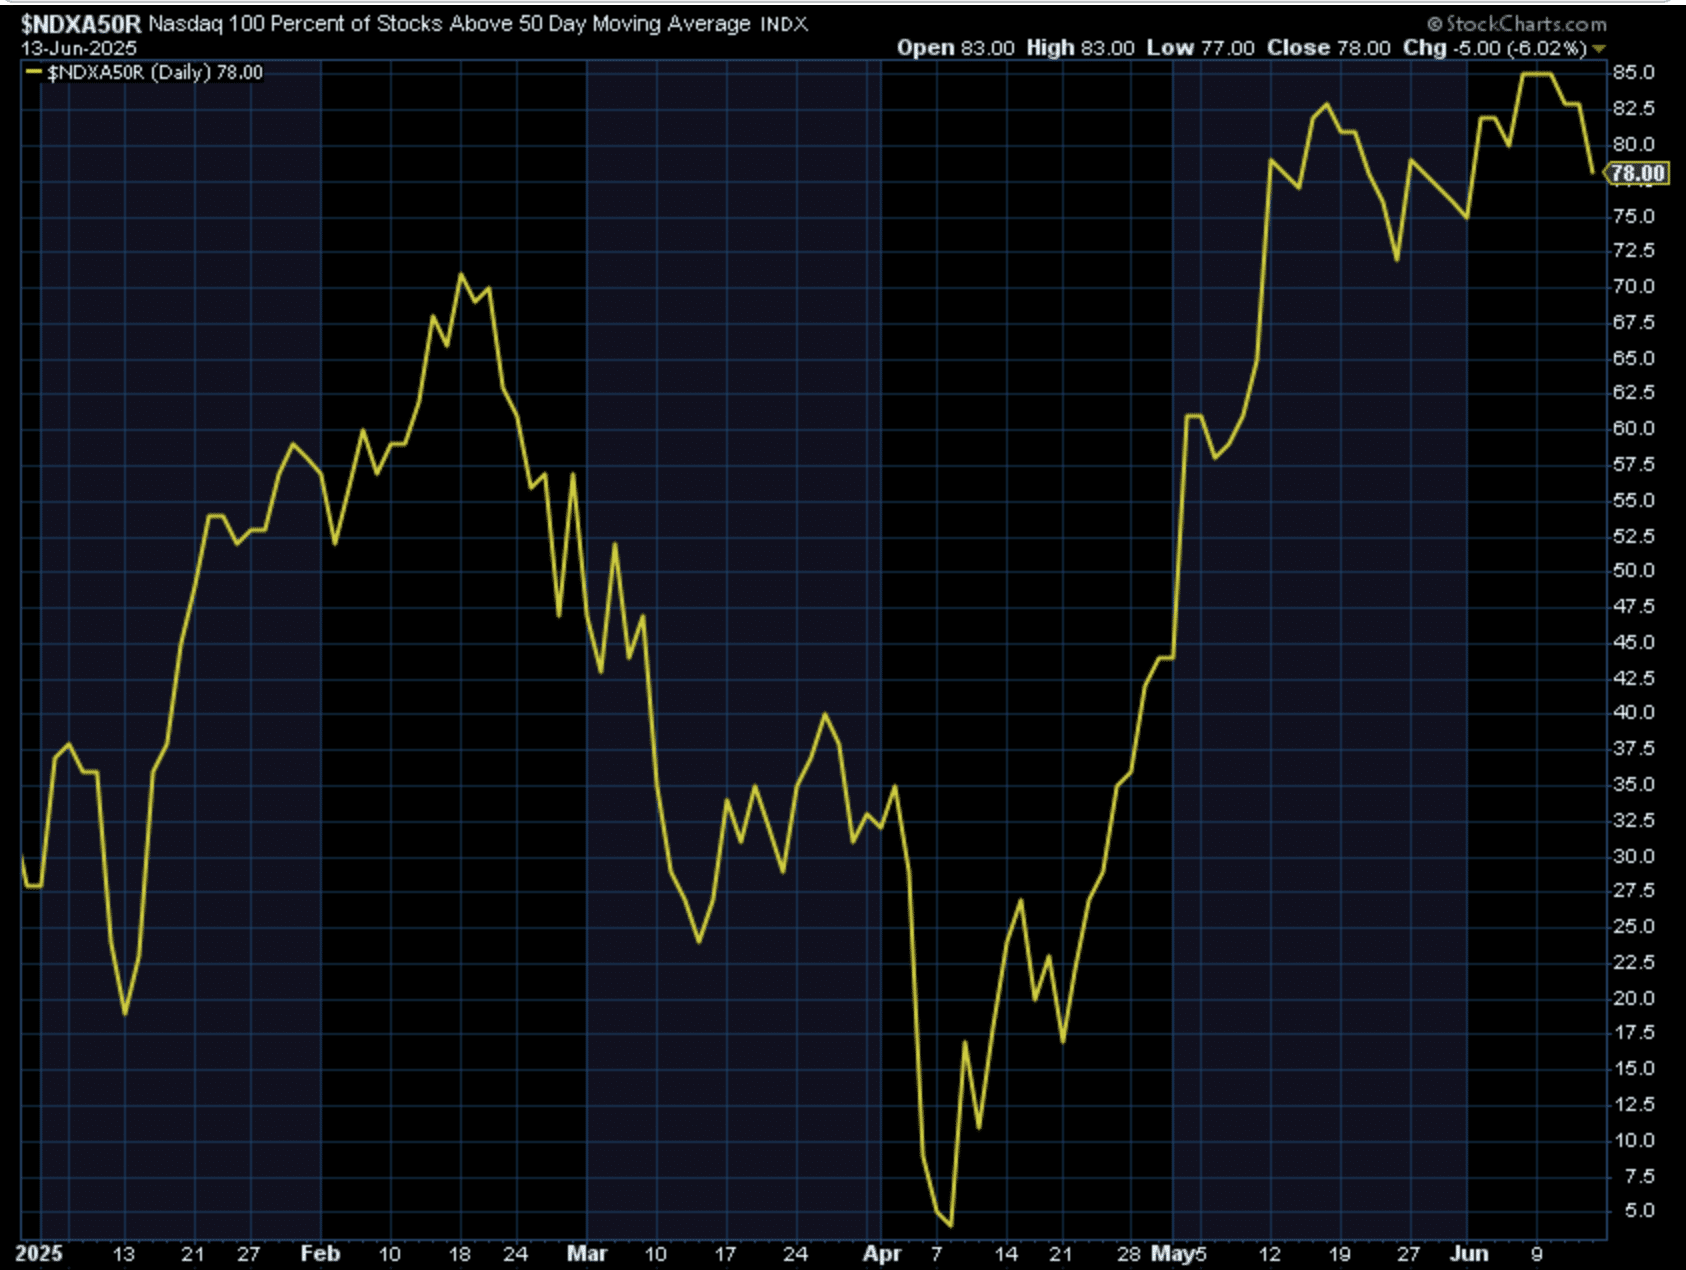
These factors informed that while there was a reasonably high probability for the uptrend to persist this past week, we would also not prove wise to chase it higher, but rather allow our core long holdings to benefit from additional upside and possibly locking-in more profits. Our discipline was rewarded by week-end. Nasdaq %age of stocks trading above their 50-DMA did in fact stop at the 85% level this go round as depicted in the chart below:
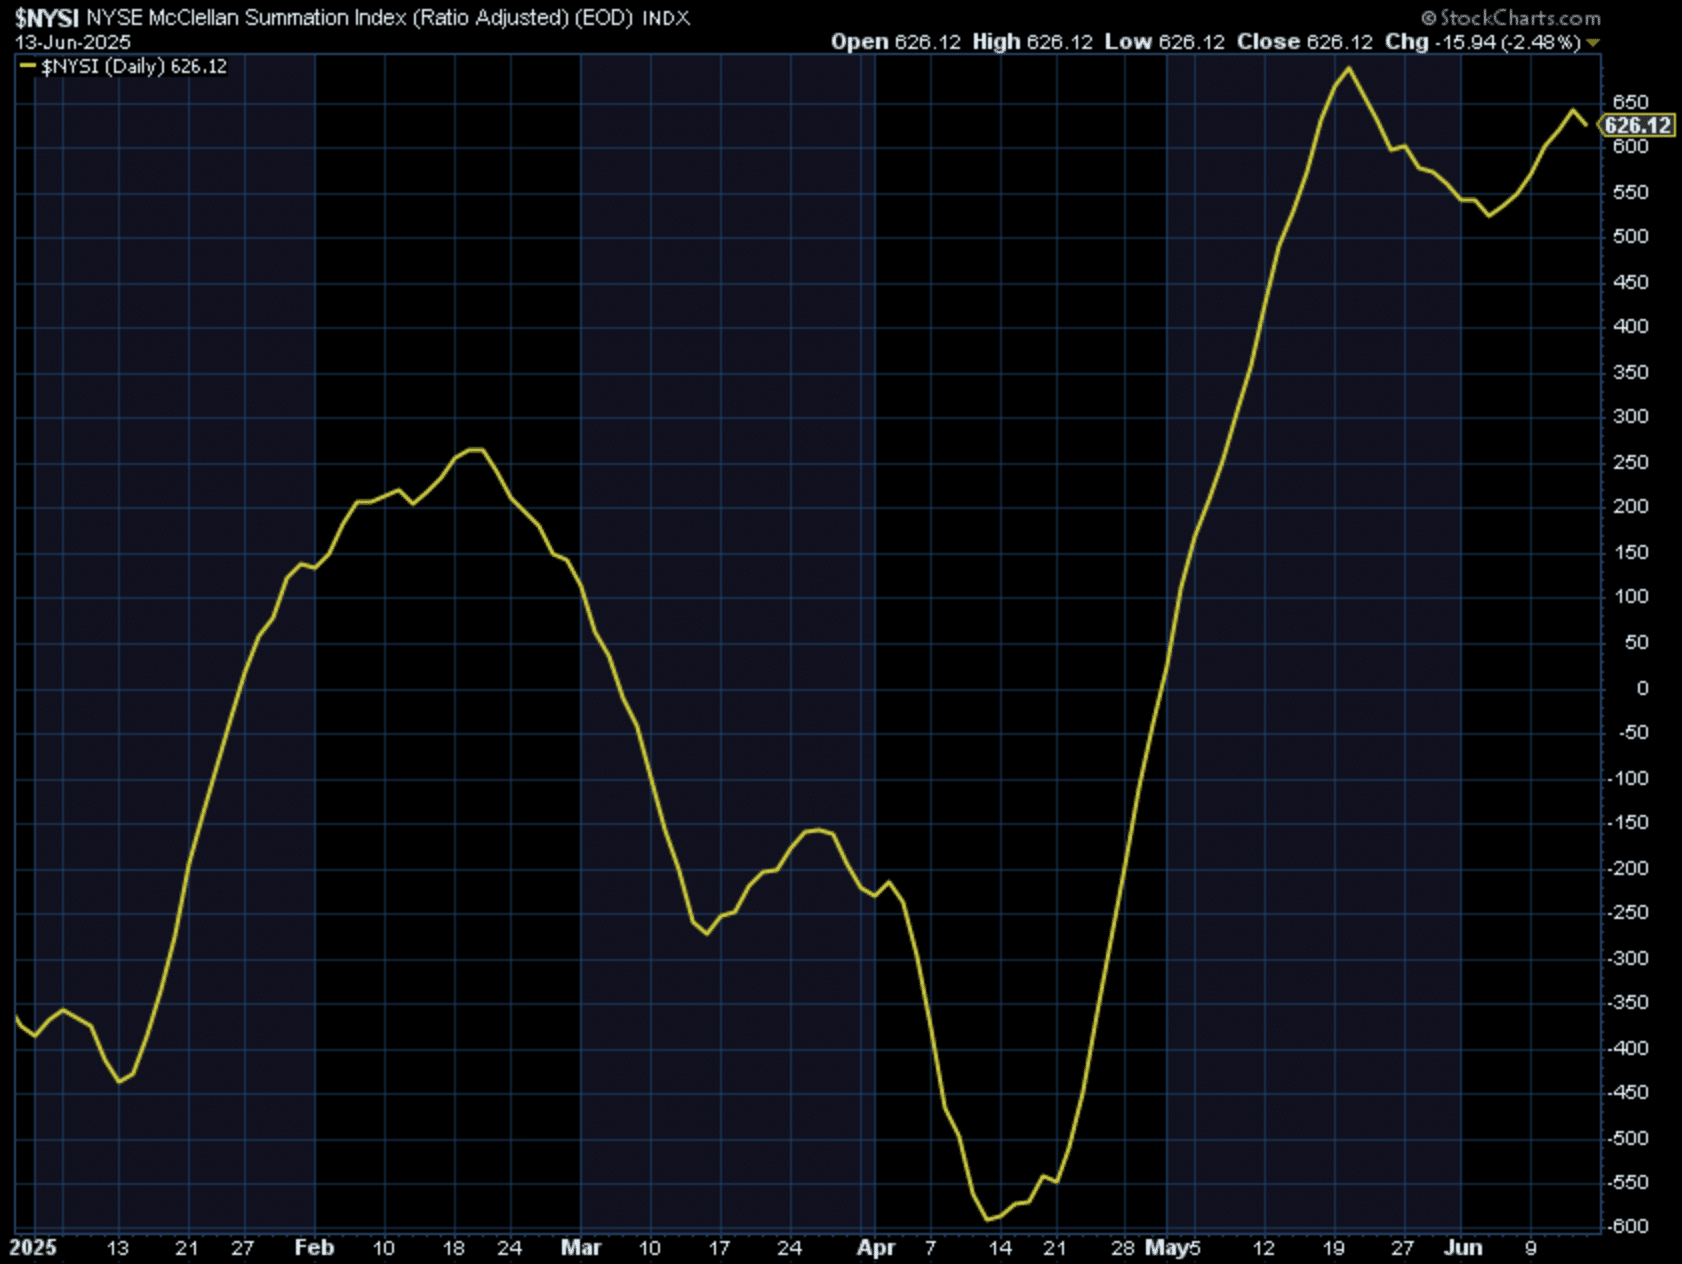
The S&P 500’s %age of stocks trading above their 50-DMA got to 80 before falling back to 72 at week-end. Both indices expressed strong breadth and momentum during the recovery rally and to wipe out the losses on the year. This had been discussed with Premium members inside the daily, live Trading Room (via Zoom) over the last several weeks and by way of the NYSE Summation Index (NYSI).
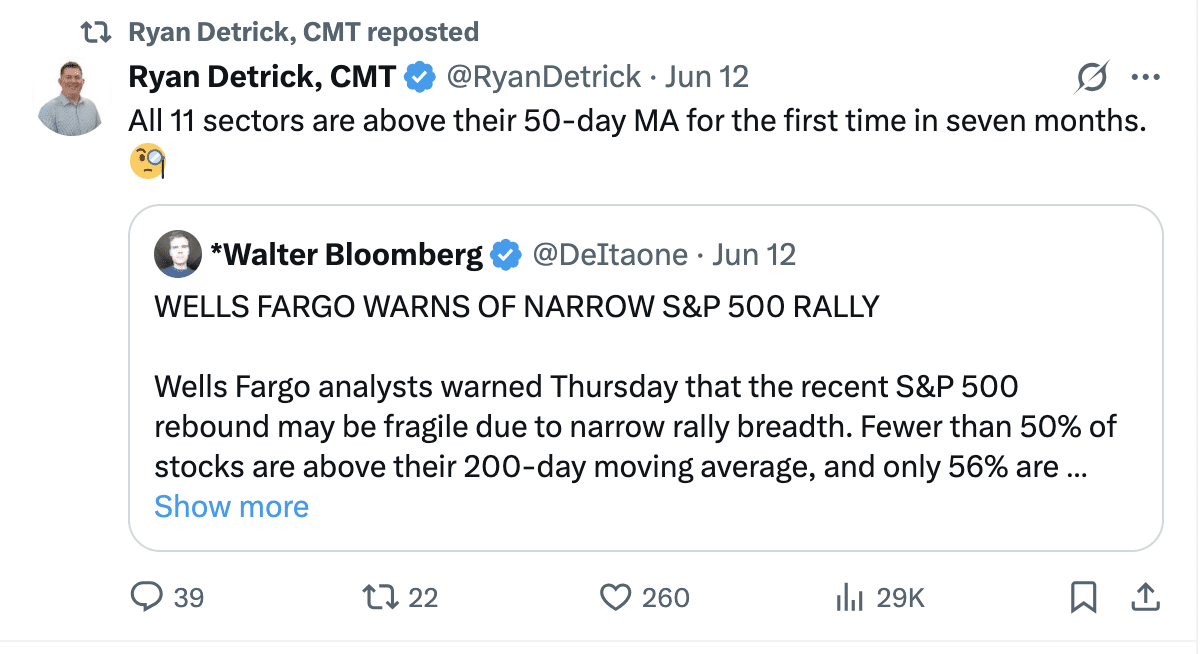
The NYSI is not just a measure of breadth, but the momentum of the breadth. As indicated in the chart above, the Summation index rallied to the high of the year, as markets recovered their losses on the year. The recent breadth momentum consolidation also set a higher low. Any market participant suggesting the recovery was narrow or found wanting for better breadth is either uninformed or expressing a personal bias… and there are many who will do so:
And if Ryan’s query and assertion weren’t enough to help disregard the Wells Fargo naysayers, remember the breath thrusts during the months of April and May that triggered (Wells Fargo is an institutional client of Finom Group).
Direct quote from Finom Group’s “A Year of Endogeny And Exogeny” Report (June 15, 2025):
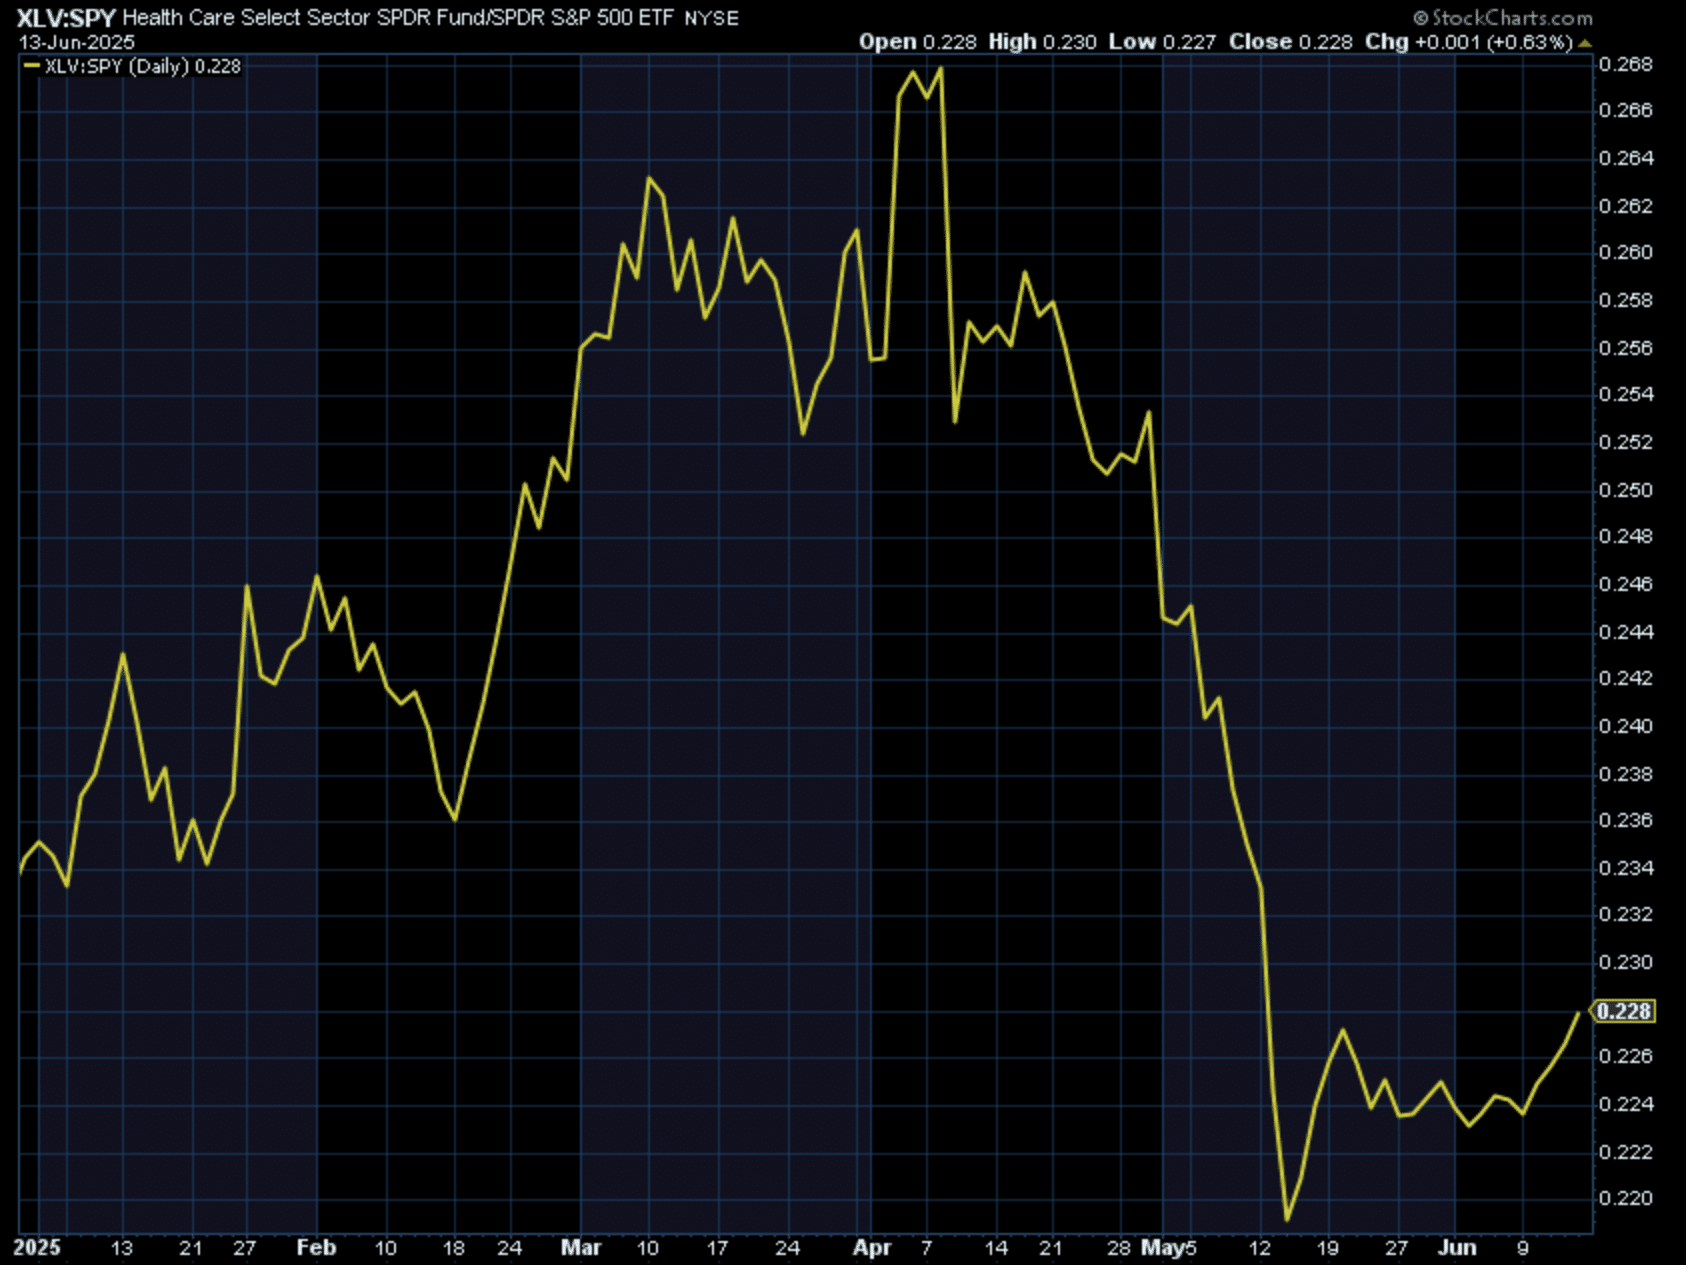
We continue to favor buying Growth/Tech/Semis/QQQ on market dips, especially after what these companies were able to deliver during the Q1 earnings season. A step function lower from those favored areas of the market we also continue to reiterate is Health Care and despite its underperformance year-to-date. FY 2025 earnings have been cut in half for the sector, which we believe has been reflected in the price performance over the last 3 months.
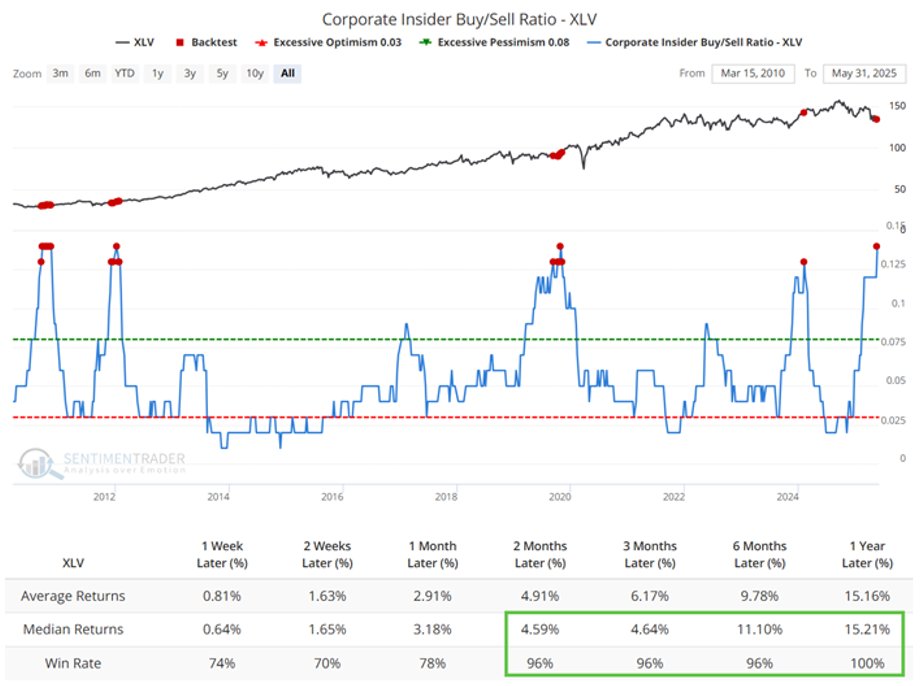
Formerly reviewed and reiterated below, when the Insider Buy/Sell Ratio hits such levels, we move to recognize the risk/reward potential for the Health Care sector as having greatly improved.
The signal from the SentimenTrader quant above was triggered at month-end of May 2025. The sector ETF (XLV) has been higher ever since. Positivity rates improve past the 2-month forward signal date and over the next 12 months with increasing average and median returns. While Health Care has been on a tumultuous ride over the trailing 12-month period, an inflection may have been signaled as forward earnings estimates have been reset lower alongside price and sentiment.
“Persistent underperformance has left Health Care deeply oversold. The sector has lagged the S&P 500 by a staggering 42% over the last 3 years. Prior three-year oversold readings that approached or exceeded 2.0 standard deviations have occurred near relative lows for the sector.” Rob Anderson of Ned Davis Research
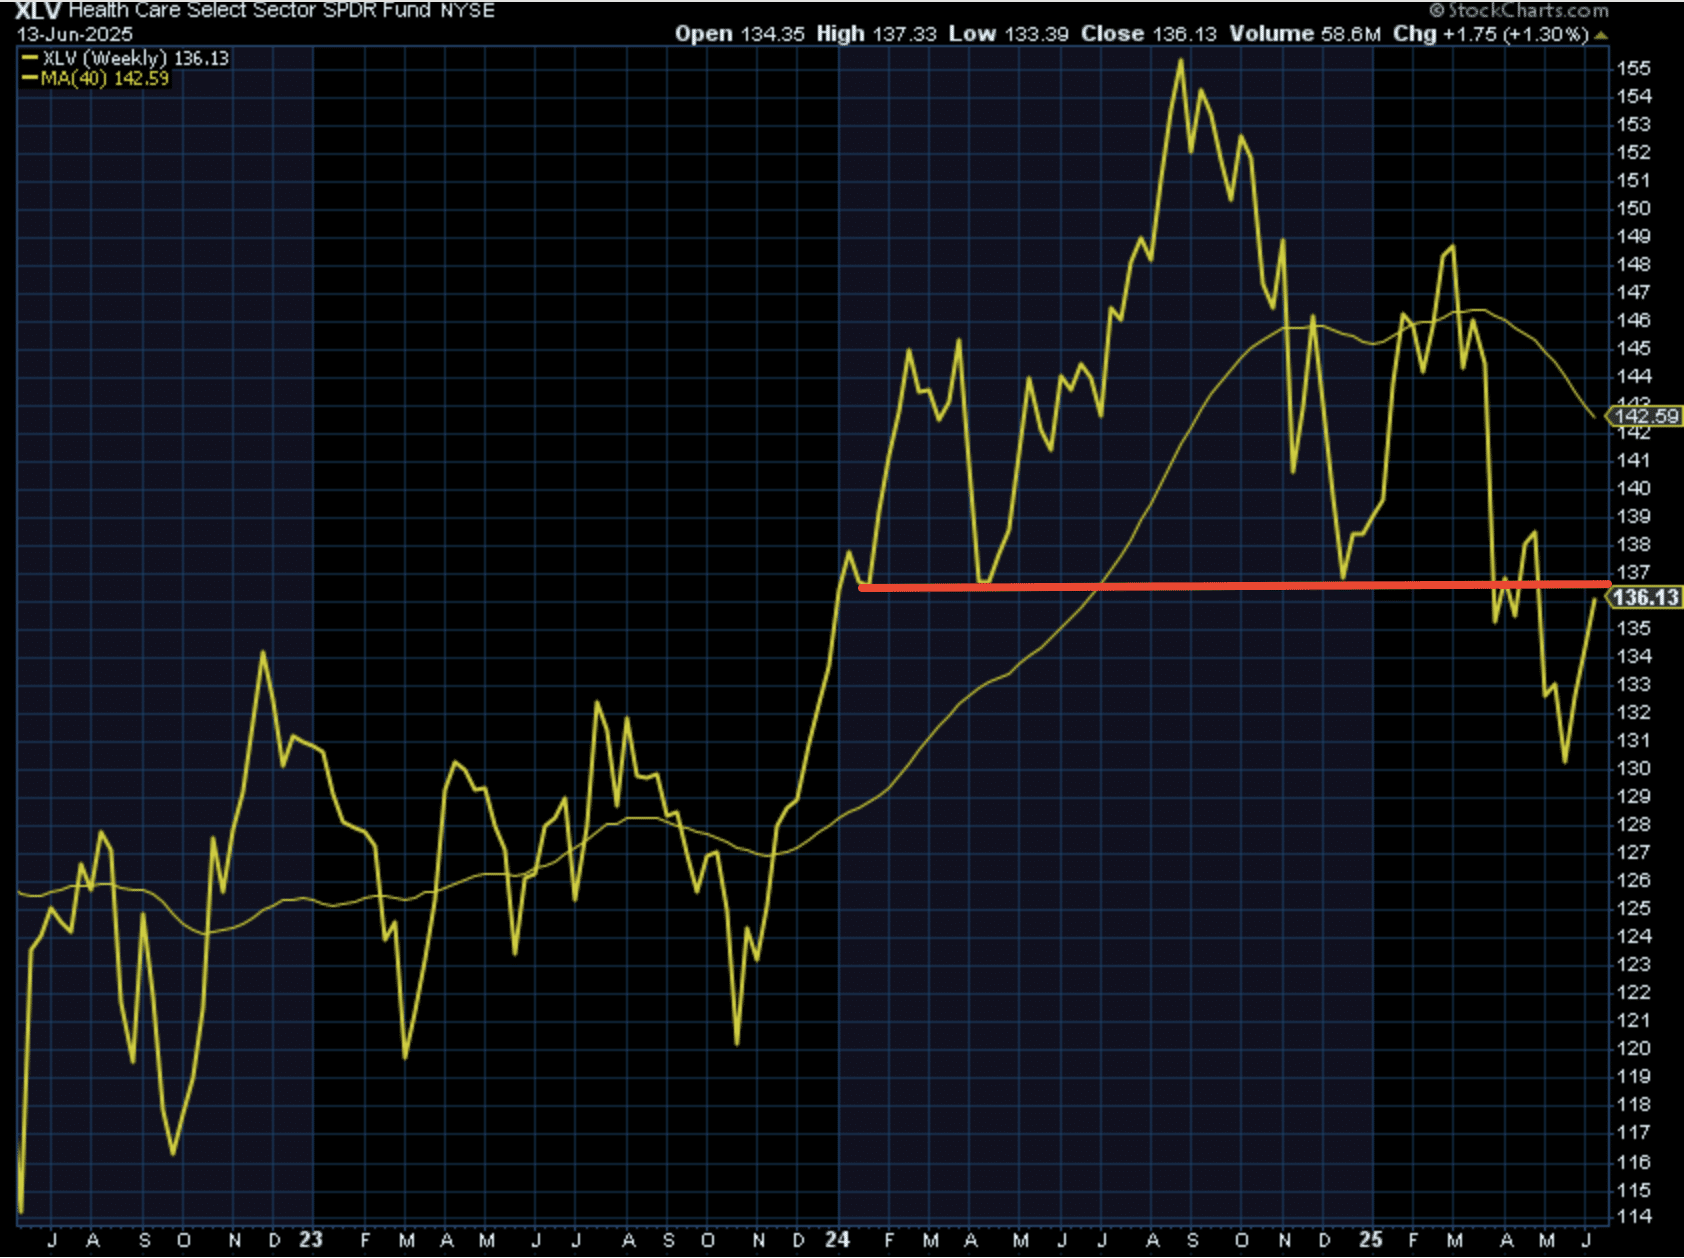
Health Care is not sexy or exciting as a sector performer over the last couple of years, and the weekly chart does not insist investors should become bullish at this time. But like anything else, it’s about skating to where the puck is going.
Health Care is trading about 5% below its key long-term 40-WMA. Admittedly not a bullish technical condition. It stopped short of breaking above resistance price level this week annotated (red horizontal line). I would be remiss, however, if I didn’t ask you to go and look at the intra-week price high (Friday). The fact that XLV dipped its toes into the $137 price level and above resistance annotated informs of what usually happens in the not too distant future for price, which is the full expression of the price range above the resistance or in the case of downside, the support level.
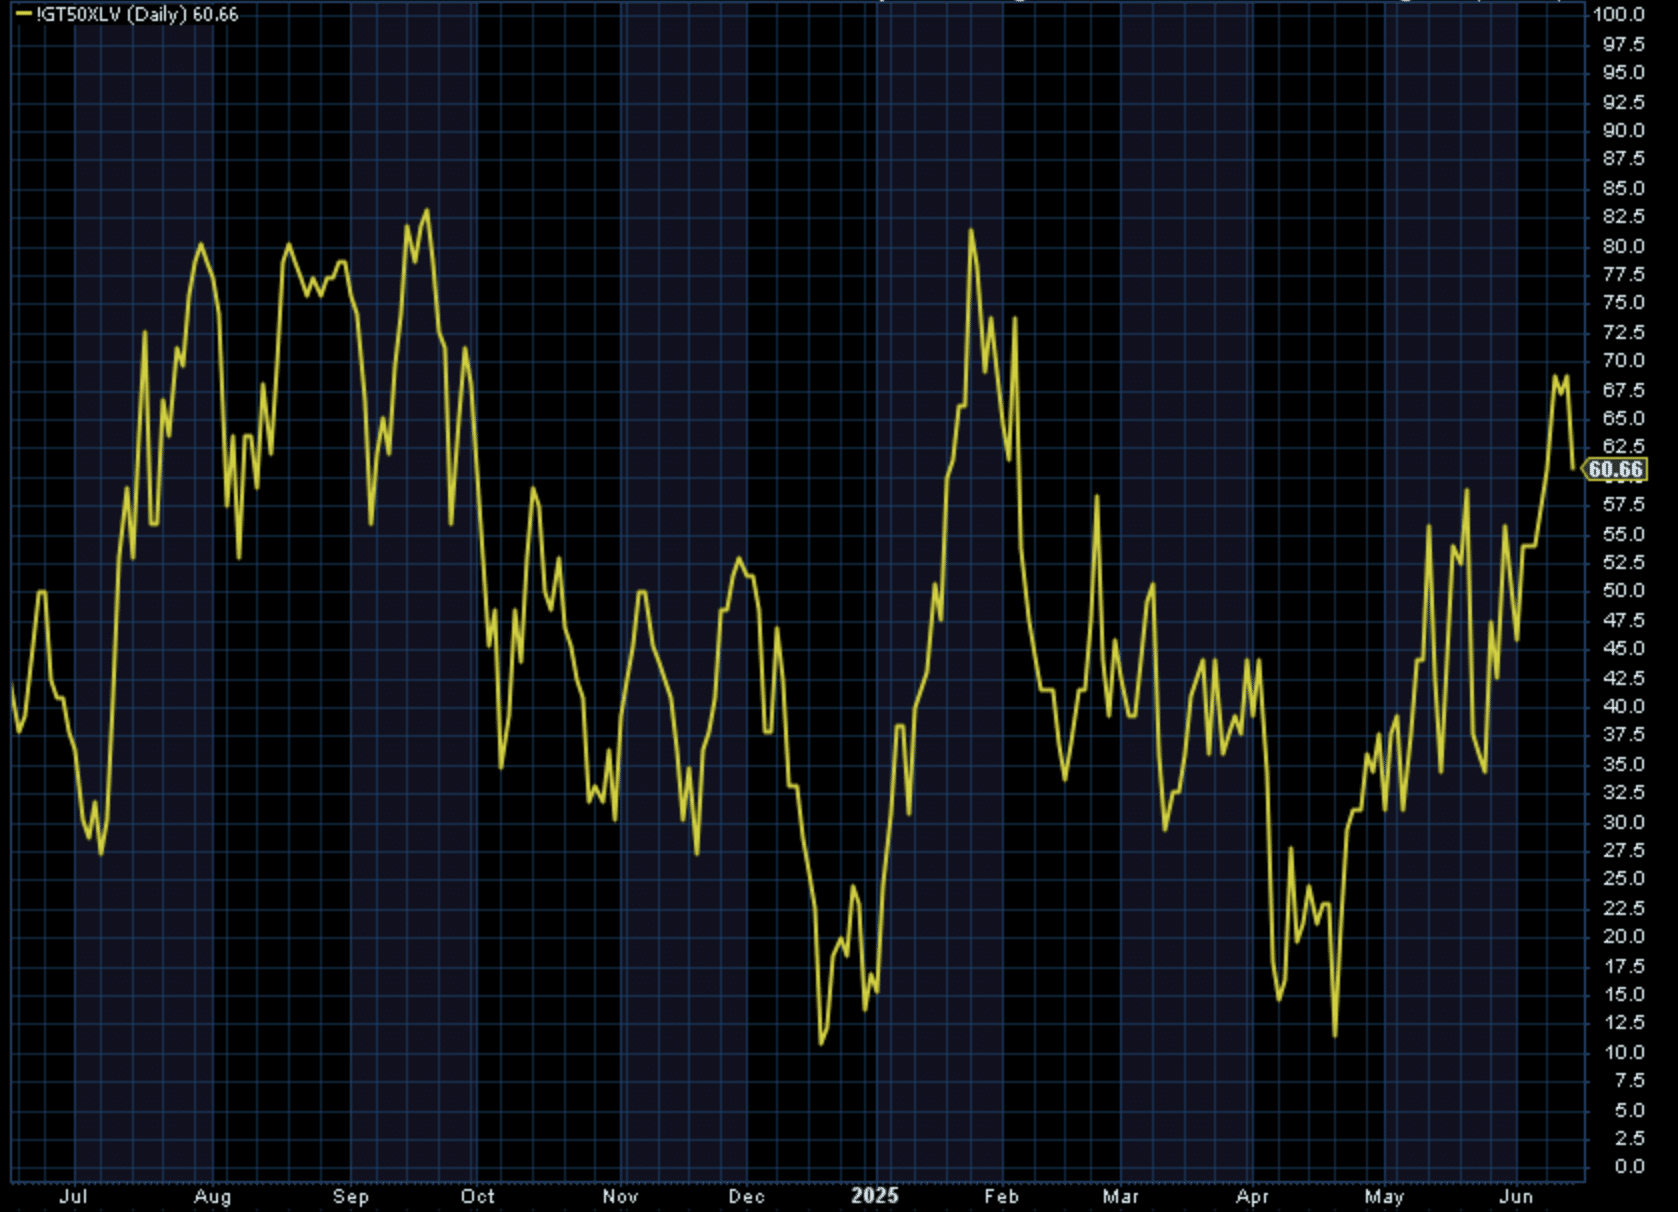
What gives us confidence that $137s will be breached on a closing basis is also informed by supportive sector breadth. As XLV has been recovering, the %age of stocks trading above their 50-DMA have surged to the second highest level of 2025, and before this past week’s consolidation.
In no way, shape, or form am I suggesting to overweight Health Care in one’s portfolio, as it has greatly underperformed the S&P 500 year-to-date. Having said that, it has also outperformed since mid-May and made a higher relative-high this past week (chart below)! Simply put; all the bad stuff for the Health Care sector may have already been priced over the prior months, and the forward 12-month EPS may have started its forward pricing operation. I’m of the opinion and based on the weight-of-the-evidence approach; XLV should have an equal-weight position in the savvy investor’s portfolio.
One last point on Health Care before moving on, and as it pertains to the risk/reward setup for longer-term investors: Cheap, cheap, cheap… Indeed, Health Care is trading at a discount to the market and to its own absolute historical valuation, on average. One could certainly argue it’s cheap for a reason, but when we consider it has been cheaper for longer, that’s the risk/reward analysis that still yet favors an allocation to Health Care, as such a lesser valuation likely won’t last terribly long.
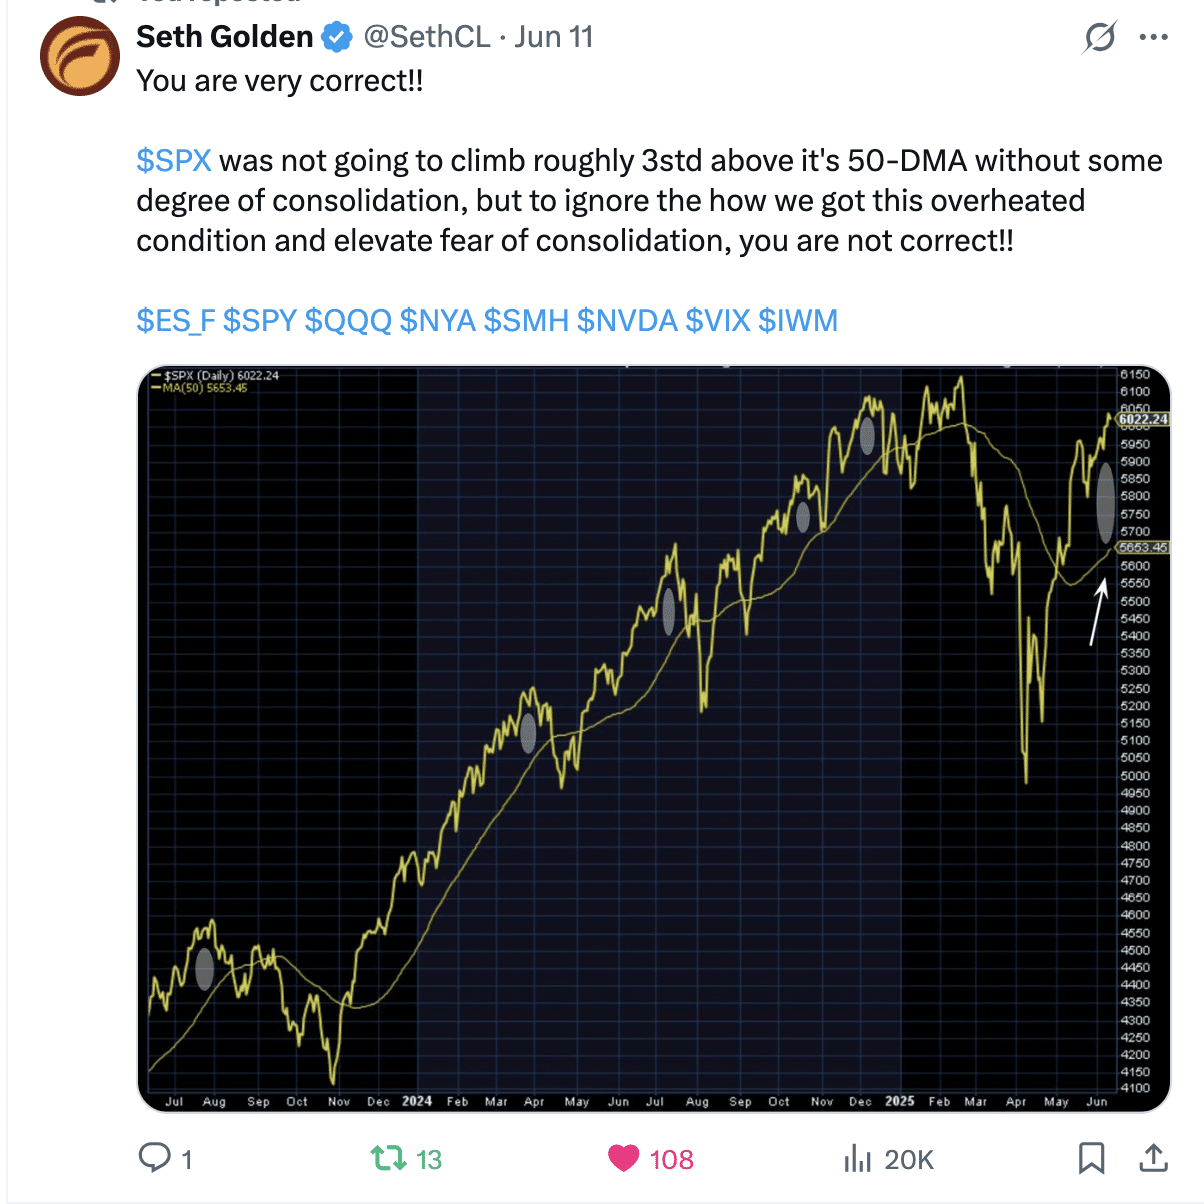
Both technically and quantitatively, the markets have climbed a tremendous wall of worry in 2025, only to get back to a neutral performance on the year. The speed for which it has occurred created a severe overbought condition with respect to the 50-DMA’s ability to play catch-up. Whether or not it was Israel/Iran or headlines on the global trade front, a pullback was inevitable, even if only to alleviate this notable overbought condition!


Direct quote from Finom Group’s “A Year of Endogeny And Exogeny” Report (June 15, 2025):
Exogeny Afoot
Unfortunately, Friday’s Middle East headlines kicked-off another bout of uncertainty and likely an exogenous event. It’s a terrible realization when human lives are lost. As investors/traders and general market participants, we have to recognize a first failed quant from this exogenous and developing war. We will know the strength or lack thereof from the developing war if more quants are to fail in the coming weeks. For now, we remain open-minded to a wide range of outcomes and let our uncertainties reflect in the position size we employ during market pullbacks. What might this “position size reflection” look like?
Remember, when the VIX gets back above 17.50, the S&P 500 begins to struggle for achieving positive returns across multiple time frames. The VIX closed just below 21 this past Friday, and gained more than +15% on the trading day. If not for this alone, we would anticipate some degree of downside follow through of price action early this coming trading week. Common sense would also inform that the likelihood the exogenous event that transpired this past Friday would be priced into markets in a single trading day… come on!!
“The chart above speaks to VIX levels and S&P 500 annualized returns. A VIX greater than 20 is typically associated with negative annualized returns…”

Direct quote from Finom Group’s “A Year of Endogeny And Exogeny” Report (June 15, 2025):
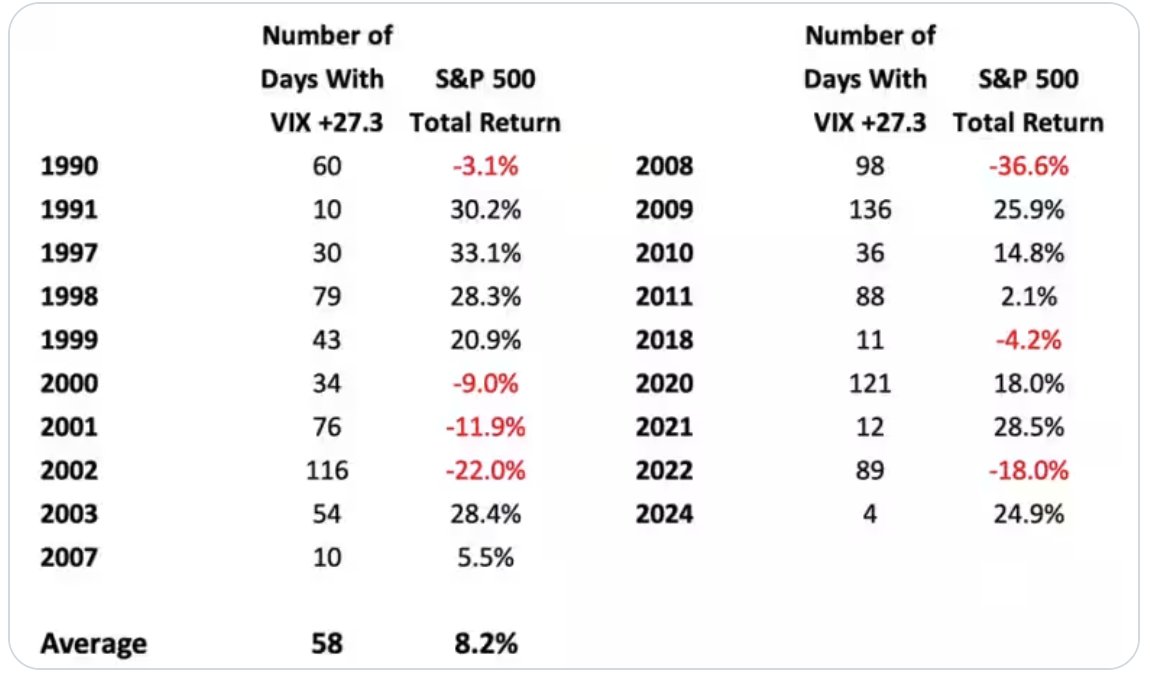
In Q1 2025 and as the correction turned into a Q2 2025 technical bear market, we realized that 2025 would struggle to hold positive returns at the index level. The VIX data below speaks to this reality from a quantitative perspective:
The VIX closed 27.3+ on March 10 or 1 std. above the mean historical close. The data suggests that the VIX needs to close above 27.3 at least 11 times before investors need to worry that the S&P 500 could end the year in the red. As of April 2025 and unfortunately, the VIX did have 11 closing day values of 27.3 or greater. Having said this, recognize in the table that this is a condition for achieving negative returns, not a guarantee that the S&P 500 would deliver negative returns. There are several years outlined whereby the VIX expressed 11 or more VIX closes of 27.3 or greater and yet the S&P 500 delivered a positive annual return. Having said that, we understood and still recognize this would likely prove a rocky year if positive returns materialized. Since early Q2 2025, the standout offset of this quantitative data set might prove the combination of recovery cycle breadth thrusts triggered.
Direct quote from Finom Group’s “A Year of Endogeny And Exogeny” Report (June 15, 2025):
Reverting to the question about the 1% for 1%+ DIP BUYING STRATEGY that might be deployed while expecting some degree of downside follow through and uncertainty heading into a new trading week, remember that the strategy can be defined as “guard rails.” If for whatever reason, an investor/trader believes in greater downside for the markets and has elevated concerns over drawdowns, a modified use of the 1% for 1%+ strategy can be employed.
.75% FOR 1%+
.50% FOR 1%+
.75% FOR .75%+
.50% FOR .75%+
The greatest consideration in the potential modified strategy of the modeled 1% for 1%+ strategy is an emphasis on staying active and maintaining touch points with the markets. Believe it or not, muscle memory and metaphysics play a role in the success or failure rate of investing/trading. Our mental investing acuity and emotional quotient are more often enhanced during times of engagement with actively stressed or volatile price action. As the volatility inevitability subsides, the mental acuity and emotional quotient rarely follow, allowing investors to invest/trade with a greater degree or at a higher cognition level for price action as well as the improved ability to digest information flow absent visceral emotionality.
Direct quote from Finom Group’s “A Year of Endogeny And Exogeny” Report (June 15, 2025):
The good news, earnings are very unlikely to be impacted from the Middle East exogenous event, given what we know about the conflict to-date. While we leave room for disappointment in this regard, the market’s recovery since April 9th also speaks well of forward 12-month earnings.
Strategists at Barclays have an interesting take on the rebound in stocks. With the S&P 500 approaching 22 times forward earnings again, their strategists looked at what has happened over the last 30 years, excluding periods of negative EPS growth, in similar situations. “We found that, while average returns decreased (and the variance of those returns increased) as valuations rose from 10x to about 21x, returns actually improved modestly (and variance decreased) as NTM P/E crossed over 22x, up to about 24x,“ said the team led by Venu Krishna. Their theory is that the S&P 500 trades at those levels after fast sell-offs and V-shaped recoveries, so 22x could be a“good approximation of where bears capitulate and ‘animal spirits’ fuel the chase for additional upside.“

Direct quote from Finom Group’s “A Year of Endogeny And Exogeny” Report (June 15, 2025):
There had been great concern that the ongoing trade/tariff policy would denigrate forward earnings for S&P 500 companies. Analyst had lowered FY 2025 EPS estimates given the prevailing trade headlines through Q1 and early Q2 2025, but since then analysts have ratcheted back up their FY 2025 EPS estimates!
While market participants still have a murky outlook for where the national tariff average will land, consensus NOW believes it will prove closer to 10% than a more harmful 20% formerly feared on April 2nd’s Liberation Day outline. If the actual national tariff rate is found somewhere in the middle of the formerly feared 20% and the innocuous 10% level, we think this is reflected in the upwardly revised FY2025 EPS models and a more accurate guide, which is supportive of S&P 500 gains by year-end.
Direct quote from Finom Group’s “A Year of Endogeny And Exogeny” Report (June 15, 2025):
Lastly, while these events have unfolded in 2025, high-yield credit spreads and junk bonds have maintained their long-term uptrend.
If junk bonds aren’t seen panicking, investors would prove wise to be buying risk assets, historically speaking!
I can’t see anything other than a strong bull trend in the chart below. When junk bonds are pointing higher, it is generally a green light to buy stocks on dips. That has been part of the savvy investor playbook throughout the history of bull markets.

Direct quote from Finom Group’s “First Half Of 2025 Comes To An End With Exogeny Afoot” Report (June 22, 2025):
As there remains only a week of trading left in 1H 2025 and the month of June, here is a look at a 20-year seasonality chart for the S&P 500. We are getting close to July, and based on this pattern shown below, we could have a nice rally in July, but this may depend on how markets react to the weekend exogeny.

Direct quote from Finom Group’s “First Half Of 2025 Comes To An End With Exogeny Afoot” Report (June 22, 2025):
There is some concern that commodity prices are rising at a rate that could undermine the economy and, therefore, stock prices. This weekend’s U.S. strike on Iran has the potential to catalyze commodity prices, most notably energy prices. The Commodity ETF is showing prices just barely into new highs. While there is more to learn this coming week, this definitely should be on the radar as an issue for equities.

Direct quote from Finom Group’s “First Half Of 2025 Comes To An End With Exogeny Afoot” Report (June 22, 2025):
One for the archives…
The chart below of the Nasdaq 100 (QQQ) identifies the beginnings of a Power Trend and follow through of the Power Trend.
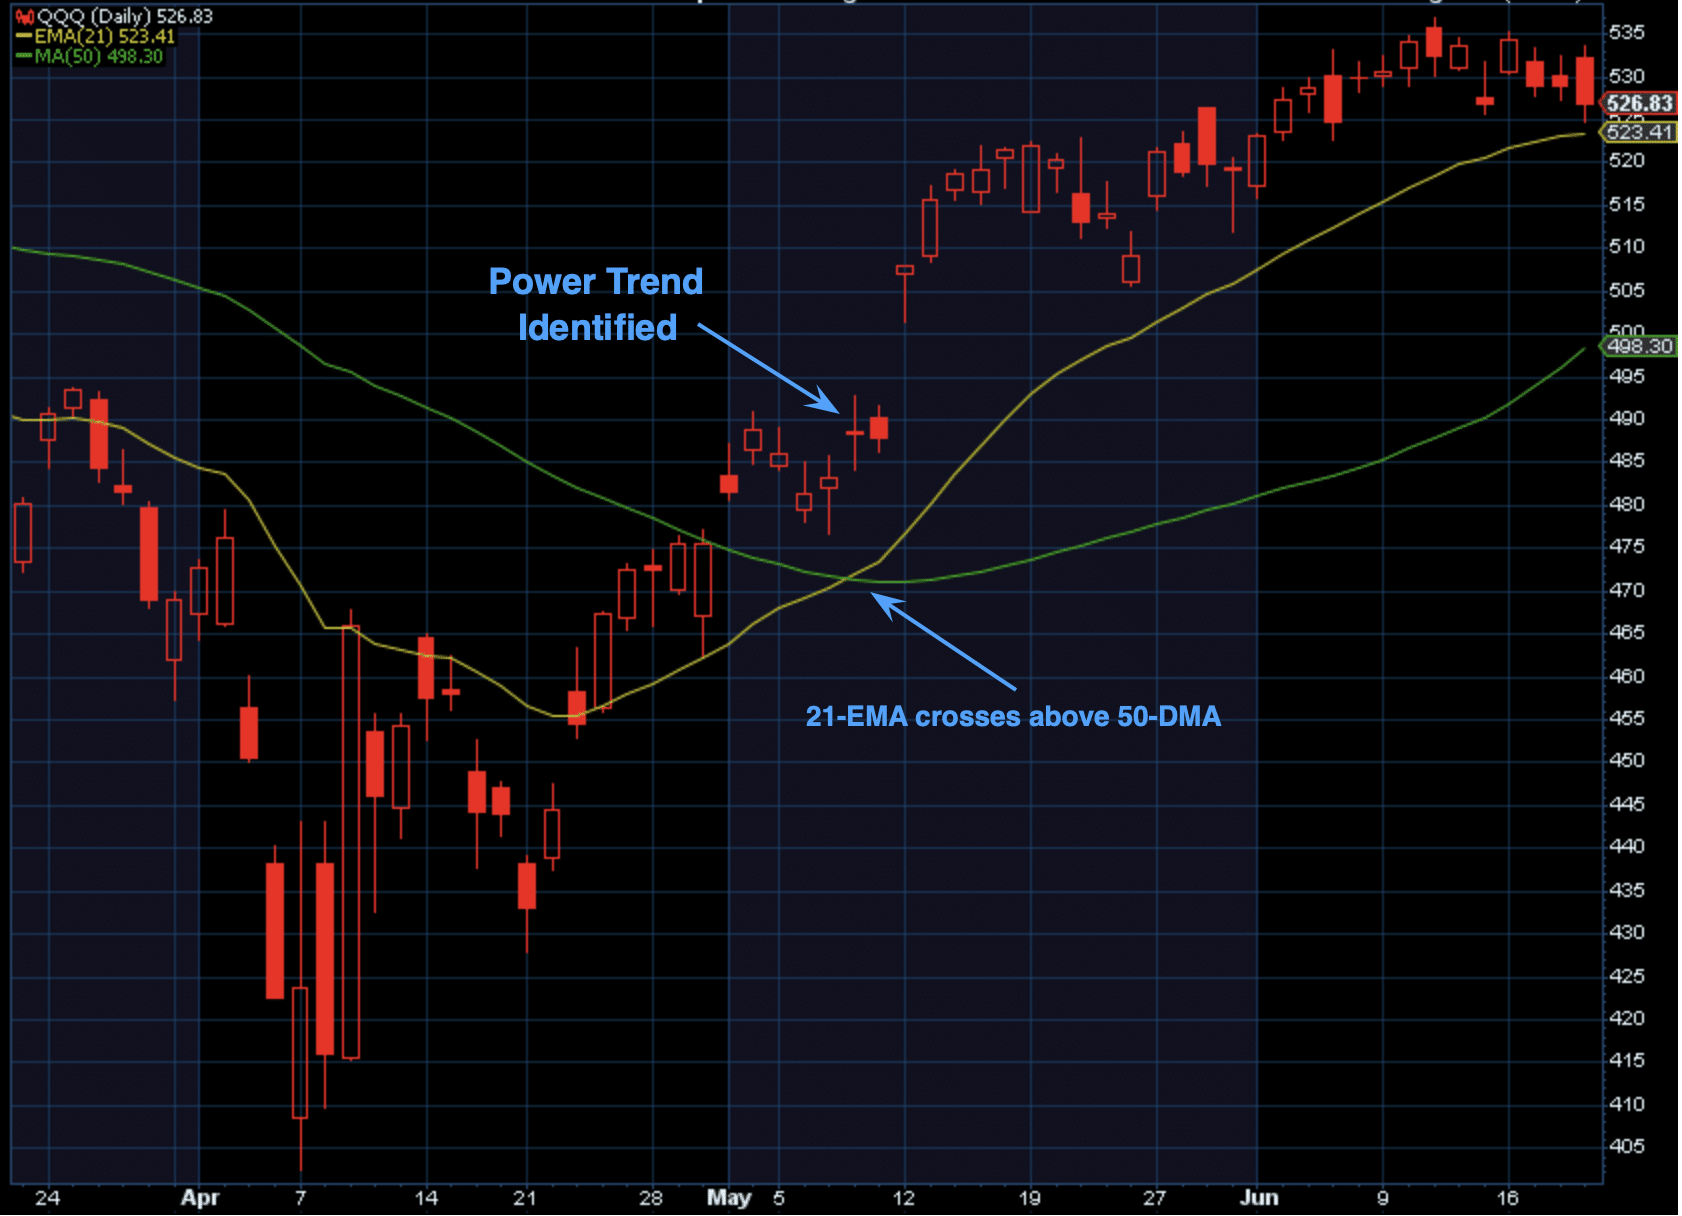
Power Trend Identified Mid-May:🔸Intraday low above 21-EMA for 10 days🔸21-EMA above 50-DMA at least 5 days🔸50-DMA curls upward/positive
🔸Not in portfolio’s best interest to fade Power Trend
Direct quote from Finom Group’s “First Half Of 2025 Comes To An End With Exogeny Afoot” Report (June 22, 2025):
The short-term downtrend continues, although it is more sideways than down. This chart of the S&P 500 below shows the last 3-trading sessions closing near the lows of the daily range. That is about the only negative I can see in the chart. Prices have held nicely above the 5937 support, and new 52-week lows are not material. Of course, weekend headlines of a U.S. strike on Iran is an exogenous event that can overwhelm all measure of technicals.

Direct quote from Finom Group’s “First Half Of 2025 Comes To An End With Exogeny Afoot” Report (June 22, 2025):
The bullish percents are also ticking lower, but it looks barely worth mentioning.Same here with the Summation Indices, although we should recognize the downtrend is muted and like the major indices are more sideways than downtrending.


