
If you thought markets were still frothy heading into the first trading day of the week, that sentiment only grew on Monday as the S&P 500 found itself with yet another record-level high and closing high of 3,288.13. U.S. equity markets bucked the rough European trading session and appears to be “going it alone” in the S&P 500’s quest for 3,000. What lay ahead seems a rather simple achievement and may be found with the big money center banks set to report Q4 2019 results and deliver FY2020 guidance this week.
With the S&P 500 tacking on another .7% gain Monday, market breadth continued to improve. The percent of stocks in the S&P 500 trading above their respective 200-day moving average is now the highest since 2014, suggesting significant support for the market when the benchmark index retraces lower.
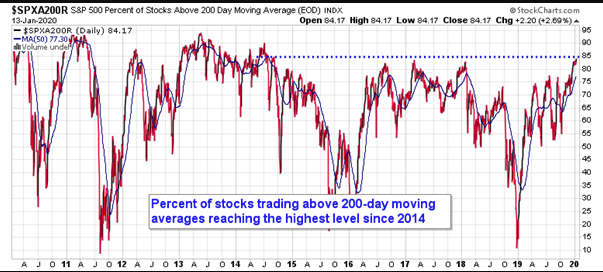
The 200-DMA for the S&P 500 Index currently resides around 2985, or just over 9% below Monday’s close. In speaking of the S&P 500’s 200-DMA, there are many market participants who are fearful of a repeat of the melt-up that occurred in January 2018, which resulted in a sharp reversal in the first week of February 2018. There are some similarities between now and January 2018 for sure, but when we look deeper, the market was more extended in 2018 than presently. In January 2018, the S&P 500 pushed 12% above its 200-DMA. Today, the S&P 500 is just under 10% above it’s 200-DMA.
In considering that the 200-DMA is a ways below present levels, a test of this level is not foreseen in the near term given the bullish backdrop of equity markets and expectations for earnings to rebound in 2020. Nonetheless, it usually proves prudent for investors to remain vigilant and aware of the risk-reward for stocks given current valuations that appear stretched. It can be suggested that from a risk/reward standpoint the market currently proposes greater risks than it does rewards near-term.
Investors are rapidly asked to shift their focus toward 2 key issues this week, earnings and the signing of the trade deal. While earnings are expected to fall for the Q4 2019 period when reported, the signing of the phase-1 trade deal begs of investors to remain optimistic about the potential for a global economic rebound of sorts.
In efforts to smooth over the phase-1 trade deal, the United States removed China from a list of countries considered currency manipulators just two days before top trade negotiators for Washington and Beijing sign a key the trade deal.

The decision to strike China from the currency manipulator list comes more than five months after the Treasury Department formally made the designation. President Donald Trump and China Vice Premier Liu He are scheduled to sign a preliminary trade agreement in Washington on Wednesday. China is now on a “monitoring list” for currency practices along with nine other countries, including Germany, Italy and Japan.
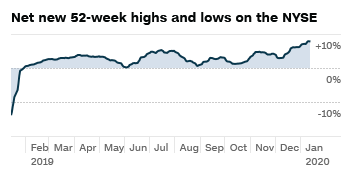
The positive sentiment from the phase-1 trade deal signing continues to be met with positive equity market sentiment and buying pressure. The number of stocks hitting 52-week highs exceeds the number hitting lows and is at the upper end of its range, indicating extreme greed.
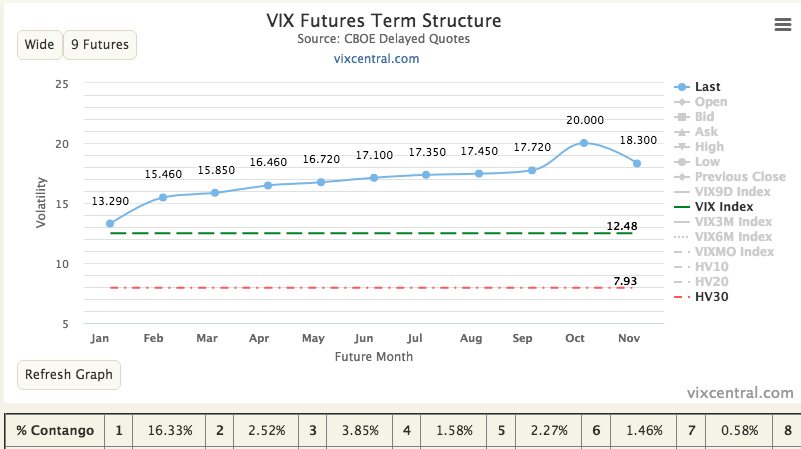
The put/call ratio remains at levels that are usually met with a market retracement near-term, but that has been said for many weeks now. The VIX is also relatively low, below 13, with realized 30-day volatility hovering around 7. The signs of “complacency can be found at every corner of the market and are all the talk of market participants of late.
In our weekly Research Report to finomgroup.com members we offered the following with respect to all the rhetoric, warnings and hyperbole surrounding the state of market “complacency”:
“The “market is too complacent” is currently littering the landscape of the Fintwit community of Twitter participants. The problem with “the market is too complacent” theory is according to this theory and the folks who follow every VIX index tick is that the S&P 500 has been “complacent” since the rally started last October, and the VIX was again below its median average in 2019. The VIX was 13 on October 15, 2019 and it’s 12.56 today. Selling equities and buying bonds just because of “complacency” back then would have been a poor strategy and more obviously a losing proposition. This is just one of many examples of trying to outsmart the market, which often fails. Trust us, the market is never wrong and is always the purveyor of truth. The stock market will win more often than it loses and as it finds the ultimate truth in earnings.”
What we’re seeing from the market right now is obviously nothing new. For 3 straight years, it would appear as though the January seasonal melt-up has been in play. While the strength in January persisted in 2019, achieving a gain of 7.9%, all anybody seems to remember is what happened shortly after the end of January 2018. It’s easy to dismiss good times that persisted through 2019, but difficult to dismiss the volatility event that followed January 2018. On February 5, 2018, the S&P 500 exacted a more than 5% intraday dip, with the Dow dropping more than 1,000 points before the closing bell. This is what investors desire to avoid and why the melt-up and market complacency issues of today are being paired with nostalgia of 2018.
With each tick higher in the market, investors are seemingly chasing the market higher and leveraging their portfolios with greater equity exposure. Market exposure for CTAs (Commodity Trading Advisors), which are momentum and trend-driven in their analysis, have ratcheted up their exposure to the market. With the strong momentum of 2019, it’s not a surprise to see this group of traders taking their equity holdings up near the historical high-end of the ten year range. This was something we saw back in January of 2018 and 2019 as well.

Equity market exposure is on the rise and as Andrew Thrasher of Thrasher Analytics reports, so is market sentiment.
“Looking at the S&P 500, the Daily Sentiment Index (DSI) has risen to 90% last Thursday, with the VIX DSI falling to 7%. No one is interested in volatility anymore. In January ’18 The DSI got to 96% for the S&P 500, so we aren’t quite back to those levels just yet but it’s not often 90% is eclipsed, as the chart below shows. For Volatility, the 5-day average stood at 11.5% on Friday, a rock bottom level of bullish sentiment for the ‘fear index’, a point we saw on January 25th ’18 and a few times in Q3 ’18.“

Positioning and sentiment is quite strong and has been correlated to strong market breadth. It would appear that one of two things market theses is afoot:
- Market is expecting an upside earnings surprise whereby what seems like a stretched valuation currently will be found cheap or…
- Investors are indeed found with greater resolve as interest rates remain extremely low and the Fed is thought to remain on the sidelines in 2020, boosting equity sentiment.
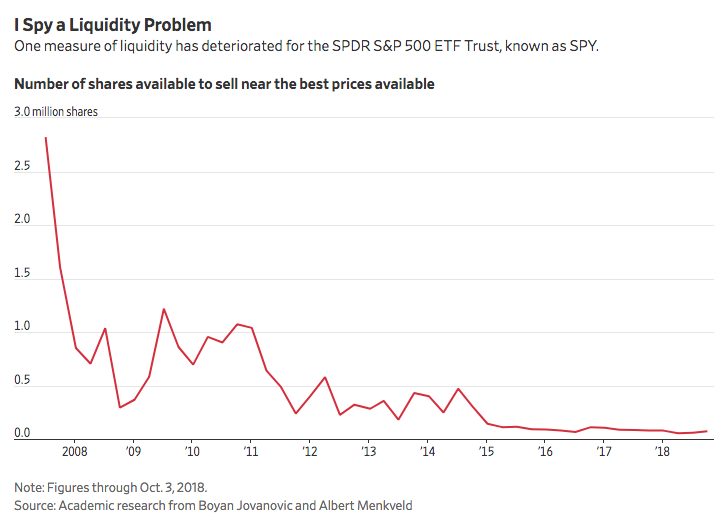
It’s with these probable theses in mind, that it also appears hedging one’s portfolio has gone out of favor.
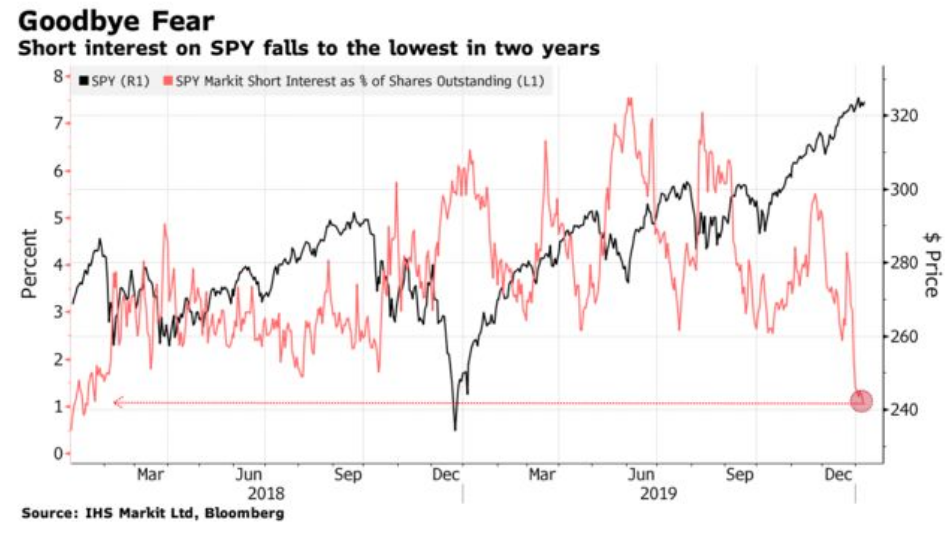
Depicted above is a chart showing the percentage of shares in the Spiders ETF (SPY) on loan or sold short. That percentage has sunk to less than 2%, a 1-year low, but not quite as low as January 2018. It appears few traders are interested in shorting the S&P 500 ETF presently, and we can’t blame them given all the aforementioned that has supported price movement. But all good things must… well you know, eventually!
One of the common themes amongst market participants today, especially active traders is that they try to time tops and/or bottoms. Given where the market is presently, it seems the mantra has become “it’s coming it’s coming, the market is topping!” While that may very well wind up being true in hindsight, that’s likely the best way to consider the mantra’s relevancy. This mantra about market complacency has been persistent since November 2019, where some might argue the true melt-up period began. It was back then that the spread between Smart and Dumb Money fell to -50%, the S&P 500 has since enjoyed almost uninterrupted upside. This is the best reaction in 20 years after such extreme sentiment.
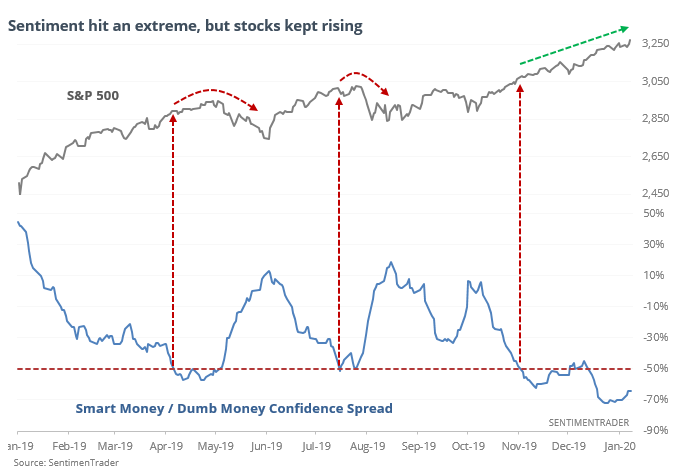
The Smart/Dumb Money Confidence chart just goes to show investors that timing the market’s next move based on this sentiment indicator or that sentiment indicator can prove faulty, especially with market liquidity so poor. It appears the gap in this sentiment indicator has been found with failure. There were only four times when such a wide spread failed like this, and each of them saw any further upside erased in the weeks ahead, and with high risk relative to reward up to 3 months later, according to the Sentiment Trader’s study. But do keep in mind, had you sold when the gap was as wide as more recent market corrections took place back in 2019, you would have missed the market’s 5% move higher since November.
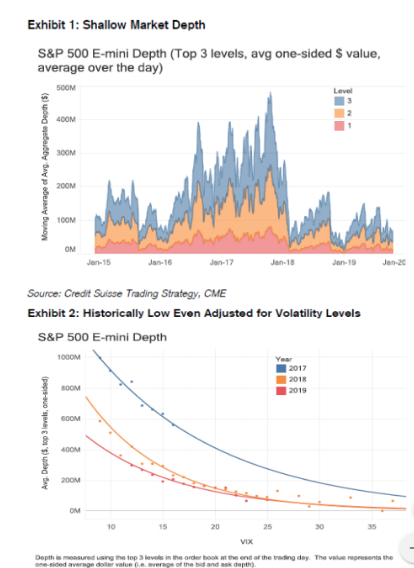
Finom Group has mentioned, on several occasions, that market liquidity issues has played a significant role in the market melt-up. Liquidity is often found at low levels in the final months of the year, as it was once again in 2019.
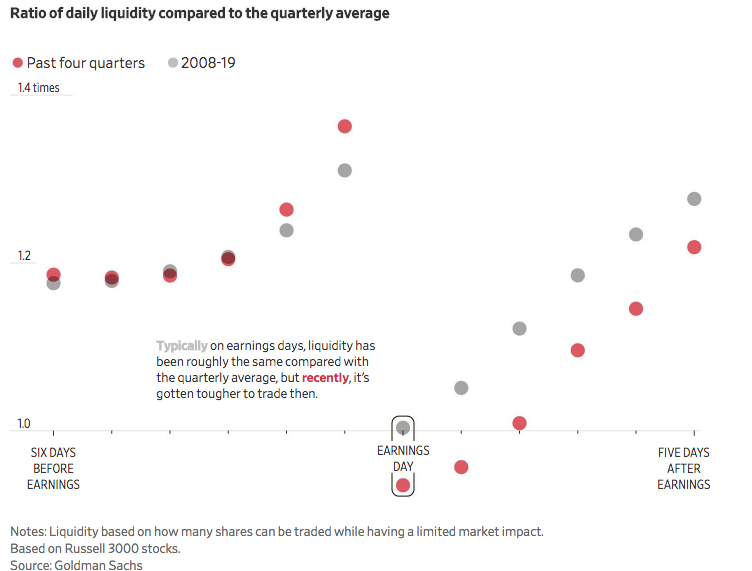
“The number one client question in 2019 has been on liquidity,” Goldman Sachs Group Inc. GS 1.28%analysts wrote in a December note to clients. The firm said earlier in the year that measures of liquidity have shown “high predictive power” when estimating volatility. The Federal Reserve also weighed in last year, listing falling liquidity in its compendium of risks to the U.S. financial system.
Back in November, Societele General also discussed record low market liquidity, which served as a backdrop for markets that were already pointed higher.
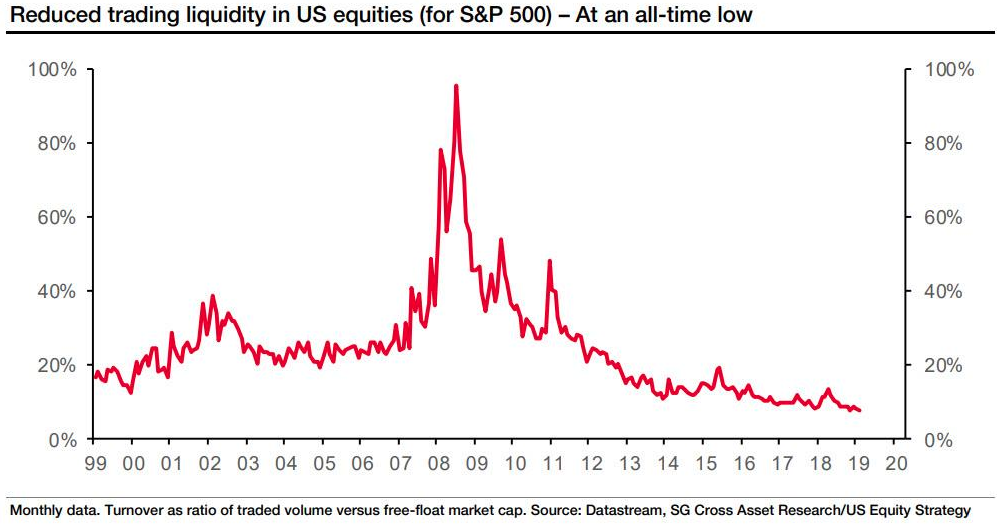
- The lack of market liquidity, as measured by S&P 500 turnover – the ratio of trading volume vs. free float market capitalization – has exacerbated the impact of share repurchases on U.S. equities“, according to the French bank. Indeed, trading volume has been on a downtrend since 2008, and Soc.Gen. expects this to continue.
In a recent report discussing low market liquidity levels by the Wall Street Journal, the publication defines liquidity in S&P 500 stock-index futures as weak. Among single stocks, it hovered near some of its lowest points of the decade in August 2019, one of the latest periods of market turmoil. And an unexpected spell of turbulence also hit money markets in 2019, leading the Fed to flood the system with temporary funding.
The Federal Reserve warned market participants in November 2019 of its risks in its Financial Stability Report, an annual assessment on the resilience of the U.S. financial system, saying liquidity had slipped in key markets like stock futures and U.S. Treasurys at times in 2019. Unfortunately, it doesn’t appear as though there is a whole lot the Federal Reserve can do about stock futures liquidity, unlike that of the Treasury markets.
“The liquidity crises seem to happen when everybody’s trying to sell the same security. It’s like a rush for the doors,” said Savita Subramanian, head of U.S. equity and quantitative strategy at Bank of America. “They’re going to get a lot more volatility than they’re expecting.”
Credit Suisse suggested in its most recent market outlook that liquidity has grown scarcer, showing that traders have become more risk sensitive. The end result? There is more gap risk and potentially higher volatility ahead.
There’s not a whole lot, if anything, that we can do as individual investors to recover market liquidity. Something in the structure itself either has to break or evolve for within the liquidity paradigm to change or revert in our opinion. That reversion is usually referred to as a cleansing period for markets.
It’s anybody’s guess as to how far the market can rally before it takes a breather and to what degree it retraces. Remember that price can correct in two manners, price and time. For now, breadth is supporting the market and the low liquidity regime in place finds it incredibly difficult to produce a countertrend move as market participants increase their exposure to equities. And while investors await a period of digesting the long bull rally in markets, earnings will also provide investors with an improved level of earnings clarity for 2020.
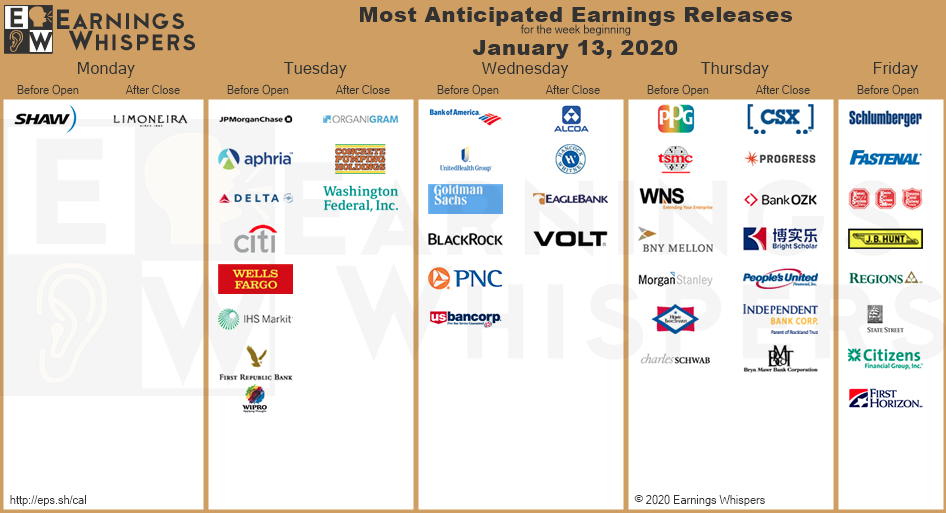
Banks are set to report among the strongest results in the fourth quarter, while manufacturers, energy producers and materials firms are expected to post among the biggest declines in earnings. In addition to the biggest U.S. banks, Delta Air Lines Inc., UnitedHealth Group Inc. and Alcoa Corp. are among the companies scheduled to report this week.
Analysts expect earnings to grow by 4.6% in the first quarter from the year-earlier period and by 6.4% in the second quarter, according to FactSet. And while it is still early, they expect even more impressive gains for the year on the whole. Estimates suggest the S&P 500’s earnings could grow by 9.4% on a year-over-year basis. Given where the S&P 500 sits today, is some of this expected earnings growth already being priced in to markets? That’s the question many market participants have been asking themselves. The other variable investors are concerning is the colloquialism of markets which indicates that buying begets buying begets more buying.
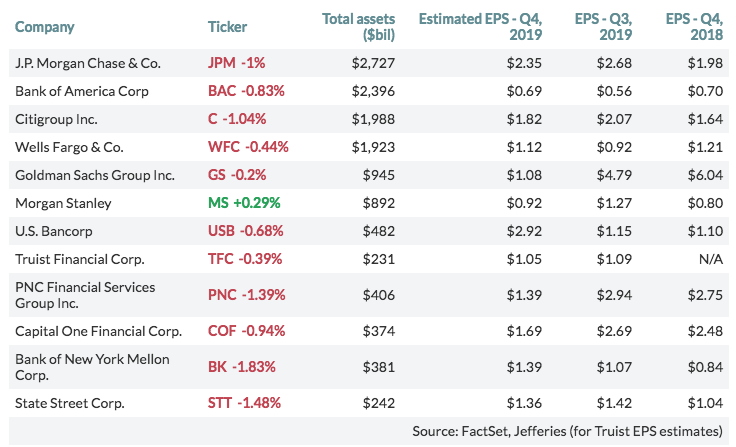
Heading into the quarterly releases on Tuesday for the likes of J.P. Morgan (JPM), Wells Fargo (EFC) and Citigroup (C) the market is running hot. As it pertains to these big money center banks that are the first to report within the financial sector, here are the expected fourth-quarter EPS results for the largest 12 U.S. banks by total assets, among analysts polled by FactSet, compared with actual results for the previous and year-earlier quarters:
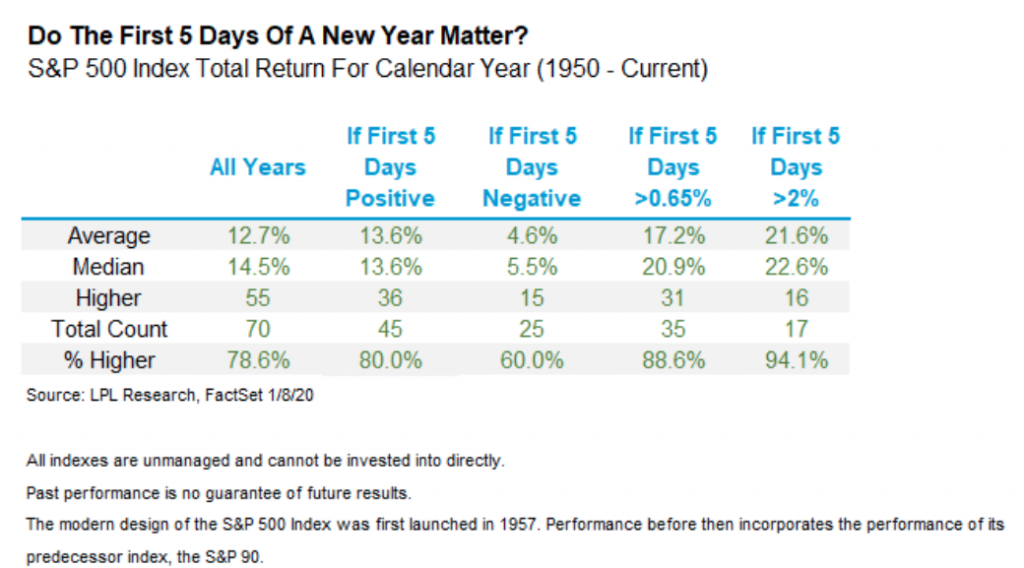
Bank stocks have taken a small breather of late ahead of their respective earnings’ releases and FY2020 guidance. Nonetheless, the market itself hasn’t taken a breather in early 2020. Keeping in mind the strong performance of 2019, whereby the S&P 500 generated greater than 30% in total returns, usually the market continues to rally after such an gain in the previous year. Also, when the first 5 trading days of the year are green, this bodes well for the whole of the year, except in 2018 of course! The following statistics from Ryan Detrick identify what investors might expect in the way of S&P 500 performance in 2020, based on the first 5 trading days of the year.
- If the first 5 days of year are green for the S&P 500 (like 2020), the full year has been higher 80.0% of time.
- Sounds quite random, but then you realize if those days are down, full year is higher only 60% of the time.
- And if those days are up a lot (like 2019) returns get even better.
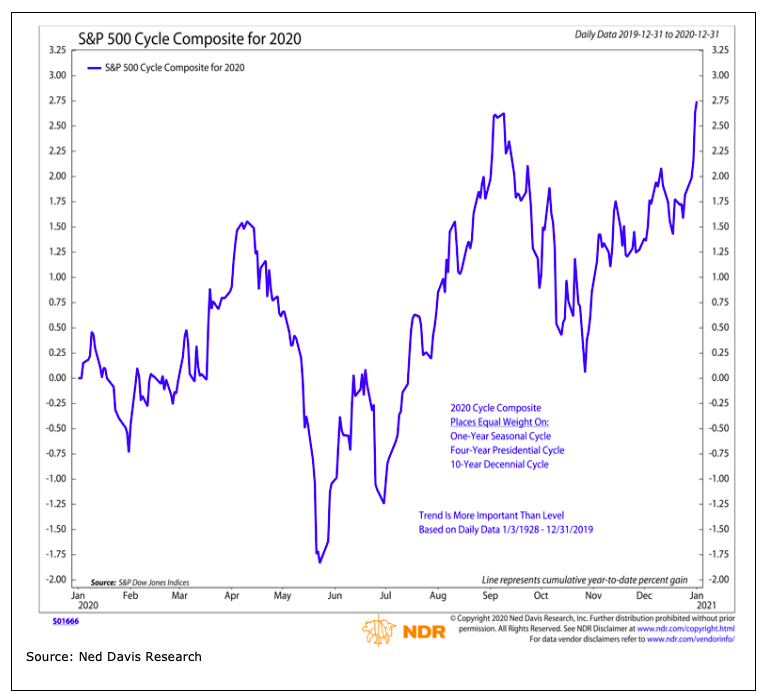
Beyond January and earnings season, investors will also be forced to consider the ongoing geopolitical climate and a presidential election year, which tends to be a favorable one for investors. Presidential election years tend to have a positive impact on equities, although the opportunity for gains is best in the wake of the election. Renewed geopolitical uncertainties could add to the customary election-related noise and add to volatility heading toward the middle of the year. From a seasonal perspective, odds for sustained gains improve into the second half of the year.
In closing out our Daily Market Dispatch article of the day we anticipate bank earnings to provide yet another layer of support for the markets, even if the early market reactions don’t cooperate. The move in bank stocks since Q4 2019 and up to this point may have already priced in some of the sentiment for the earnings period. We simply won’t know without hindsight.
Moreover, it’s clear that most fund managers and even retail investors have already leveraged their portfolios higher ahead of earnings season.
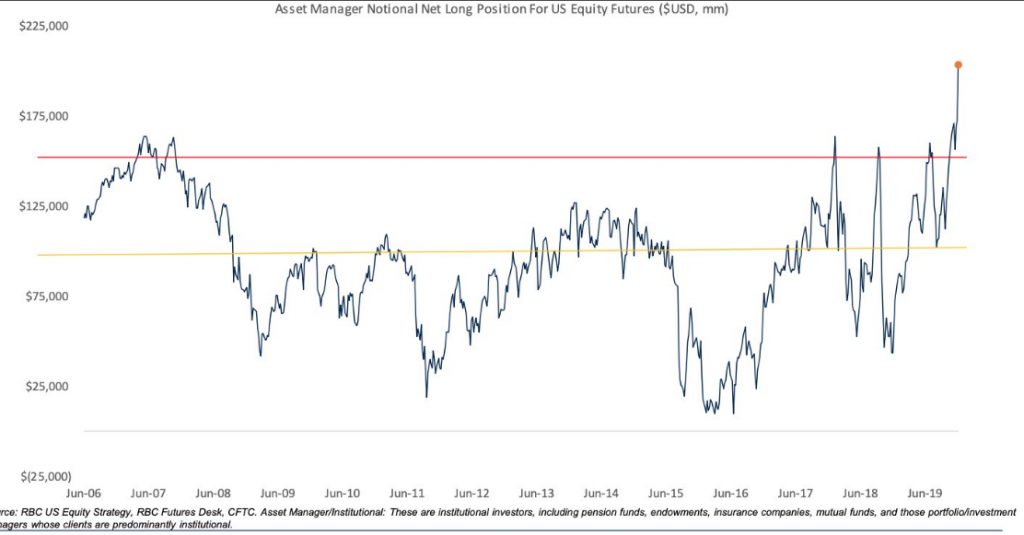
Head of US strategy at RBC Capital Markets believes the rally has moved into “euphoric” territory based on net-long positioning of asset managers going near-vertical. Sometimes, the anticipation of good news becomes a reason to sell the news. But again, we won’t know until we know!


