
“Discipline is rare because excuses are cheaper.”
– SETH GOLDEN, CHIEF MARKET STRATEGIST AT FINOMGROUP.COM
(CONTRIBUTOR/PREMIUM MEMBERS ONLY)

MID-WEEK SUMMARY
WEDNESDAY, DECEMBER 31st, 2025
Welcome to Market Mania #22!
I am ecstatic to get back to work following our scheduled, december-long vacation, and just wanted to kick off this publication by expressing my THANK YOU’s and gratitude to you for becoming a reader of our newest, weekly Market Mania publications and would like to wish you all a Happy New Years! May many more blessings come to you and your family in 2026 as they have done so in 2025.
As the S&P 500 (SPX) powers through the final stretch of 2025, the index continues to validate our bullish thesis, having most recently achieved its 38th all-time high on Christmas Eve, after satisfying our upwardly revised 6-month price target of 6,800 well ahead of schedule once again. While these milestones are significant, the savvy investor remains focused on the investing process rather than becoming anchored to subjective price targets.
We are currently navigating a high-probability window characterized by scheduled fund flows, including the highly-anticipated Santa Claus Rally and the Turn of Year (TOY) and January Trifecta Barometers. To assist in active portfolio management, we have outlined the critical quantitative price triggers and baselines established by our research.
S&P 500 Quantitative Price Triggers for Reference
- 6,339 (July NYSE A/D Line Confirmation Signal): This level represents the closing price from the July 2025 trigger date. Historically, this signal has a 100% positivity rate through year-end, informing investors that any dip below this level should be met with aggressive “buy the dip” activity.
- 6,600 (Fed Easing Floor): This was the closing value on September 17, 2025, when the Federal Reserve initiated its first rate cut of the cycle. Absent a recession, the S&P 500 has delivered a positive return every single time 1 to 12 months forward from this signal.
- 6,617 (TOY Barometer Baseline): This is the starting price for the Turn of Year Barometer period (November 19 to January 19). We monitor this level to determine if 2026 will trigger a Bullish, Neutral, or Bearish signal.
- 6,688 (Q3 Closing Anchor): As the September 30th closing value, this serves as a baseline for Q4 performance. In years where the S&P 500 ends Q3 up at least 10% YTD, it has finished Q4 higher every time.
- 6,791 (Wayne Whaley Trigger): Established on October 24th, 2025, this price level implies a **97.5% probability** of the index being higher by January 7, 2026. Only 1 failure out of 40 samples!
- 6,816 (Breadth Thrust Pivot): This November 26th closing value marked a “baby-Whaley” breadth signal (50-day low followed by >70% Advancing/Declining stocks). Historically, this has led to positive returns 12 months forward every single time.
- 6,840 (Trend Baseline): Quantitative trend analytics suggest the S&P 500 should close at or above this level to maintain its “perfect” historical trend for the November-December period.
- 6,849 (Lucky 7s Baseline): This was the November 2025 monthly close. Achieving a 7-month win streak is a rare “lucky” event that has never delivered a negative return 7 months forward, suggesting the market should trade above this level by June 2026.
- 7,600 (2026 Forward $SPX Price Target Objective): Once our current 6-month target expires at the end of Q1 2026, we intend to initiate this new 12-month forward price objective, supported by rising FY 2026 EPS estimates of $308–$310 per share.
The 2026 Macro-Strategy Pivot
While the immediate path is supported by approximately $5.3 billion in daily corporate buyback demand through year-end, we must prepare for the “truculence” of the 2026 Midterm election year. Year 2 of the Presidential cycle is historically the most difficult, with an average peak-to-trough drawdown of -17.5%. It is important to note 4-6 year old bull markets often offer greater (on average) longer-run consolidation and accumulation opportunities for further-sighted investors.
Nevertheless, we are issuing a “spoiler alert” for January 2026. Quantitative patterns since 2008 suggest we may enter the first of three consecutive negative January return years. Anything otherwise should be considered a strongly bullish signal, so lets hope we stayed off that naughty list this year folks… average next year return is almost 4% greater the following year when we do so, and three consecutive years without Santa would definitely be a red flag 🚩 for the history books considering the duration (38 months) of this NON-recessionary 4 year-old bull market.
Current bull market (since Oct '22) is 38 months
Only 1 non-recessionary bull mrkt has lasted longer (43 months)
2026 = probability of govnt' shutdown, SCOTUS (Jan)
2026 = new Fed chairman bond mkt test
2026 = renegotiation of USMCA
2026 = Midterm-election $SPX $ES_F… pic.twitter.com/5Cm0mFdEj2— Seth Golden (@SethCL) January 2, 2026
Our strategy remains constant: continue to BUY AND HOLD but utilize the “1% for 1%+” bolt-on trading strategy to continuously lower cost averages on core holdings. We specifically favor Health Care (XLV)—designated as “2026’s bride’s maid trade of the year”—which has recently staged a vertical recovery and is positioned for continued outperformance into the first half of 2026.
Bottom Line: Higher-highs are the highest probability outcome into January, but extended markets are fragile by nature and prone to headline shocks. Use the current strength to manage cash wisely so you can treat future downturns as “BUY” executions.
The trend is your friend, just don’t fall in love with the trend.
CHART(S) OF THE WEEK
🏆 TODAY’S CHART OF THE WEEK WAS SHARED BY SETH GOLDEN (@SethCL):
🏆 CHART OF THE WEEK: The 2009–2020’s Bull Market Analog
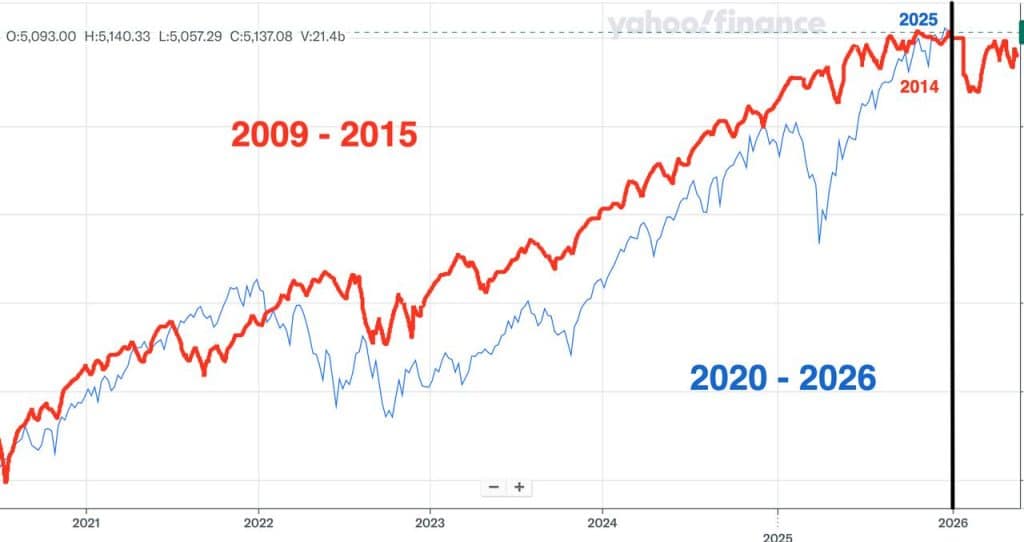
The current market regime exhibits a remarkably high correlation with the post-Global Financial Crisis cycle of 2009–2015, providing a robust empirical framework for the current 2020–2026 bull market analog. As we approach the terminal phase of 2025, the S&P 500 (SPX) is mirroring the late-2014 “melt-up” with precision, characterized by an exceptional momentum profile that recently culminated in the index’s 39th all-time high of the year. My question to you here is, “have you done your research on what transpired in 2015 yet?” I know I have!
The Quantitative Anchor: Zweig Breadth Thrust (ZBT)
While price action remains the primary signal, the structural integrity of this advance is fundamentally anchored by the Zweig Breadth Thrust (ZBT). The specific price trigger for this high-confidence signal—which identifies a rare and powerful shift from oversold conditions to extreme participation—is 5,484. Historically, a ZBT trigger implies a 100% positivity rate over the subsequent 6 and 12 months, suggesting that even amidst potential intra-year volatility, the intermediate-to-long-term path of least resistance remains skewed to the upside and savvy investors should remain on dip-buying mode given muted re-inflationary trend and increasingly strong earnings growth and profit margins expectations in 2026.
Analog Correlation and the 2026 Transition
The provided analog chart illustrates a “mirror image” trajectory where the current blue line (2020–2026) tracks the red line (2009–2015) across multiple fiscal years.
- The 2025 Momentum Phase: The vertical ascent seen in late 2025 replicates the late-2014 expansion, where the market defied overvaluation concerns to push into new record territory.
- The 2026 “Vertical Line” Boundary: As the market crosses the threshold into 2026, the analog ALSO anticipates a regime shift into “Year 2” of the Presidential Cycle. This is historically a “truculent” period, often characterized by average peak-to-trough corrections of approximately -17.5%, in confluence with hi-lo logic quant typical max drawdown. Keep in mind this scenario could include higher prices in the interim before reaching the 10%+ drawdown we are once again anticipating.
- Post-GFC $SPX almost perfect analog for Post-Covid performance
- Post-GFC’s 5-yr (2014) performance reflected in Price convergence for both trends at 2025-end.
- Analog identifies 2015/2026 volatile/flattish year.
- Anyone doubting the analog since 2020 has been wrong. Analogs are guides, not predictions, not forecasts.
- We have utilized this analog since 2020. After Covid low, we had calculated 3,761 as objective by year-end 2020 as early as July of that year. In 2025 it calculated at least 6,791 by year-end. Only significant deviation in analog was 2010/2021 i.e. Flash Crash/Meme Craze.
The January Paradox: Expectancy vs. Performance
A critical point for active portfolio management is the potential for a January upward surprise. While quantitative patterns (specifically the “3-up, 3-down” January cycle) suggest a negative expectancy for January 2026, the current analog correlation implies that momentum could carry further into the first quarter before the Midterm year volatility takes hold.
- Win-Win Methodology: This creates a “win-win” scenario for the disciplined investor. Should January surprise to the upside, a savvy investor should remain long anyways as the core holdings within said portfolio captures the momentum of the new all-time high. Conversely, should the market succumb to the projected negative January return, it validates the “Year 2” correction thesis, providing an optimal entry point to deploy the “1% for 1%+” trading strategy and lower cost averages on core holdings slowly over time.
Strategic Synthesis
In the larger context of the Finom Group 2026 Macro-Market Outlook, we must respect the market’s primary directive: “She speaks, and you listen”. This philosophy prioritizes empirical evidence—such as the ZBT trigger and scheduled fund flows—over subjective predictions. While analogs eventually and “meaningfully diverge,” the current high correlation suggests that the path to a 7,600 long-term price objective remains intact, albeit with the turbulent “air pockets” of a Midterm election year clearly visible on the historical map.
BONUS:
Jan. Barometer "Pattern of 3s" has been perfect since 2008: 3 down Jan, 3 up Jan, 3 down Jan, 3 up Jan etc. informing of 3 down Jan starting 2026, unless pattern finally breaks, and maybe…
Jan. midterm years positive 47% of time, but jumps to 80% during 2nd-term midterms.
If… https://t.co/nhQ2iBAdp4 pic.twitter.com/3EWS6nfmnn
— Seth Golden (@SethCL) December 22, 2025
PSA:
60/40 portfolio has, for the sake of Wall Street fees, forced investors to suffer 6, not 1, not 2, not even 3 but 6 lost decades.
You're in one right now!$SPX $TLT $SPY $QQQ $NYA $BTC $TMF $TNX $IWM $DIA $MAGS $RUT https://t.co/0IkKapNIPX pic.twitter.com/zZZgWgSaMj
— Seth Golden (@SethCL) December 22, 2025
Last decade's perennial bearishness toward U.S. Treasuries has continued in the 2020s. In fact, bond bears have grown even more emboldened the last few years, pushing net short positions to new extremes. #Treasuries #BondBears pic.twitter.com/HqXWEuxWGo
— The Leuthold Group (@LeutholdGroup) December 22, 2025
At each year end, we’re reminded by the intelligencia how stupid and pointless Wall Street Strategists are, as if this observation is new or novel. And each year I defend my brethren by noting almost none to my knowledge have ever put much weight on the index price target. It’s a… pic.twitter.com/elnQmUGa48
— Dan Greenhaus (@DanGreenhaus) December 22, 2025
This is the bull case in one single stat 👇
Street forecasts 13.9% net margins for $SPX in 2026, an all-time high. As RBC puts it: "We’re in the golden age of margins."
HUGE expectations are baked in. https://t.co/eI0cbv1F38
— Schaeffer's Investment Research (@schaeffers) December 22, 2025
"forecasts are notorious for being consistently wrong. Targets for the S&P 500 tend to trail the actual index’s performance by two months, according to data from Piper Sandler & Co. The behavior is the same for individual stock targets, too."
“The direction of the market is a… https://t.co/WuAptl1hwd pic.twitter.com/UNC4ZCPgnY
— Neil Sethi (@neilksethi) December 24, 2025
Earlier this month, we noted that after a 2%+ Thanksgiving rally, December returns for S&P 500 tend to be muted until Santa Claus Rally begins – now just 2 days away. In these cases, Santa Rally averaged +2.4% and was positive 11 of 12 times. The only miss was 1981. $SPX $SPY https://t.co/uQUxE4a8q8 pic.twitter.com/Akq0NKtFaH
— Bluekurtic Market Insights (@Bluekurtic) December 22, 2025
The S&P 500 could secure its third year in a row of 20% gains over the next week.
That's happened 12 times across global markets since 1928.
The rally extended to a 4th year in 5 of those 12 times, with an average return of 12%, per @fundstrat @HardikaInvests. pic.twitter.com/XKV9EtIIBE
— Phil Rosen (@philrosenn) December 22, 2025
I like to say if you must panic, panic early and in April It was better to be greedy
panic early means selling down some high multiple fluff now/today not at $vix 45 https://t.co/wblMuOJsP0
— Howard Lindzon (@howardlindzon) December 23, 2025
8/ Cyclicals outperformed defensives for 14-days, a rare streak. Goldman Sachs data since 2007 show that such patterns are a strong signal of positive $SPY returns over 3-9 months, indicating improving macro conditions. pic.twitter.com/KqarAhCPth
— Alex Barrow (@MacroOps) December 22, 2025
QUOTE(S) OF THE WEEK
Quote of the day: pic.twitter.com/X2Deh9tFn7
— Mark Ungewitter (@mark_ungewitter) December 30, 2025
This is the key to doing great work…
I call it the Energy-Output Curve:
At the beginning of any project, there’s an initial surge. The activation input of energy is rewarded disproportionately.
You get a huge gain in output quality for a relatively small investment of… pic.twitter.com/3JJTwrMtDS
— Sahil Bloom (@SahilBloom) December 30, 2025
Again, say it📢loud and factually proud!
There is no interconnectivity betwixt Fed repo market operations and equity markets. No matter how much Fed plumbs the repo-market, no pipes lead to $SPX $NDX There is no magic button or lever the Fed pulls.
Nobody likes hearing their… pic.twitter.com/cCxhYG1eaQ
— Seth Golden (@SethCL) December 30, 2025
Major cheat code for life: Tolerance for boredom. Success isn't flashy. It's built through long periods of extremely disciplined, boring routines. If you need constant novelty, you won't make it very far. To shine in the light, you have to embrace the boring work in the dark.
— Sahil Bloom (@SahilBloom) August 5, 2025
Double-digit growth is coming within 12 to 18 months.
If applied intelligence is proxy for economic growth, which it should be, triple-digit is possible in ~5 years.
— Elon Musk (@elonmusk) December 24, 2025
"When you're 20 you care what everyone thinks, when you're 40 you stop caring what everyone thinks, when you're 60 you realize no one was ever thinking about you in the first place."
Winston Churchill
— Michael Dunne (@dunne_insights) December 23, 2025
“Blind belief in authority is the greatest enemy of truth.”
― Albert Einstein pic.twitter.com/vZoEvnP47z
— Saganism (@Saganismm) December 22, 2025
Said "nobody ever" who compounded gains in MAG-7, just to name 1 style factor.
Difference between dogma and practicality can prove costly. Wall Street religion is often illogical, lacking evidence, but often sounds like risk mgmt so widely accepted as truth, when in reality… https://t.co/tpLHu39tqt
— Seth Golden (@SethCL) December 16, 2025
If you thought of volatility as part of the journey to achieving the goal, it becomes a lot more entertaining!
Unbutton your collar, enjoy the #investing trek! pic.twitter.com/SEUURfHsI6
— Seth Golden (@SethCL) December 22, 2025
What looks like a bull market in gold is really a bear market in trust.
— Simon Mikhailovich (@S_Mikhailovich) December 23, 2025
TOP 10 TWEETS OF THE WEEK
Over-anticipating market tops may be hazardous to your wealth. https://t.co/kaJBpnIVwV
— Mark Ungewitter (@mark_ungewitter) December 19, 2025
$SMH $SOXX Semis just touched 6-MMA
If just a touch and no persistent closes below, tis a good consolidation and sign of strength going forward.
Win rates are high for both Semis and S&P 1-3 months forward $SPX
N = 13
Up = 12
Down = 1$SPY $XLK $QQQ $NVDA $ASML $MU $AMD… pic.twitter.com/xqHWoxPcJg— Seth Golden (@SethCL) December 21, 2025
The revamped BofA Bull & Bear Indicator rises to 8.5 from 7.9, not yet to the 8.9 on Oct 1st which was “an extreme bullish level last seen in Feb’18 & Feb’20,” but good enough to again trigger the “contrarian sell signal" “on huge inflow to equity ETFs, rising global stock index… pic.twitter.com/EsYcTb0fvN
— Neil Sethi (@neilksethi) December 19, 2025
2017 wants their record back
2018 wants their record back
2019 wants their record back
2020 wants their record back
2021 wants their record back
2023 wants their record back
2024 wants their record back1st day? See my associates at the exits for some brochures!$SPX $SPY $QQQ… https://t.co/w7ScgxRB99
— Seth Golden (@SethCL) December 13, 2025
Lead up to mid terms…
There’s a common perception that midterm years, or the lead-up to them, are bad for markets.
If you look at the full historical dataset, midterm years are actually fine. Mixed at times, but it was really the 60's that skew the data.
If you narrow the… pic.twitter.com/kU39kF7RY0
— Sean D. Emory (@_SeanDavid) December 21, 2025
CBOE Nasdaq 100 volatility ( $VXN) has fallen below 19 after spiking above 30 for the first time in over 3 months. 14th such case since 2000. In prior cases, $NDX was higher 91.7% of the time 12 months later, with an average gain of 14.45% and a max drawdown of 16.6%.
💡@SethCL pic.twitter.com/iJUa1luWf9— Bluekurtic Market Insights (@Bluekurtic) December 19, 2025
Only 6 prior years saw a 10%+ year to date selloff in S&P 500 that still closed positive. The following year was higher 6 out of 6 times! Interestingly, in prior 4 cases, peak for the year did not come until December. pic.twitter.com/QaVhp1SGu9
— Bluekurtic Market Insights (@Bluekurtic) December 4, 2025
Broad-based leadership from cyclical sectors has been bullish for stocks. We are seeing that now, with the highest percentage of cyclicals trading above their 50-day relative strength moving averages in over a year. pic.twitter.com/FhRSs0yc2C
— Rob Anderson, CFA (@_rob_anderson) December 23, 2025
Always about the EARNINGS!
This is the simplest explanation for why the stock market has roared higher this year, but it's too perfect and doesn't breed concern or fear.
Can't generate ad revenue with such facts in the financial media.$SPX $SPY $QQQ $NYA $IWM $DIA $NVDA… pic.twitter.com/NNzcXzRb5m
— Seth Golden (@SethCL) December 23, 2025
Point of interest regarding $VIX 14 and why that doesn't mean much, let alone a low level. Consider $VVIX often leads VIX and VVIX median historically is around 84, where it resides presently and where you see folks starting to hedge. They're hedging the median, get it?
Tell me…
— Seth Golden (@SethCL) December 23, 2025
VIX is currently in the 13–14 range. Historically, when volatility index $VIX sits in this regime, the S&P 500 delivered 10.9% average 12-month gains, with a 10.3% max drawdown and an 86.5% positivity rate. A constructive market setup heading into a midterm year. pic.twitter.com/tA1cuqyGdC
— Bluekurtic Market Insights (@Bluekurtic) December 23, 2025
Which brings me to the long wave and when (and if and how) it will eventually end. Looking at the 1949-1968 and 1982-2000 secular bull markets, this one appears to be in its final innings. pic.twitter.com/9UjU9oTsVn
— Jurrien Timmer (@TimmerFidelity) December 23, 2025
How many times have you heard that AI is the only reason the economy is growing?
Over the last two quarters, categories linked to AI spending only accounted for 15% of growth, and their share of GDP is less than 5% overall. pic.twitter.com/s0DwKq7xrO
— Bespoke (@bespokeinvest) December 23, 2025
Fundstrat's Tom Lee: In 2026 Fed "put" is back!
Fed Put years:
______________
2009 = +23%
2019 = +29%
2020 = +16%
2026 = ??%Fundstrat S&P500 $SPX price target 2026 = 7,700$ES_F $SPY $QQQ $NYA $IWM $SMH $NVDA $BTC pic.twitter.com/w6a4jlvM1B
— Seth Golden (@SethCL) December 24, 2025
85% of the time, $SPX has been higher in years ending with a 6. Only 4 times was the market negative. $SPY $ES_F $VOO $NYA $QQQ $COMPQ $NDX $NVDA pic.twitter.com/TfGw8dnJr4
— Seth Golden (@SethCL) December 24, 2025
Cycle Composite 2026 $SPX roadmap
Strong start to the year!
Sell in May is strongest in 2026 Midterm year.
Path is usually quite accurate, $VIX volatility greater!
Markets bottom in October
Strong finish into Year 3 (never negative return Year 3)$ES_F $SPY $QQQ $IWM $NYA $SOXX… pic.twitter.com/Wcyaz87F38— Seth Golden (@SethCL) December 24, 2025
DB: Investor positioning in the Consumer Staples sector is at just the 8th percentile to 2010, the least since 2019. pic.twitter.com/UaozNkz24t
— Neil Sethi (@neilksethi) December 24, 2025
Not just that VIX gets below 14 but how it does so?
2023 when VIX got below 14; green all forward time periods.
2024 when VIX got below 14, lot more red.
The difference? Possibly dispersion/stock correlations.
3-month implied correlation much higher in 2023 than 2024.
2025's… pic.twitter.com/UEQzNomYBi
— Seth Golden (@SethCL) December 26, 2025
Spot GPU prices at AWS rising across all GPU vintages for the last few months, all while the "AI-bubble" hand wringing reached a fevered pitch. Remember, some bubblers say rental prices should be in permanent decline from oversupply and obsolescence. pic.twitter.com/a3AS1sREkI
— Fernando Vidal (@fernavid) December 24, 2025
Meanwhile… Fund managers are going the other way!
Around $1 trillion was pulled from active equity Mutual Funds over the year, marking an 11th year of net outflows. $SPX $ES_F $SPY $QQQ $NYA $IWM $VOO $SMH $NVDA $AAPL $TSLA $AMZN $MSFT $GOOGL https://t.co/RqR6pqD5M5 pic.twitter.com/JXzlFBhW2D
— Seth Golden (@SethCL) December 28, 2025
Nasdaq Composite has never returned less than +7% in Decennial Year 6
________________
1976 = +26.10%
1986 = +7.40%
1996 = +22.70%
2006 = +9.5%
2016 = +7.5%
2026 = +__%$COMPQ $NDX $QQQ $TQQQ $SOXX $MAGS pic.twitter.com/TDHRxShqok— Seth Golden (@SethCL) December 27, 2025
The Nasdaq $COMPQ is historically the worst performing large-cap index during Midterm-election year.
Average return has been negative, and little better than a "coin flip" positivity rate.
AI trade during Midterm year is going to be tested!$QQQ $SPX $SPY $NDX $NVDA $SMH… pic.twitter.com/U9WLOV4EoK
— Seth Golden (@SethCL) December 28, 2025
Magnificent Seven earnings are forecast to grow 16.5% in 2026 on 15% revenue growth, following 2025 earnings growth of 21.7% on 11.9% higher revenue. AI capex may compress margins short term, but it signals reinvestment and faster top-line momentum – not weakening fundamentals. pic.twitter.com/KT5g6v1qQT
— Bluekurtic Market Insights (@Bluekurtic) December 28, 2025
Goldman: A risk to 2026 is a sharp increase in interest rates. The cyclical rally during the past few weeks has been accompanied by a 15 bp jump in 10-year TIPS yields and a rise in the nominal 10-year Treasury yield from 4.0% to 4.2%.
In the past, stocks have generally… pic.twitter.com/1l4F2nN6SD
— Neil Sethi (@neilksethi) December 29, 2025
Top 10 companies by decade
None from 1995 are in today's Big 10. JPMAM pic.twitter.com/koI7irD0yi
— Mike Zaccardi, CFA, CMT 🍖 (@MikeZaccardi) December 28, 2025
It’s Santa Claus Rally week. Santa has never skipped three consecutive years. With the S&P 500 less than 1% from its all-time high, Santa could push markets to new highs before year-end. And yes – Santa favors Financials, which have the highest positivity rate of any sector. https://t.co/dXfdkEOfs0 pic.twitter.com/W6hX2JOkuC
— Bluekurtic Market Insights (@Bluekurtic) December 22, 2025
New data from @DataTrekMB this morning shows most of Big Tech is still seeing above average positive earnings revisions.
"US Big Tech names have superior Q4 and 2026 earnings estimate momentum relative to the rest of the S&P 500, an underappreciated fact about these structurally… pic.twitter.com/uqQqfJIT0w
— Josh Schafer (@_JoshSchafer) December 30, 2025
$SPY #SPX #seasonality – 2026?
2024 and 2025 closely tracked the four-year election cycle from a seasonal perspective—raising the question of whether 2026 will continue to conform to this pattern. pic.twitter.com/5Js3FRRHYa
— Nautilus Research (@NautilusCap) December 30, 2025
Thank @SethCL for all he does!,… https://t.co/RYUqES5kKZ
— David H (@JIMROInvest) December 28, 2025
FWIW, corporate insiders at Nasdaq 100 Index constituent companies are STILL BUYING at a well above average rate.
A bull market “guarantee?” Nope.
Favorable “weight of the evidence?” Yep (IMO)@sentimentrader pic.twitter.com/8PlLOkTDaU— Jay Kaeppel (@jaykaeppel) December 30, 2025
Rotation has been the key theme in December'25… it was key concern in December'24. https://t.co/VDt8Bau9iN
— Frank Cappelleri (@FrankCappelleri) December 31, 2025
Trend channel perspective. My take? SPX is likely to ride the upper rail until mid-2026 or longer based on post-April-2025 momentum. Happy New Year, everyone! pic.twitter.com/rDkcs6GDpU
— Mark Ungewitter (@mark_ungewitter) December 31, 2025
Nearly bear market territory in $SI pic.twitter.com/1g6G28u2K7
— Chris Dover (@ChrisDMacro) December 31, 2025
JOIN THE FINOM GROUP FAMILY – CLICK HERE TO UPGRADE NOW!
Master the markets with Seth Golden and our “Finominals” community! For just $29.99/month, unlock weekly 5000+ word macro research reports packed with charts and actionable insights. Go Premium at $84.99/month for daily Telegram Traders Corner, myth-busting Zoom sessions, and live 1%+ scalp/swing trading with Seth. Don’t let market noise win—join our Contributor or Premium Membership to build confidence and achieve your financial goals.
[Click here for a free Morning Market Setup sample from December 30th 2025!]
FINOM GROUP – RECENT REPORTS
November 30, 2025 – 2026 FULL YEAR MACRO-MARKET OUTLOOK RESEARCH REPORT
December 7, 2025
Technicals And Quants Speak Well Into Year-End 2025, But Valuations…
December 14, 2025
December 21, 2025
December 28, 2025
The Top of 2025, Bottom of 2026
YOU’RE ALL CAUGHT UP NOW. THANKS FOR READING!
If you have any questions, feel free to message Seth Golden or contact us support@finomgroup.com
Comment below or tag us on X (@FinXWeekly) with your thoughts—your feedback drives our innovation.


