
Welcome to another trading week!! In appreciation of all of our Basic Membership level participants and daily readers of finomgroup.com content, we offer the following Weekly Must Know macro and technical analysis. Our weekly Reports are extremely detailed and have proven to help guide investors and traders during all types of market conditions with thoughtful insights and analysis, graphs, studies, and historical data/analogues. We encourage our readers to upgrade to our Contributor Membership level to receive our Weekly Research Report and State of the Market Videos. Have a great trading week, be in touch, and take a look at some of the materials we have extrapolated from recent Reports!
Weekly Must Knows #1
Gary Shilling: “Recall that yields on 30-year government bonds started to decline on Jan. 2, anticipating the fallout from the budding coronavirus crisis that had taken hold in China. Yields fell from 2.34% on that day to 0.94% on March 9, as the price of the benchmark 30-year bond leaped 29%. Only on Feb. 19—seven weeks later—did the S&P 500 Index begin its 35% slide. Fast forward and 30-year yields have fallen from 1.66% on June 8 to a recent 1.19% as their prices climbed 9%. The question is whether stocks will follow again, and with a similar lag of about seven weeks.
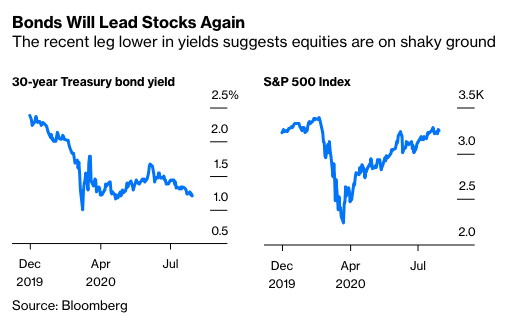
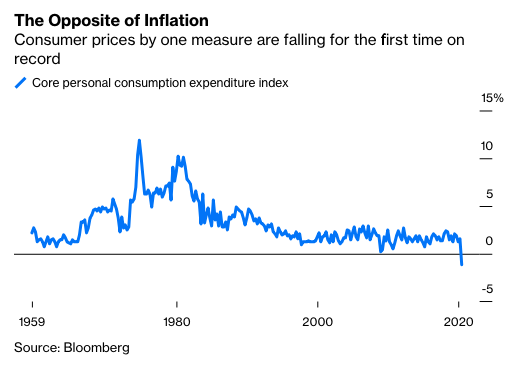
The recent Treasury bond rally fits with our forecast that the recession has a second, more serious leg that will extend well into 2021, despite massive monetary and fiscal stimulus. Declining business activity saps private credit demand and makes Treasuries shine as havens. A deep recession also breeds deflation to the benefit of Treasuries. The government said Thursday that its core personal consumption expenditure index, which is what the Federal Reserve uses to track inflation, fell 1.1% in the second quarter.“
Weekly Must Knows #2
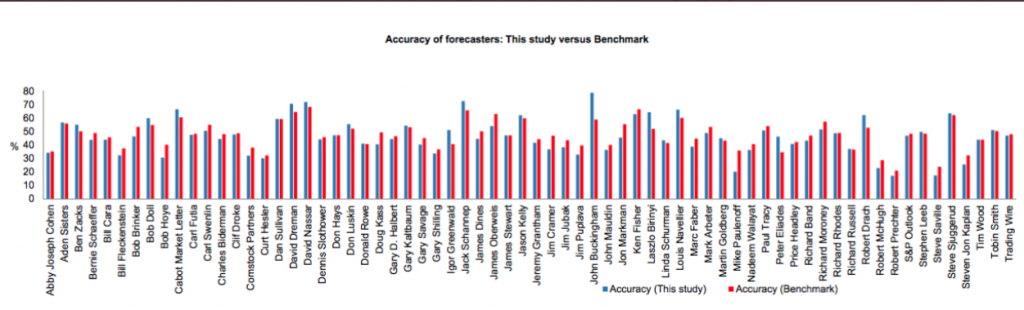
This is par for the “Gary Shilling” course. He is quite literally one of the worst market forecasters of his time. Attached accuracy of his calls over the years.
Weekly Must Know #3
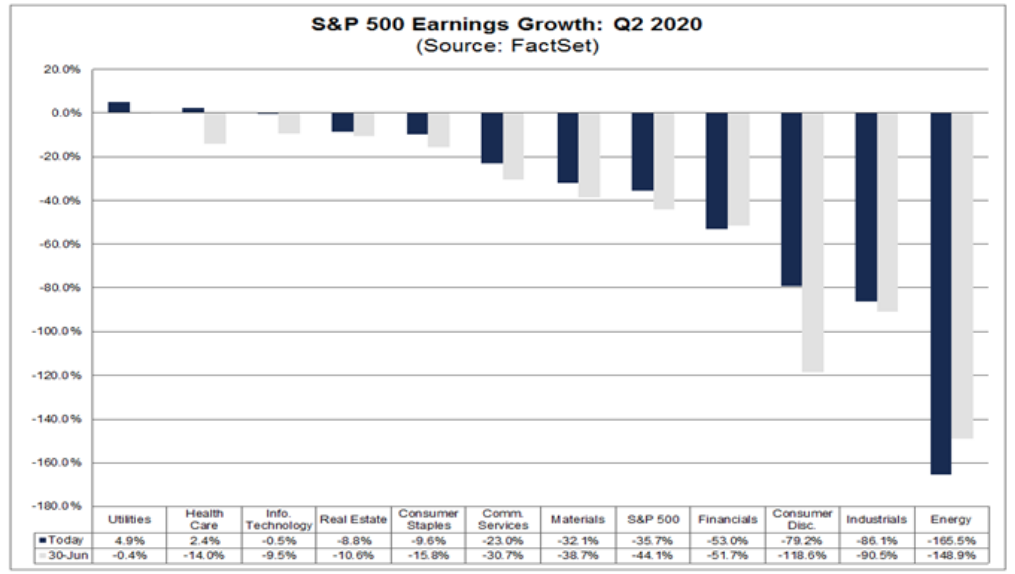
The blended (combines actual results for companies that have reported and estimated results for companies that have yet to report) earnings decline for the second quarter is -35.7%, which is smaller than the earnings decline of -42.4% last week. Positive earnings surprises reported by companies in multiple sectors (led by the Consumer Discretionary sector) were responsible for the decrease in the overall earnings decline during the week.
“Finom Group believes there is ample enough evidence to support a continuation of earnings and sales beats through the Q2 2020 reporting season, as the previous forecasts are being proven too pessimistic and without recognition of the strong sales and earnings power provided by healthy, on-trend businesses residing in the Information Technology, Financial, Health Care and Communication Services sectors of the economy. Having said that, we do not anticipate earnings season to be a driver of future price gains for the broader indices, as we can see from the early reaction to earnings reports, investors have potentially priced in such beats.”
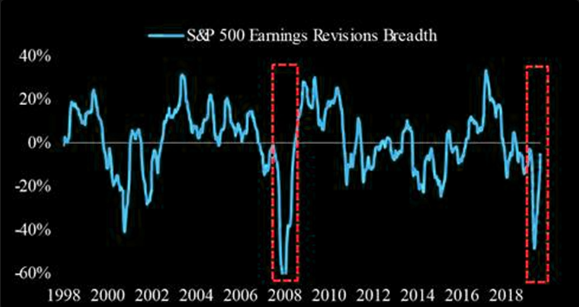
Earnings breadth revisions in 2020 look incandescently similar to the earnings breadth revisions in 2009. This might be one of the reasons the S&P 500 and Nasdaq indices are traveling the same path as 2009.
- The widespread beats are translating to rising Street estimates. It’s worth flagging, as this tends to be one of the best predictors of forward performance, and again, it’s broad based.
- In addition, it’s another friendly reminder that things did not get as bad as feared, and the SPX is perhaps trading more cheaply than it would otherwise seem.
Weekly Must Knows #4
-When does the S&P 500 deliver it’s greatest annual returns?
-When earnings are at their worst.
-Historically SPX is performing as it always has when earnings trough.
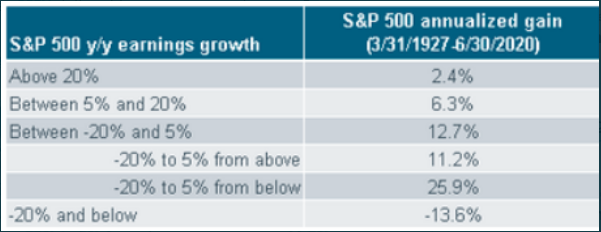
- Least you think the stock market has lost its mind, it is historically “normal” for rallies in stocks to accompany still-weak earnings. As the table above shows, the best range for earnings in terms of accompanying stock market performance is -20% to +5%.
- The data is culled by our friends at Ned Davis Research; and I recently asked them to look at that particular bracket to see the performance difference if earnings were rising into that bracket vs. falling into that bracket.
- In the case of the former, stocks have returned nearly 26% on an annualized basis when earnings were in that bracket. Yes, stocks have had their worst performance during periods when earnings were imploding (by more than -20%); but given their “discounting mechanism” nature, stocks tended to rise sharply in anticipation of the improvement (i.e., they don’t “wait” until it’s already clear).
Weekly Must Knows #5
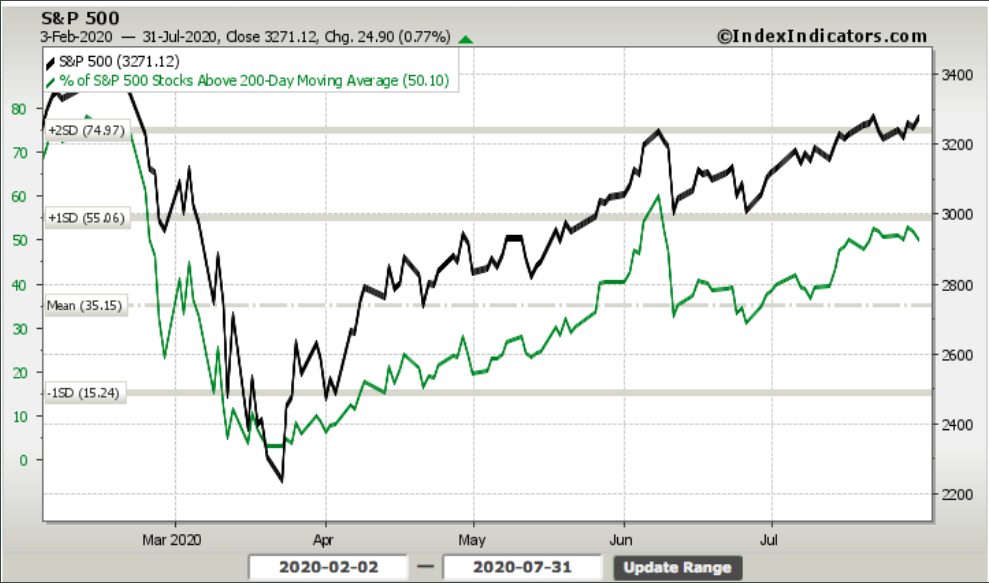
Friday July, 31, 2020’s S&P 500 gain of .77% not only occurred with 56.15% of the index declining, but also with 62%+ declining volume. In at least 30 years, the S&P500 has never rallied at least 0.75% with more than 60%+ declining volume…until that day.
Weakening breadth was abundant across most market internals we monitor including a slight weakening in the percent of stocks trading above their 200-DMA for the week.
The same can be said, but to a greater degree when it comes to the percent of stocks trading above their 50-DMA. It is easier to see the breadth divergence in this particular breadth indicator noted in the chart below. The S&P 500 is going in one direction with the breadth indicator falling, in the opposite direction.
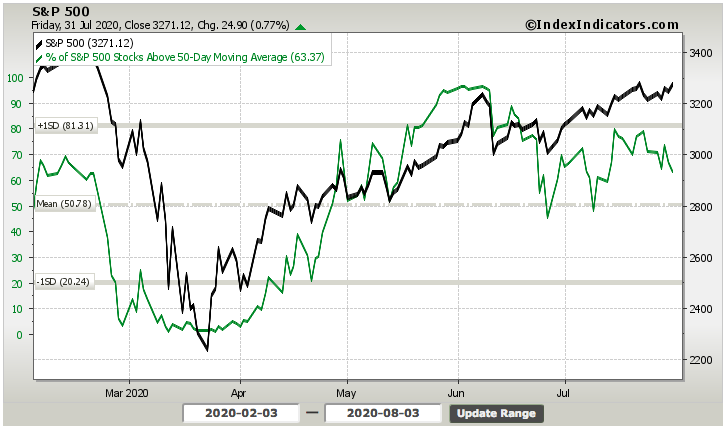
BUT… Remember, we absolutely desire to see weakening breadth post breadth thrust and in keeping with new bull markets. Look at what returns are like after high breadth readings retreat and/or consolidate after significant breadth thrusts, such as the one’s we saw in early June 2020. Some breadth weakness is normal and to be expected within the context of a new, healthy bull market.
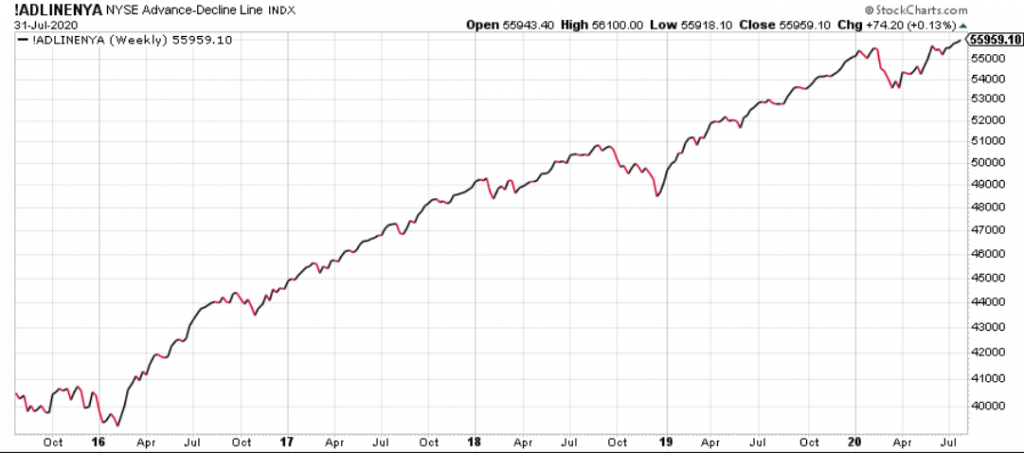
- Weekly NYSE A/D line made another new all-time high last week for instance.
- Historically, this peaks about a year before the S&P 500 does.
- Breadth isn’t as bad as the Twittersphere would have folks believe.
Weekly Must Knows #6
R. W. Baird: Willy Delwiche
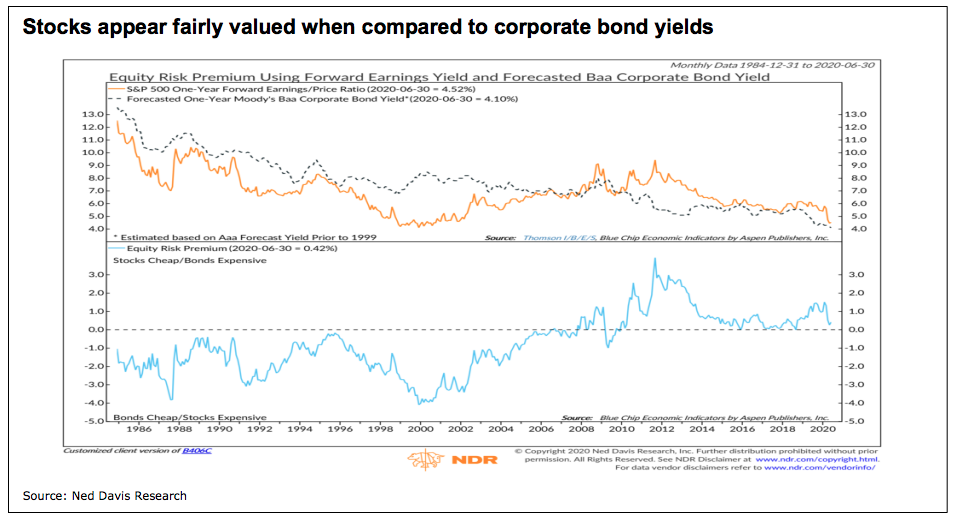
“Absolute valuations are moving to extreme levels but stocks appear fairly valued when compared to corporate bond yields. While not big fans of relative valuation measures (especially those comparing stocks and government bonds), this particular comparison has some merit. It poses a simplified question: given corporate exposure, which vehicle (stocks or bonds) provides a more attractive value. In terms of this valuation measure, stocks are not as cheap as they were a decade ago, but nor are they as expensive as they were two decades ago.
We are also encouraged by data revisions in this morning’s otherwise dismal Q2 GDP report. As revised, the path of GDP profits coming into 2020 was more constructive than previously reported. Rather than falling short of their previous peak, GDP profits made higher highs in 2018 and 2019 (including a new all-time high in profits as recently as Q4 2019). While this provides a more encouraging starting point, the path forward remains a challenge.
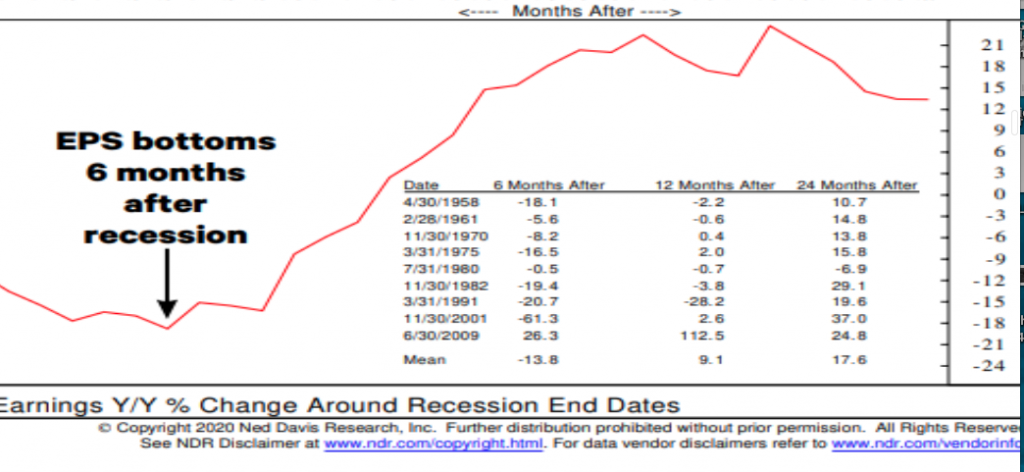
Conventional price earnings ratios have soared as stocks have anticipated improving economic conditions. Stocks tend to bottom four months before recessions end, but company fundamentals (sales & earnings) do not usually trough until 6 to 9 months after the economy bottoms. At 4 1/2 months after the S&P 500 low it might be time for the economy to show what its got, but earnings likely have another six months of grace. Overall, valuations are not a near-term concern (we rate them neutral in our weight of the evidence) but high P/E ratios and low bond yields could mean depressed returns for both asset classes in the years ahead.“
Weekly Must Know #7
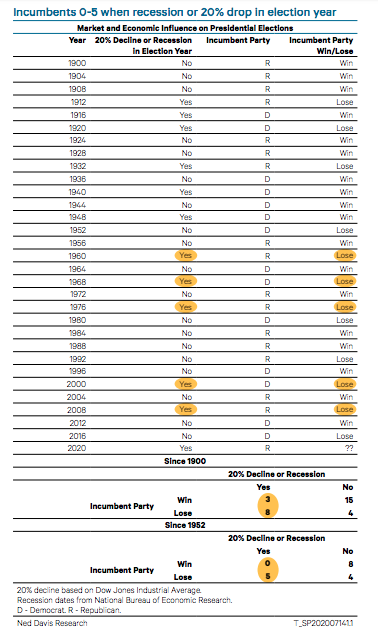
The last president to lose a reelection bid was George H.W. Bush in 1992. No millennial, and few Gen-Xers, have invested under the cloud of an incumbent failing to win a second term. In other cases, this election is unique. A recession is one of the worst events for an incumbent. Because the cause of the 2020 recession is an exogenous shock, one of the biggest questions heading into the fall is whether voters will blame President Trump for the economy.
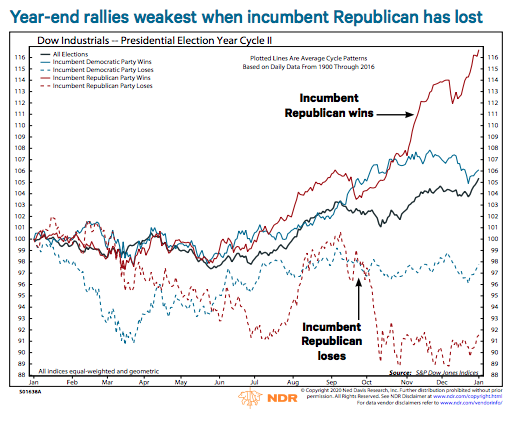
Since 1952, no party has retained the White House when there was either a 20% decline or a recession. Both have taken place in 2020. Note that we often use the DJIA for its longer history, but trends are similar with the S&P 500.
Weekly Must Know #8
As shown in the LPL Chart of the Day, the combined weight of the top five stocks in the S&P 500 has increased to its highest level ever, at nearly 22%. Only one of those five stocks (Microsoft) was a top five name in the index during the previous peak of March 2000.

“But does this pose a risk to the index? From a diversification standpoint, one could certainly argue it does. For instance, if any shared risks should come up, from regulation, for example, it could do outsized damage to cap-weighted indexes. However, we believe that the recent gains have been justified by the fundamentals, and we continue to favor both large caps over small caps, and growth-style stocks over value stocks. According to analysis from Credit Suisse, over the past 12 months, the top five stocks in the index have grown revenues at 11.2% vs. just 0.8% for the rest of the S&P 500. Further, the remainder of the S&P 500 has subtracted roughly $17 from S&P 500 earnings per share (EPS), while the top five stocks have added more than $12.”
Weekly Must Know #9
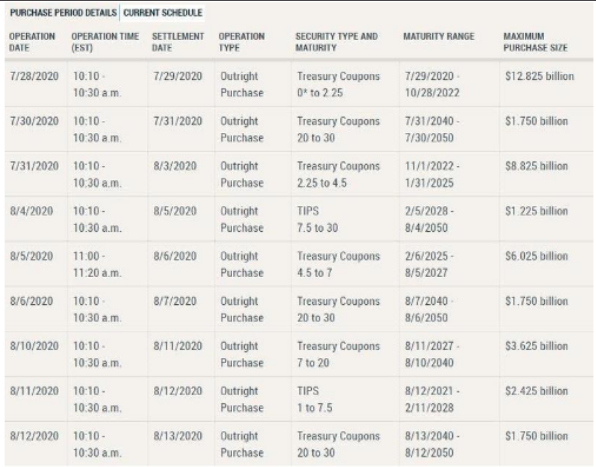
Below is the most recent schedule of POMO (Permanent Open Market Operations) from the Federal Reserve Bank:
- As shown and when compared to weeks past, POMO dollar value for outright purchases is less than in past weeks and months.
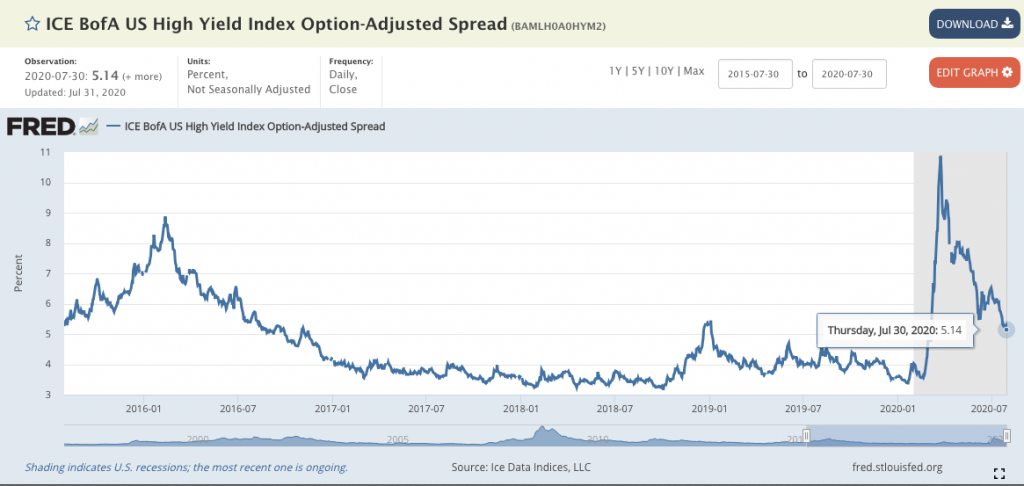
To-date, it is clear that the Fed has significantly improved credit market functions through its many lending facilities and QE implementations. High yield credit spreads have contracted to their best levels since the pandemic crisis began.
Weekly Must Know #10
J.P. Morgan’s John Normand:
- A modest stock market correction could occur in the next few weeks but doesn’t justify bearish targets or even a defensive investment strategy.
- Coming data releases, such as payrolls on Thursday and retail sales on Aug. 14 could “undershoot expectations” and drive the modest correction.
- “Some misgivings are justified given a macro backdrop that is becoming muddied, but not muddied enough to justify bearish targets or a defensive investment strategy.”
- A large correction (about 10%) would be tough to generate when positioning measures in equities are below average for most hedge funds,” they add.
- August may be one of the most bearish months for risky markets, but there were “as many signs of calm as of concern,” at the start of the month.


