
With each passing day we edge closer to the all-important earnings season, the markets extraordinary rally comes into question and as earnings are expected to decline for the Q2 2019 period. A market retracement has been eyed, forecasted and rationalized based on the aforementioned and is seemingly in the works as the major averages fell for a 2nd straight trading session. In this week’s Research Report, Finom Group discussed the probability for some turbulence in the market ahead:
“With a strong portfolio performance, which has been the benchmark index return YTD, Finom Group prepares for the potential of a near-term market pullback and potential increase in volatility. Should the degree of pullback offered not present itself in light of better than anticipated earnings and data improvements, our consideration would shift toward a more risky capital allocation profile.”
While various analyst have put forth reasoning for a market pullback, there is little concern surrounding the rationale thus far, as financial conditions remain easy according to the Chicago Fed National Financial Conditions Index.
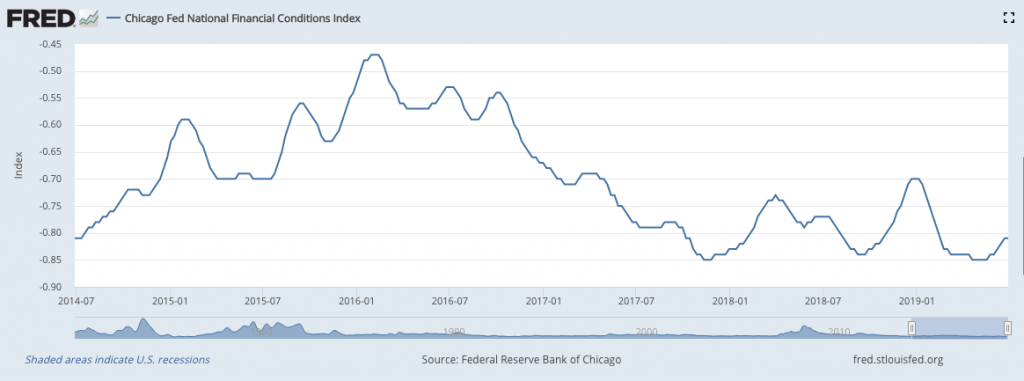
As one can see, financial conditions are much more relaxed/loose when compared to the Q4 2018 period and leading up to and through the Fed’s December rate hike. So what else is different this time? We’re glad you asked 😉 !
We have seen that equity investors have increased their market exposure more than any other time this year.
- J.P. Morgan PB data confirms this
- Goldman Sachs PB data confirms this (net leverage has increased +9pts. over six straight weeks (the largest increase over any six-week period in more than five years). This is in stark contrast to market exposures in April, where we were at highs, but when positioning was “light”.
- Goldman Sachs strategists estimate that the CTA/trend-following community is long ~$40bn worth of S&P (the 88th percentile over the last year)
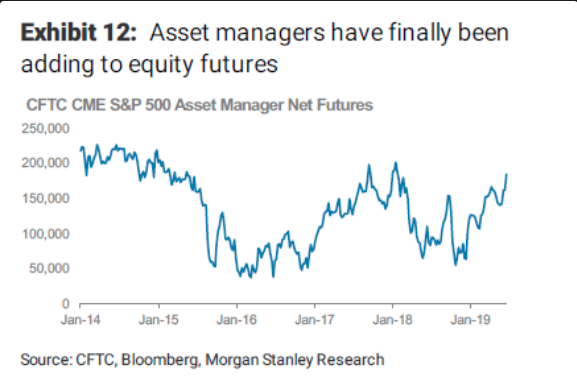
- CFTC data below shows added length. Far from euphoria of course, but at least a step in the direction needed to create a top.
- Morgan Stanley denotes that equity futures positioning has also increased over the last 30 days or so (See chart below)
With increased market exposure being realized and general financial conditions proving loose, which maintain a component of stock market prices, liquidity in the markets has improved. This is also in stark contrast to the Q4 2018 period that found the S&P 500 dropping some 20% from peak to trough.
Although PepsiCo. (PEP) will report Q2 2019 results ahead of the opening bell Tuesday, the main earnings season kick-off will come next week, as the major banks and more than 50 other S&P 500 companies will report results. The busiest day of this earnings season will be on 7/25 when 61 S&P 500 companies are scheduled to report, while the busiest week for earnings will be the following week when a total of 160 companies will be reporting. After that things will begin to die down in August.
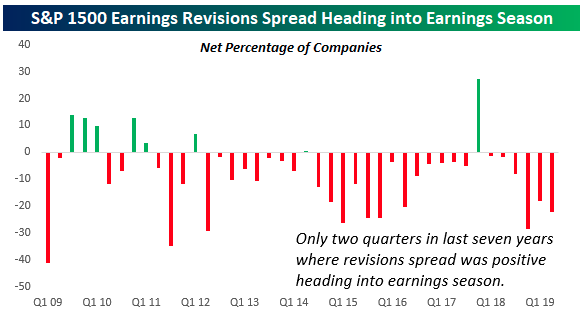
Over the last 4 weeks, analysts have raised EPS forecasts for just 278 companies in the S&P 1500 and lowered EPS forecasts for 611. This works out to a net of negative 333 or more than 22% of the stocks in the index. To put this in perspective, there has only been one other quarter in the last three years where the net EPS revisions spread heading into earnings season was more negative than it is now. This doesn’t mean that analysts are normally positive, though. As shown in the chart below, there have only been two quarters in the last seven years where the revisions spread was positive heading into earnings season.
Going into earnings season, 77% of the 113 companies that have issued earnings per share have warned that their numbers will be worse than what Wall Street analysts are estimating, according to FactSet. That total of 87 companies is well above the typical level of 70% negative pre-announcements and the second-worst level since FactSet started keeping track in 2006. The worst was in the first quarter of 2016, which saw 92 negative such warnings.
In terms of sectors, the two with the biggest negative pre-announcements — information technology and health care — are at the center of the tariff battle between the U.S. and its global trading partners, particularly China.
Technology has been at the core of President Donald Trump’s tariffs against $250 billion worth of Chinese goods. At the same time, his steel and aluminum duties are making a direct hit on the health-care industry, impacting about $1.8 billion worth of medical imports, according to Tara O’Neill Hayes, the deputy director of health-care policy for the American Action Forum. The total tariff impact will cost the industry about $400 million, Hayes wrote in a recent report.
As it pertains to the technology sector and the early signs of a market pullback heading into earnings season, this sector is already seeing a more profound market pullback. The tech sector is now trading at 21.4 times forward earnings, the highest level in 15 years, according to Toni Sacconaghi, AB Bernstein’s senior technology research analyst.
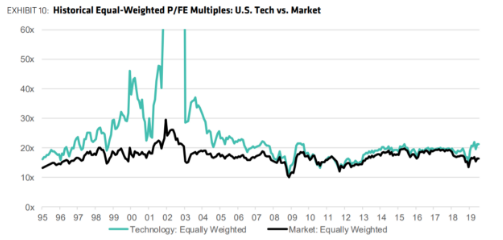
The rapid multiple expansion, which is the most pronounced this year, has reached a worrisome degree given earnings are expected to have a “startling” decline over the next 12 months, the analyst said.
“The largest stocks are emblematic of current year tech struggles: among the 17 largest cap tech companies, seven have flat to negative forward earnings growth. In particular, overall earnings growth is expected to be double digit negative for Semiconductors and Tech Services.”
While there remain concerns over the Q2 and Q3 reporting seasons, J.P. Morgan Chase has a more optimistic outlook fro the back half of 2019.
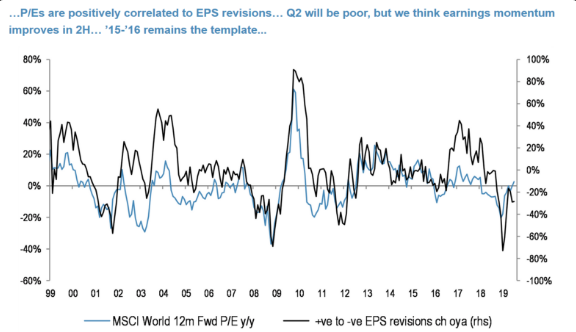
While the firm does indicate a more upbeat outlook for earnings in the H2 2019 period and using the ’15-’16 analogue as a backdrop for the current earnings trend, J.P. Morgan doesn’t discount the probability of a market pullback over the next 30 days.
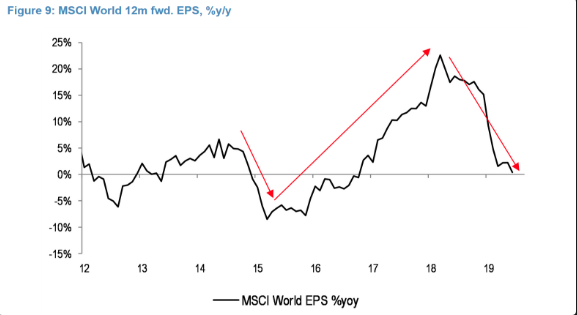
“Earnings are still likely to grow, beyond the current soft patch… we see similarities to the ’15 – ’16 mid cycle episode.”
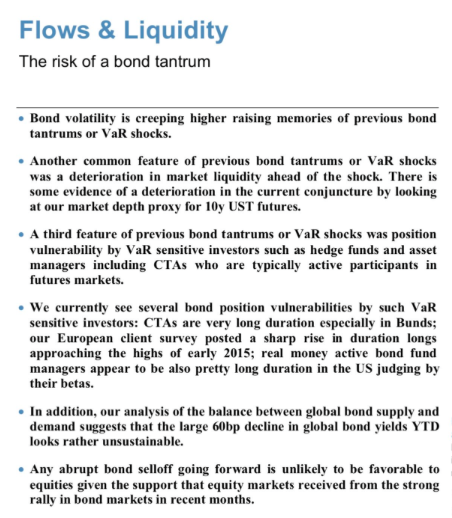
Additionally, the firm warns equity investors that current conditions in the bond market, with an overcrowding in duration products, has the potential to bleed into the equity market. (See screenshot below)
With the market rallying through much of 2019 and having exacted a moderate 7% pullback through the month of May, equity investors have remained rather sanguine on the market. Although bullish sentiment has improved when compared to bearish sentiment, it still remains at low levels, according to the latest AAII survey. Moreover, it remains below the historical average.

In referring to J.P. Morgan Chase’s ’15-’16 analogue noted previously, we had seen bearish sentiment greater than bullish sentiment for 7 consecutive weeks, the longest streak since Feb ’16. Also, this was the 1st time in 7 weeks that the AAII bulls exceeded 30 percent. Go figure! Historically when this happened, S&P 500 was higher 91% of the time 3 months later.
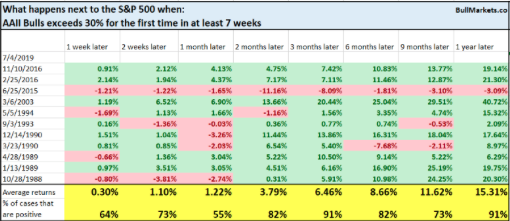
And as noted in the table from Bullmarkets.co, such criterion were notable during 2015 and 2016. Need more convincing that the ’15-’16 analogue may be in play for 2019? Another market sentiment survey from Goldman Sachs provides just such data.
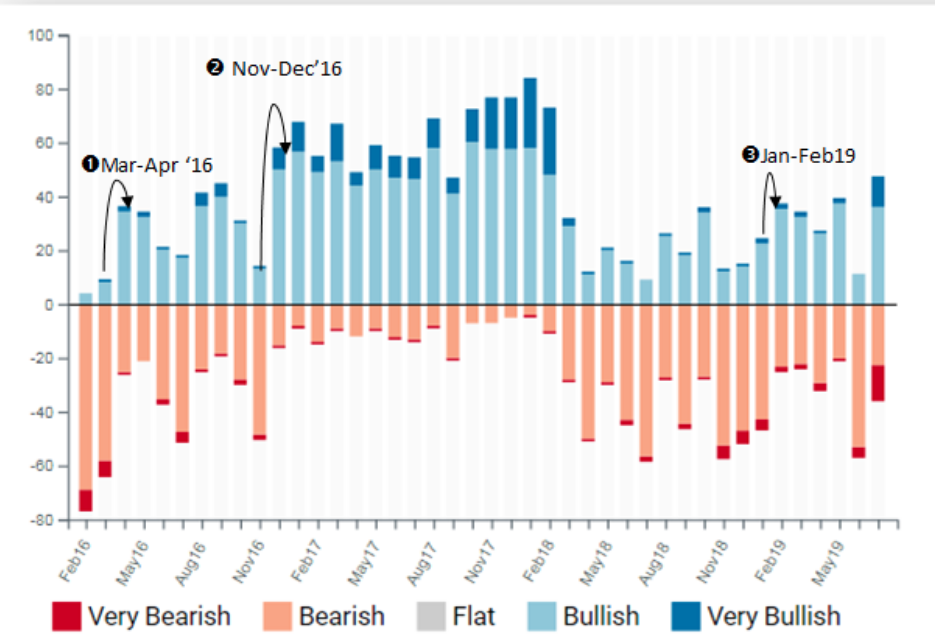
Following June’s impressive rally, what stands out in the latest Goldman Sachs QuickPoll for July is the lack of enthusiasm for equities. Only 46% of participants are bullish risk assets despite the S&P 500 making new highs, a similar setup to the second half of 2016. Looking at past shifts in sentiment, there have been 3 similar occurrences in the survey’s history (Mar-Apr ’16, Nov-Dec’16, Jan-Feb ’19). Each time, sentiment was a lagging indicator as bearishness peaked when equities trough and then quickly turned as they recovered. But more importantly is what happened afterwards: all 3 times, equities continued to grind higher in the following month (resp. 0.3%, +1.8%, +3%).
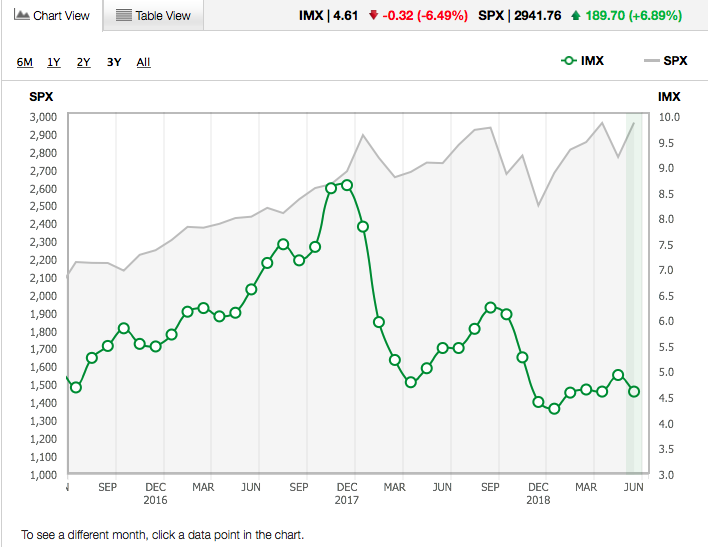
One more ’15-’16 analogue, shall we? Sure why not, right? Even the latest results from the TD-Ameritrade Investor Movement Index (IMX) showed similarities to 2016.
Exposure to equity markets decreased in TD Ameritrade client accounts during the June IMX period. The IMX score decreased by 6.49%, moving to 4.61, down 0.32 from the previous period.
TD Ameritrade clients were net sellers for the first time in over two years during the June IMX period, reducing exposure to equities. This marks the first time since November 2016 that clients were net sellers overall. Volatility was generally light during the period. Volatility of the S&P 500, as measured by the Cboe Volatility Index, or VIX, began the period near 20, but trended lower and ended near 15.
TD-Ameritrade clients were net sellers of equities during the period, but found some names to buy. Tesla Inc. (TSLA) traded higher during the period on hopes of a good second quarter and reports the company is developing their own battery cells, and was net bought. Plant-based meat maker Beyond Meat Inc. (BYND) was net bought as it announced its launching a new, plant-based ground beef product designed to look and taste like traditional ground beef, which will be available at stores including Whole Foods (AMZN), Albertsons, and Kroger (KR). Alibaba Group Holding (BABA) launched an English language portal on its Tmall retail site for the first time in a bid to double the number of global brands for sale to Chinese consumers, and was net bought. Marijuana stock Canopy Growth Corp. (CGC) was volatile after reporting decelerating revenue during the previous period, while the CEO projected higher margins going forward, and was a net buy. Walt Disney Co. (DIS) hit an all-time high during the period as Toy Story 4 was released during the period, and was net bought.
TD Ameritrade clients were net sellers of Apple Inc. (AAPL) during the period. The company announced the design chief Jony Ive was leaving the company, but traded higher by over 12% during the period on hopes of a U.S.-China trade deal. General Electric Inc. (GE) was up over 11% during the period after its aviation unit announced record orders, and was net sold. Netflix Inc. (NFLX) was net sold during a volatile period in which the company announced it lost a top executive to Walt Disney, and its most-watched show in 2018, “The Office”, will be pulled from its platform in 2021. Snapchat Inc. (SNAP) reached a 52-week high following an analyst upgrade, and was net sold. Target Corp. (TGT), which announced a dividend increase and same-day delivery on over 65,000 products, was net sold. Square Inc. (SQ) introduced a reward program for Square Cash debit card users and was up over 17% during the period, and was net sold.
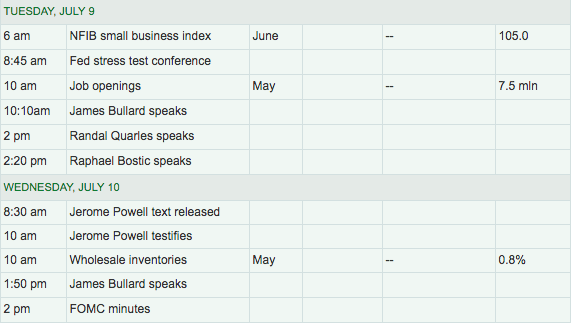
Ahead of the market open on Wall Street Tuesday, equity futures are picking up where they left off on Monday in negative territory. While earnings and lofty valuations are reasons enough for market pressure, investors are also concerned about upcoming Fed speeches with rate cut expectations soaring. The market expects and has priced in at least 25 bps rate cut for July.
Many Fed speeches are set to take place on Tuesday that will also include Fed Chairman Jerome Powell, who will be discussing the latest Fed stress tests. The more pressing concern for investors comes in the way of Jerome Powell’s testimony before Congress on Wednesday and the Senate on Thursday.
In referencing rate cuts projected by the market for 2019, some market watchers are of the opinion that the market is overshooting in its desire for cuts. The market is expecting too many cuts from the Federal Reserve this year, widely followed economist Mohamed El-Erian said Friday.
“We as the market base have gotten carried away — carried away thinking it will be 50 basis points in July, thinking we’re going to get three cuts by the end of the year. We’re going to get one in July and maybe, maybe two, and that’s about it.
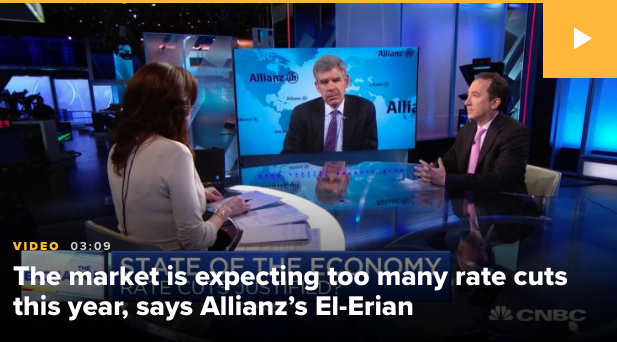
“I think you’re going to get a 25-basis-point cut this month,” El-Erian said on Friday. “I think putting it as an ‘insurance rate cut’ is the right way. The economy is not in trouble. Today’s employment report is actually very good news for the economy, and it’s good news long term for the markets.”
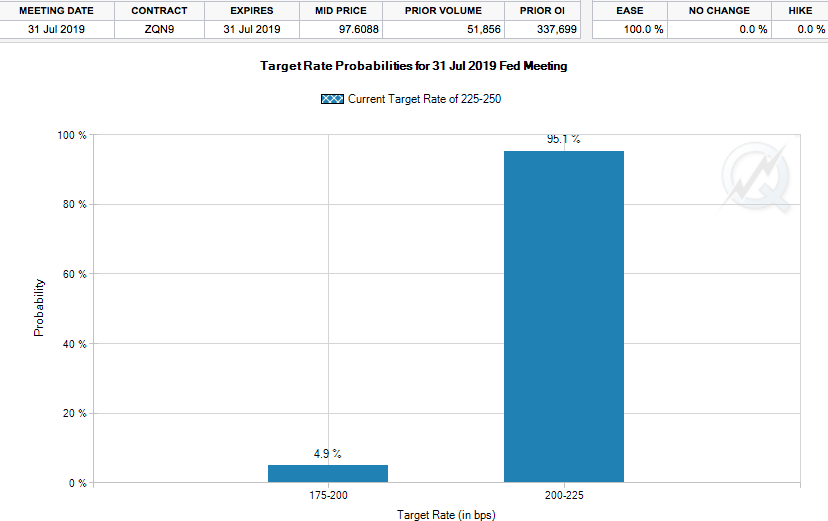
The Federal Reserve was divided on projections for a rate cut this year at its last meeting, but the market is still expecting a cut in July even after the strong jobs report, according to the CME Fed Watch tool. El-Erian said the previous signals the Fed has sent about a cut are a reason why one may be coming.
“They cannot afford another miscommunication,” El-Erian said.
Piggybacking on what has been offered by El-Erian is famed Fed Watcher Tim Duy. In his latest blog post he discussed why the conversation of rate cuts has come to the forefront and why he believes the Fed will indeed cut rates at the upcoming July 31st FOMC meeting.
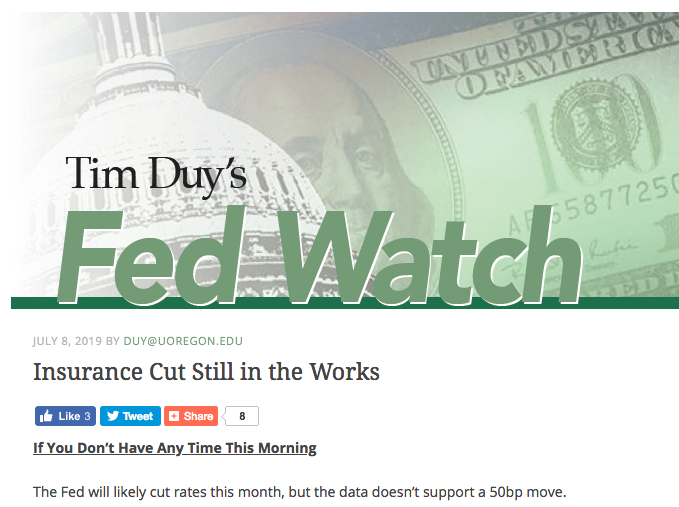
“Why are rate cuts even part of the discussion? I think that we have to look back to the final months of 2018 to answer that question. From the Fed’s perspective, the economy was quite strong and showed few signs of slowing. Notably, the pace of job growth was still on an upward trend, fueling concerns that the economy would soon overheat. Had the Fed anticipated the overall softening of activity and in particular the decline in job growth since then, I suspect they would not have followed through with the December rate hike.
In this light, a rate cut this month is simply a correction of the fairly small error made in December.The need to correct that error became important given growing downside risks from trade tensions and slower global growth. There is no need to risk a sharp slowing in the economy given that inflation remains low. Moreover, if the Fed wants to sustain the expansion, they cannot delay a rate hike until the data reveals that a recession is underway.That just guarantees they would soon again find themselves at zero interest rates. All of this argues for an insurance cut rather than a panic cut. That means 25bp, not 50bp.“
And so at present, market participants, economists and strategists alike are making it that much easier for the Fed to do what it feels most appropriate and cut rates. With each daily decline in the market, it adds a sentimental negative layer to the Fed’s narrative, which aims to support the economic expansion. Knowingly, the market finds itself under pressure, or limping into the latest round of Fed speeches as if it were a wounded puppy in an attempt to ease the Fed’s path toward a rate cut. It seems so very choreographed, does it not?
While the global and domestic economies have weakened through 2019, investors are seemingly fearful of a recession looming underneath the economic surface. Excesses, leverage and asset inflation of unreasonable proportions usually underline recessions and aid in causing them, but none of these seem to be present in the current economic expansion cycle. We can argue all day about what the appropriate PE is for the S&P 500 with respect to forward looking earnings and yield, but you’d be hard-pressed to suggest extreme asset valuations are in place. Nonetheless, the New York Fed’s Recession Probability Model is now at 32%, the highest in more than 10 years. With that in mind, what does that suggest for investors and the S&P 500 looking out some 12 months?
Here’s what the S&P 500 did next after similar Recession Probability readings (Table from Troy Bombardia)
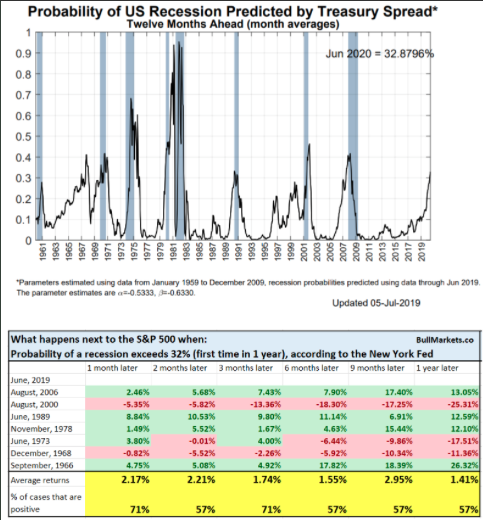
It’s important to reflect on the historical data and understand that such recession readings have only occurred 3 times in the last 30 years, or modern economic/financial market era. On 2 of these occasions, the market was higher across all time frames and out 12 months later. It was only in 2000 that every time frame measured forward 12 months that the S&P 500 declined. With that being said, let’s see what the economy and market has in store over the next 12 months. History doesn’t always repeat and circumstances are ever changing.


