
On Tuesday, the major averages started the day in the red and rallied higher throughout the trading session. The uncertainty that resounded ahead of Jerome Powell’s testimony before congress seemed to fade as yields and crude oil both rose on the day.
The Dow Jones Industrial Average (DJIA) fell 22.65 points, or 0.1%, to end at 26,783.49, while the S&P 500 index (SPX) gained 3.68 points, or 0.1%, to close at 2,979.63. The Nasdaq Composite Index (NDX) added 43.35 points, or 0.5%, to settle at 8,141.73.
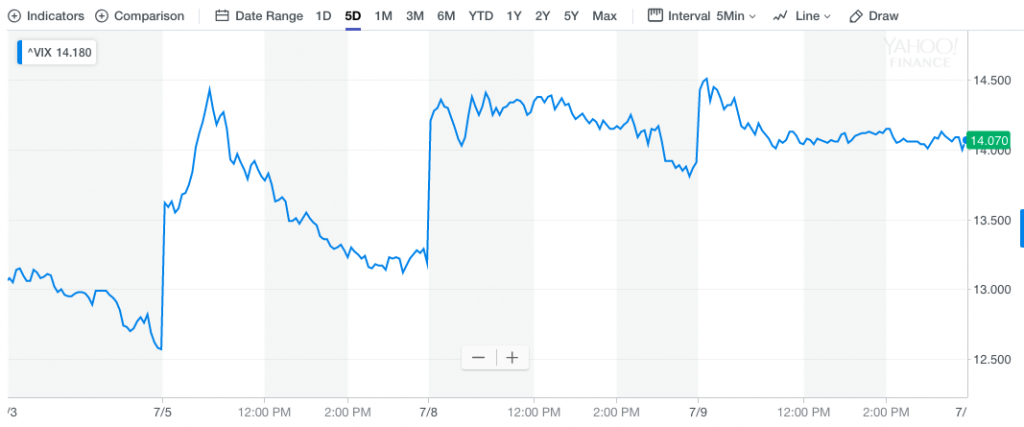
The VIX or fear gauge had a strong start to the day as equities appeared to continue their declines on Tuesday. After hitting an intraday high right after the opening bell, the index, which reads the amount of implied 30-day volatility in the market began its decent while equities rallied. In fact and as depicted in the chart below, the pattern of higher opens for the VIX followed by lower closes has been a consistent trend over the last several trading days.
As investors look forward to another trading day, they will be forced to contend with the media’s determined coverage of the Fed chairman’s testimony before Congress Wednesday. Undoubtedly, media networks will be airing the testimony live and investors will tune in. While a prepared
Ahead of Powell’s semi-annual Humphrey Hawkins testimony before Congress the Fed has published its Monetary Policy Report.
“Consumer price inflation, as measured by the 12-month change in the price index for personal consumption expenditures, moved down from a little above the FOMC’s objective of 2 percent in the middle of last year to a rate of 1.5 percent in May. The 12-month measure of inflation that excludes food and energy items (so-called core inflation), which historically has been a better indicator than the overall figure of where inflation will be in the future, was 1.6 percent in May—down from a rate of 2 percent from a year ago. However these year-over-year declines mainly reflect soft readings in the monthly price data earlier this year, which appear to reflect transitory influences. Survey-based measures of longer run inflation expectations are little changed, while market-based measures of inflation compensation have declined recently to levels close to or below the low levels seen late last year.”
Despite again noting that lack of inflation may be “transitory”, the Fed reiterated its openness to cutting interest rates to extend the longest U.S. economic expansion on record while noting that the pace of growth had slowed in the second quarter of 2019.
“Data for the second quarter suggest a moderation in GDP growth — despite a pickup in consumption — as the contributions from net exports and inventories reverse and the impetus from business investment wanes further.”
The report reiterated wording from the June FOMC statement saying officials would closely monitor incoming data and “act as appropriate to sustain the expansion.”
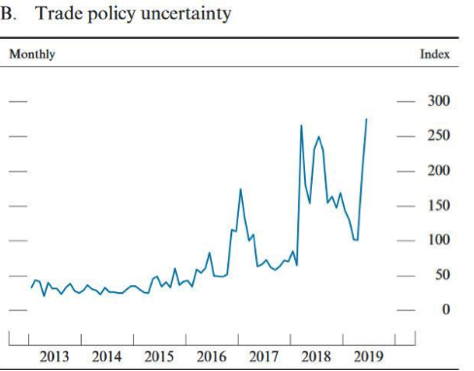
The report also highlighted a significant weakening in global trade growth and manufacturing since 2017 “even as growth in services has held up.
“Trade policy developments appear to have lowered trade flows to some extent, while uncertainty surrounding trade policy may be weighing on investment.”
“After slowing in 2018, foreign economic growth appears to have stabilized in the first half of the year, but at a restrained pace. While aggregate activity in the advanced foreign economies (AFEs) increased slowly from the soft patch of late last year, activity in emerging Asia generally struggled to gain a solid footing, and several Latin American economies continued to underperform. Growth abroad has been held down in part by a slowdown in the manufacturing sector against the backdrop of softening global trade flows. “
The Fed remains front and center as a driving force belying the markets and investors have somewhat pinned their sentiment for risky assets on the notion the Fed will cut rates by 25 bps in July. Between this week’s testimony and then, however, the economic data may serve to solidify rate cut probabilities or upend them altogether. The June Nonfarm Payroll data went a long way toward reducing the amount of rate cut the market was anticipating, from 50 bps to 25 bps already. Nonetheless, Morgan Stanley sees the Federal Reserve cutting its key interest rate by 50bps this month, even after Friday’s strong U.S. jobs report. “A strong policy response is necessary to guard against risks of a further, sharper loss of economic momentum.”
Inflation data will be delivered this week in the form of the Consumer Price Index and Producer Price Index. The data could prove more market moving than usual given the rate cut concerns.
Tuesday’s economic data carried a mixed bag of results with the NFIB small business index falling in the month of June. The index of small-business optimism declined 1.7 points to 103.3 in June. That’s a gloomier reading than the consensus forecast of 104.0. While optimism remains at historically high levels, the June figure reverses the gain posted in May, with six components falling, three improving, and one unchanged. The Uncertainty Index rose substantially, increasing seven points to the highest level since March 2017.
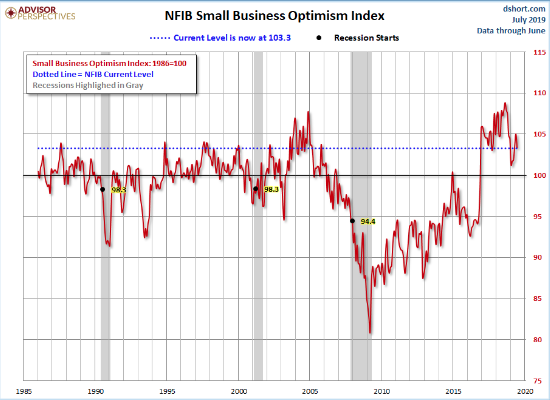
“Last month, small business owners curbed spending, sales expectations and profits both fell, and the outlook for expansion dampened. When you add difficulty finding qualified workers and harmful state level laws and regulations, you’re left with a volatile mix where uncertainty has increased to levels not seen in more than two years,” said NFIB President and CEO Juanita D. Duggan.
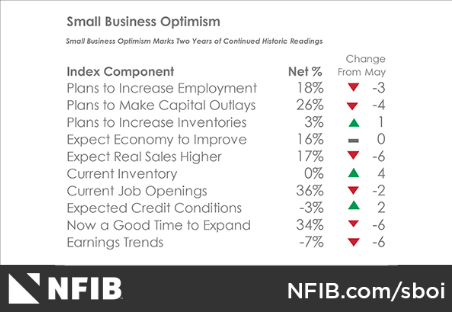
“As expectations for sales gains and the general business environment faded, uncertainty levels increased,” said NFIB Chief Economist William Dunkelberg. “Still, job openings and plans to create jobs remain historically very strong, and while it’s not as ‘hot’ as May, Main Street is still running strong.”
In addition to the NFIB data disappointment, the Job Openings and Labor Turnover survey (JOLTS) for May 2019 also showed a decline. The number of job openings was little changed at 7.3 million on the last business day of May, the U.S. Bureau of Labor Statistics reported. Over the month, hires fell to 5.7 million and separations edged down to 5.5 million. Within separations, the quits and the layoffs and discharges rates were unchanged at 2.3 percent and 1.2 percent, respectively.
The following graph shows job openings (yellow line), hires (dark blue), Layoff, Discharges and other (red column), and Quits (light blue column) from the JOLTS. Note that hires (dark blue) and total separations (red and light blue columns stacked) are pretty close each month. This is a measure of labor market turnover. When the blue line is above the two stacked columns, the economy is adding net jobs – when it is below the columns, the economy is losing jobs.
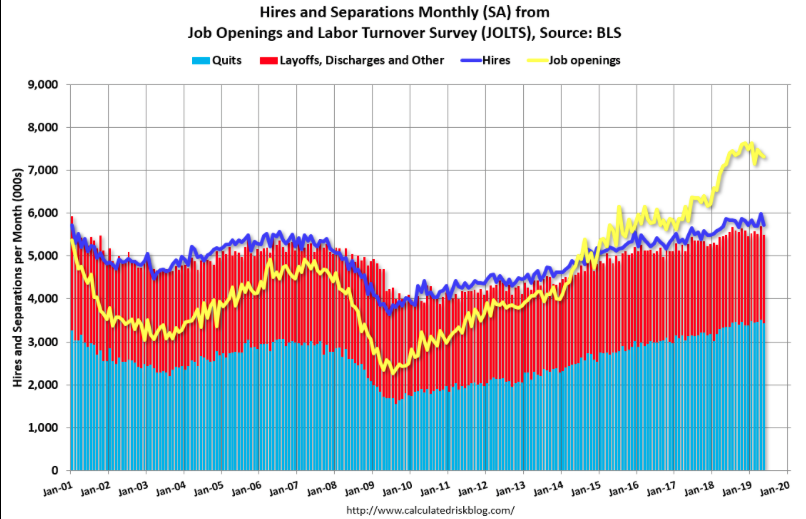
The number of job openings (yellow) are up 3% year-over-year. Quits are up 2% year-over-year. These are voluntary separations. (see light blue columns at bottom of graph for trend for “quits”). Job openings remain at a high level, and quits are still increasing year-over-year. The JOLTS data shows further that the labor and employment market continues to grow at a robust rate and remains with job openings above 7 million since mid-2018.
Heading into what may prove to be an intense trading session Wednesday, equity futures are pointing to another lower open on Wall Street with the major European indices in the red. The downtrodden tone heading into the U.S. trading session comes on the heels of another downshift in the Eurozone economic outlook from the European Union.
The European Union said additional tariff hikes by the U.S. and China could weaken investor confidence and global financial markets as it once again lowered its forecast for economic growth in 2020.
In its quarterly report on the outlook released Wednesday, the European Commission said it now expects economic output in the currency area to increase by 1.4% next year, having previously forecast growth of 1.5%. It left its forecast for this year unchanged at 1.2%, which would mark a sharp slowdown from the 1.9% rate of expansion recorded in 2018.
However, the Commission warned that growth could be even slower in both years if the U.S. and China were to impose higher duties on goods moving between the two countries.
“Any further escalation of trade tensions and an increase in policy uncertainty could prolong the current downturn in global trade and manufacturing and trigger a sharp shift in global risk sentiment and rapid tightening of global financial conditions.”
The Commission lowered its 2020 growth forecasts for both Germany and France, while raising its 2019 growth forecast for Spain and leaving its Italian projections unchanged.
In other European headlines, the U.K. found economic growth once again. The Office for National Statistics said Wednesday that the economy grew 0.3% on the month in May after shrinking in April, the month immediately after the U.K. was due to leave the European Union before political spats over the terms of the country’s departure twice caused Brexit to be delayed.
The pickup was driven by British factories, where output has fluctuated as manufacturers prepared for any potential disruption around the U.K.’s original planned March 29 departure date.
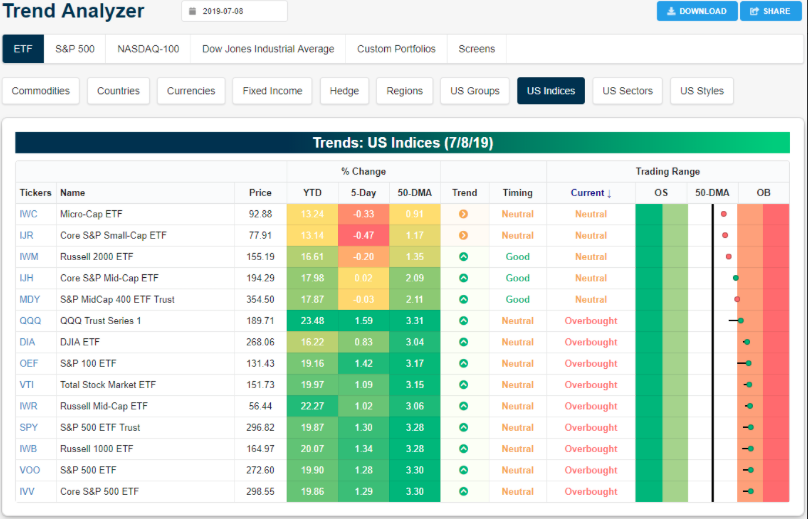
Refocusing our attention on U.S. indices, we come to understand that while we’ve recognized some recent selling pressure, most index ETFs remain in Overbought territory. (Table from Bespoke Investment Group)
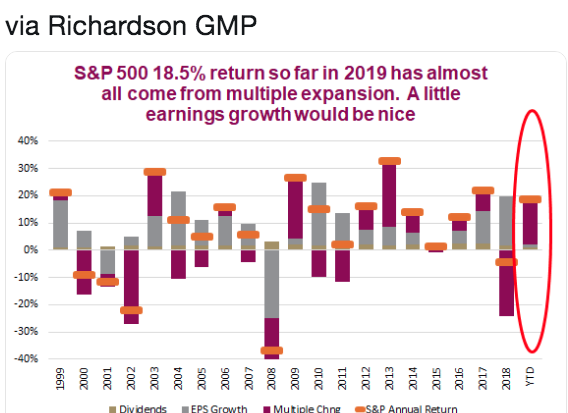
Moreover, recall that much of 2019 equity market gains have come almost entirely from multiple expansion and not earnings growth like we had seen since late 2016. The multiple expansion in 2019 is simply take back from multiple contraction in 2018. Recall that the S&P 500 fell more than 4% in 2018 as earnings grew double-digits. Many investors and analysts were underweight equities into and through the Q4 2018 period, as fears of an economic recession loomed large.
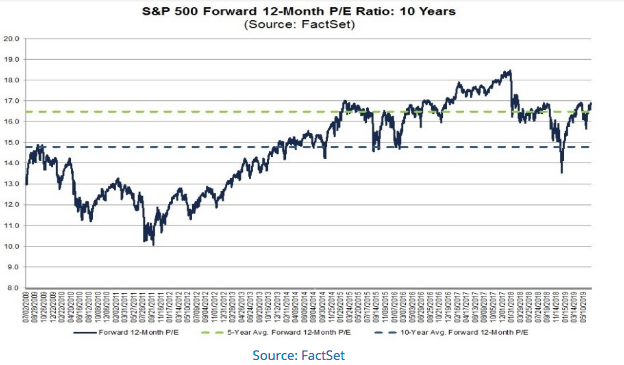
As the feared recession did/has not materialized, the equity market has expressed multiple expansion once again. A lot of the multiple expansion this year is make up for last year. Stocks simply became too cheap in late 2018 and the market has corrected with a V-shaped recovery in both equity prices and overall valuations. As you can see from the chart below, the 12 month forward PE ratio of the S&P 500 fell below the 5-year and 10-year average late last year.
The V-shaped recovery since the December 24, 2018 trough identifies the continuation of the bull market. Recent research from Ned Davis Research also suggests the bull market has more room to run based on individual sector performance. The sectors which typically perform best near the end of a bull market are showing weakness, while many of the sectors that usually perform the worst are doing very well. Ned Davis studied past sector performance with a ranking of sector performance over the last three months of past bull markets (back to 1970).
The best-performing S&P 500 sector over those months, on average, was Consumer Discretionary, according to that firm, followed by Health Care and Consumer Staples. The worst performers over those same months, on average, were Communication Services, Utilities and Energy.
Financials and Utilities, which typically lag prior to market tops, are the second- and fourth-best performers among the 10 S&P 500 sectors. In contrast, Health Care and Consumer Discretionary, which typically lead prior to tops, are below average for recent performance, in sixth- and eighth place, respectively.
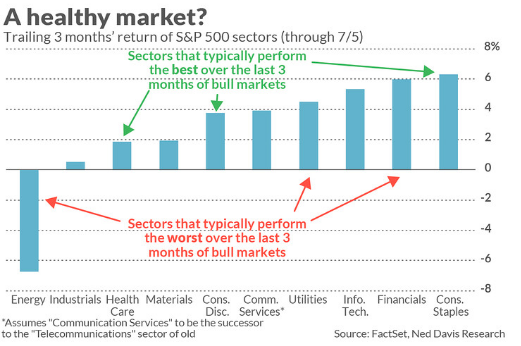
Of course, the concern you might have after analyzing the chart above is that that defined by the Energy sector and Consumer Staples. Not all of the sectors are telling the typical bullish story. The Energy sector usually lags the market prior to market tops, and indeed it is the worst performer of the past 3 months. Having said that, there are some unique circumstance that have affected the energy sector during this bull market cycle unlike that of others. Meanwhile, Consumer Staples, which typically leads prior to tops, is currently the best performing sector. But overall, a statistical comparison of a recent sector ranking with the Ned Davis history shows that things now are more different than similar.
Taken as a whole and assuming the future is like the past, a bull market top is at least three months away. Recognizing that this is the longest expansion cycle in history, the future is unlikely to mirror the past in our opinion.
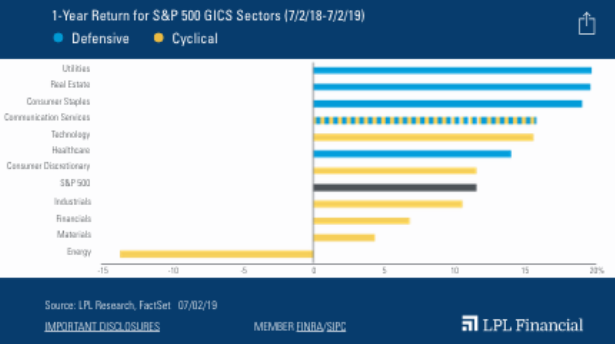
The S&P 500 YTD performance remains rather spectacular when juxtaposed with 2018’s performance, but a deeper dive finds some faults or concerns. In truth, much of the strength in the S&P 500 has been from defensive sectors and Finom Group would rather see greater strength from cyclicals.
Moreover, while cyclical sectors mostly outpaced defensives in the first half of 2019, it wasn’t terribly convincing. Over the past year, the defensive sectors (consumer staples, healthcare, real estate, and utilities) have each outperformed the S&P 500, based on the S&P 500 GICS, even though the broad stock market benchmark gained 9% during that time period. Defensive sectors tend to lag in rising markets—at least more often than not.
Additionally, the market has seemed rather reliant upon the Fed’s supportive/accommodative stance toward risk assets. In a period whereby geopolitical skirmishes that have levied tariffs and damaged capital spending, this has proven necessary to support equity markets. Here’s how LPL Chief Investment Strategist John Lynch characterized the 2018 rally in equities:
“It’s tough to be critical of this market after such a strong start to 2019, but we would prefer that stocks were less reliant on monetary policy support from the Fed. At some point that support won’t be there, and traditional economic and market fundamentals will matter much more, although maybe not quite yet.”
While equity futures remain under pressure Wednesday morning, both bond yields and crude oil are on the rise. Crude is up nearly 2.5% in early trade, above $59 a barrel while the 10-year Treasury yield hit an early morning high yield of just over 2.10 percent. Wednesday should prove another interesting day for the markets.


