
Welcome to another trading week!! In appreciation of all of our Basic Membership level participants and daily readers of finomgroup.com content, we offer the following excerpts from our Weekly Research Report. Our weekly Report is extremely detailed and has proven to help guide investors and traders during all types of market conditions with thoughtful insights and analysis, graphs, studies, and historical data/analogues. We encourage our readers to upgrade to our Contributor Membership level to receive our Weekly Research Report and State of the Market Videos and take advantage of this ongoing promotional event today! Have a great trading week, be in touch, and take a look at some of the materials in this weekend’s published Research Report!
Research Report Excerpts #1
If you’re questioning why states are moving to mask mandates instead of revisiting lockdowns, it’s quite simple. The average age of those now testing positive is dropping dramatically. So much so that it is now down to the 35-37 range and by some accounts still dropping. That simply suggests more people well below that median age are being infected. The chart below suggests there is little risk of dying from COVID-19 if you are in that age bracket.
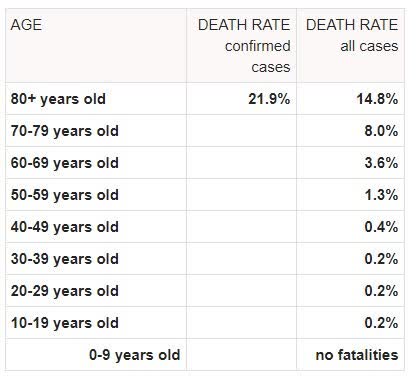
While these latest efforts by individual states may find other states jumping on board with mask mandates near-term and if the infection rate continues to rise, the market has likely made up it’s mind, which is a reflection on the low mortality rate from the new cases. Yes, the market has a memory. Well it has many memories to be quite frank and as such Mr. Market has already priced in the initial move that has taken the S&P 500 into a new bull market. The issue will be whether we see continued improvement in the global economic situation to keep the rally going OR is there a pause in the recovery that will translate into weakness in the equity market.
Research Report Excerpts #2
The good news is that the percent of stocks above their 50-DMA remains above 50%, but moving in the wrong direction. Another breadth metric we aim to identify weakness or strength in the overall market is the percent of stocks trading above their 200-DMA. This has been relatively weak since June 8th, the new bull market high.
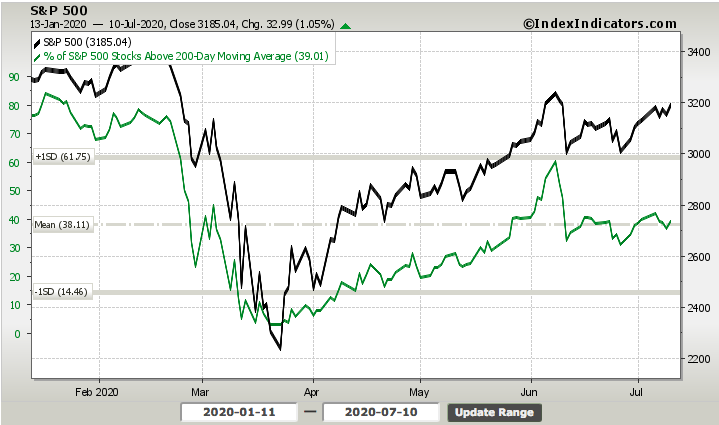
The percent of stocks trading above their 200-DMA remains below 50%, at 39%, but this has remained constant over the last 2 weeks and thus hasn’t lent itself to suggest anything more than neutral sentiment. If the market indeed has a mandate to trend higher in the coming week and with the onset of earnings season, we think this breadth indicator could get back to the 50% or better level.
Research Report Excerpts #3
With all the breadth, relative strength ratios, analogue and momentum discussed within, if we were to list some concerns for the S&P 500 going forward it would be as follows:
- Low Equity Put/call ratio- This has fallen to near .40, but up to .46 to end the week.
- Percentage of stocks hitting new 20-day highs has fallen to single digits.
- Yields have broken support as of Thursday’s trading (Bearish for Financials).
- Leading sectors like Transports are well off early June peaks.
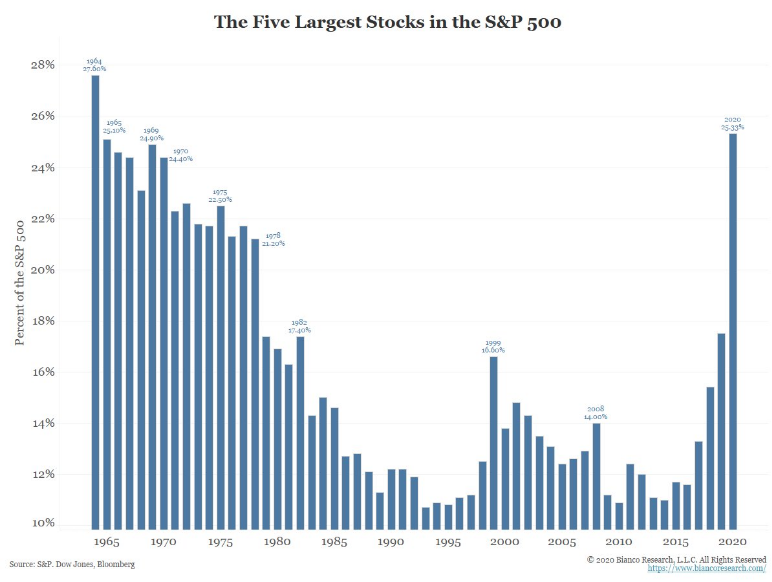
- Over concentration of “The Big Five” remains an issue to market health. (25%+ of S&P 500 weighting)
- Signs of Small-caps breaking ratios vs SPX are a concern.
Research Reports Excerpts #4
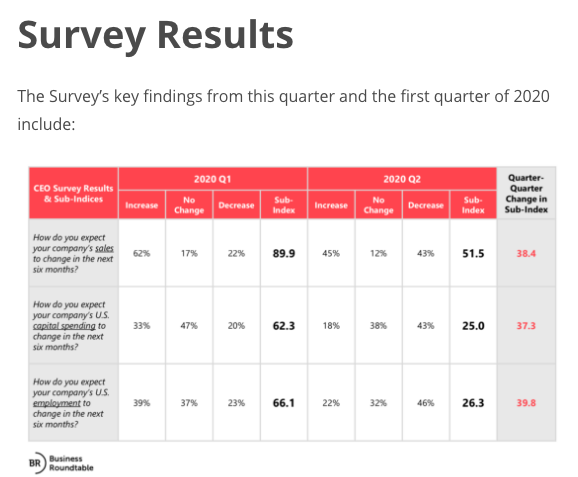
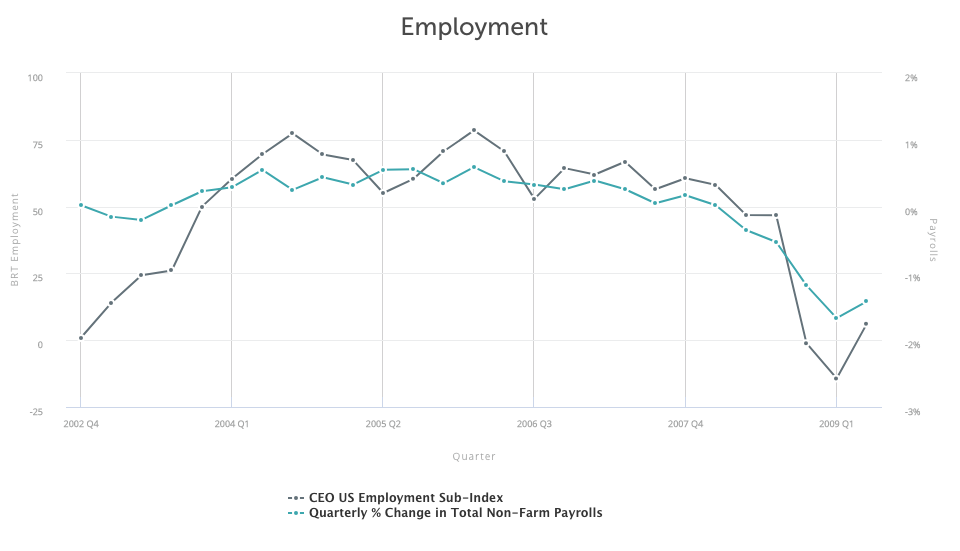
One way that we can review the sentiment of hiring is through the Business Roundtable’s CEO Economic Outlook Index. The CEO index sank 38.4 points to 34.3 in the second quarter, the lowest level in 11 years or since Q2 2009. Funny how the dates change, but like circumstances produce 2009 like readings again. Executives said they plan to reduce capital expenditures and hiring more recently. Most expect business to recover to pre-Covid levels by the end of 2021.
Other components of the Index were as follows:
- CEO plans for hiring decreased by 39.8 points to 26.3, 32.6 points below the sub-index’s historical average of 58.9.
- CEO plans for capital investment decreased by 37.3 points to 25.0, 51.3 points below the sub-index’s historical average of 76.3.
- CEO expectations for sales decreased by 38.4 points to 51.5, 60.6 points below the sub-index’s historical average of 112.1.
- In their second estimate of 2020 U.S. GDP growth, CEOs projected a 3.8 percent contraction for the year, which dropped 5.8 percentage points from last quarter’s estimate of 2.0 percent growth.
In looking at these results, it’s plain to see that CEO’s have concerns for the business and the recovery process. As such we’d like to look back at the CEO Business Roundtable Index from Q2 2009, to see if indeed we have been here before. Given that the tracking provider has changed formatting since 2009, the delivery of the data differs since. Nonetheless, here was the headline in Q2 of 2009 from the Index:
“The Business Roundtable CEO Economic Outlook Survey’s Index expanded to 18.5 in the second quarter of 2009, up from negative 5.0 in the first quarter.”
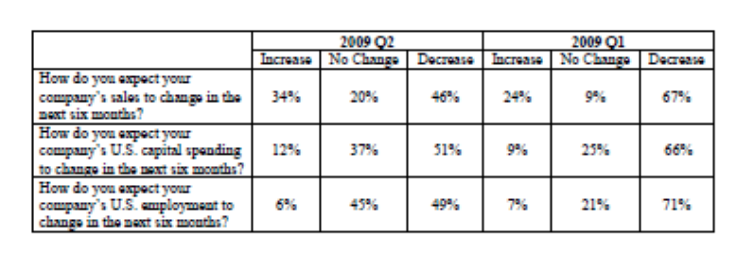
It’s clear from the Q2 2009 Index that CEOs’ outlook trough in Q1 of 2009 and improved in Q2 of 2009, as a new bull market came to life and an economic recovery slowly materialized. The situation “on the ground” was still poor, as recognized by the Index level, but it was improving nonetheless. Based on reviewing the CEOs’ Index back in 2009, we can certify that indeed, we have been here before, just with a different set of circumstances. And like the past, we can anticipate improvements for the future economy.
Research Report Excerpts #5
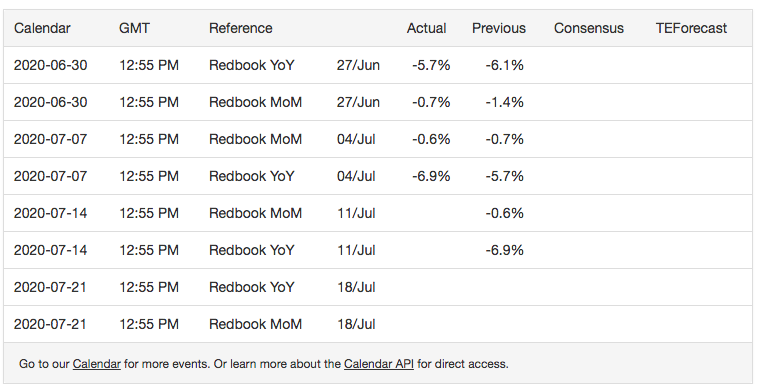
As it pertains to the soon to be released monthly retail sales report, we can get a hint as to what direction the report may trend through the weekly Redbook retail sales data. While the latest weekly data does align with the Chase card tracking data, prior to that the retail sales data from Redbook was improving into July.
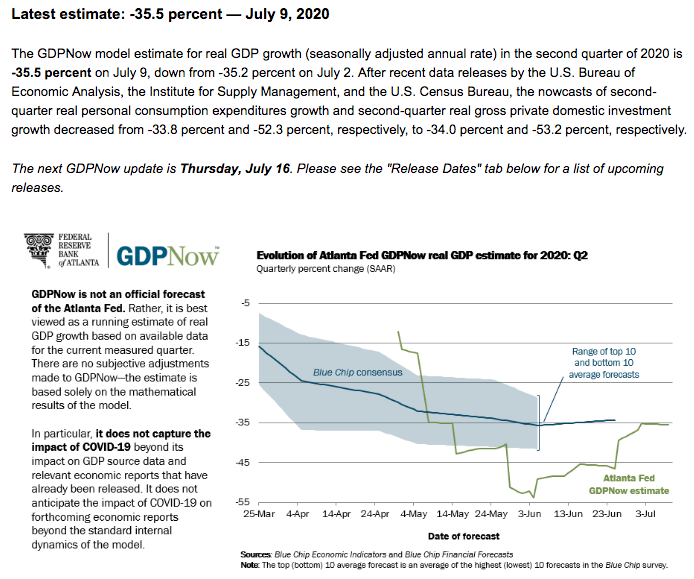
We’re still a couple of weeks out from receiving our first look at Q2 GDP, but most economists believe Q2 2020 will prove the trough in the recession. At present, Q2 GDPNow is tracking at roughly -35% as of the end of the week. (Atlanta Federal Reserve GDPNow). The next update will come on Thursday and post the major economic data deliveries.
Research Report Excerpts #6
Finom Group does not anticipate that earnings season will produce better guidance in terms of the number of corporations issuing guidance. While this may lend a degree of uncertainty to the EPS outlook, it is typical of post recession and recovery environments. Back in 2009, most corporations did not issue guidance in accordance with the lack of clarity surrounding the economic recovery cycle. The following EPS guidance statistics are disseminated from FactSet:
“As of today, more than one third of S&P 500 companies (183) have withdrawn EPS guidance for CY 2020. Most of these companies cited uncertainty around the impact of COVID-19 as the reason for not providing annual EPS guidance. Given the smaller number of companies issuing EPS guidance for the year, are fewer S&P 500 companies issuing EPS guidance for the second quarter as well?
The answer is yes. To date, 49 S&P 500 companies have issued EPS guidance for Q2 2020, which is 53.8% below the five-year average of 106. In fact, if 49 is the final number for the quarter, it will mark the lowest number of S&P 500 companies issuing EPS guidance for a quarter since FactSet began tracking this data in 2006. The current record is 63, which occurred in Q2 2009.
Insight/2020/06.2020/06.26.2020_EI/No%20of%20S&P%20500%20Companies%20Issuing%20Quarterly%20EPS%20Guidance%205-Year.png?width=912&name=No%20of%20S&P%20500%20Companies%20Issuing%20Quarterly%20EPS%20Guidance%205-Year.png)
We’ve seen similar murkiness around forward-looking earnings guidance in 2009, and yet the market trended higher in the face of that uncertainty.
Research Report Excerpts #7
Despite the references to the dotcom boom era noted above, the reality is that the price appreciation for the Nasdaq is nothing like that of the dotcom era. In terms of overall returns, the tech bubble makes this period look quaint by comparison.
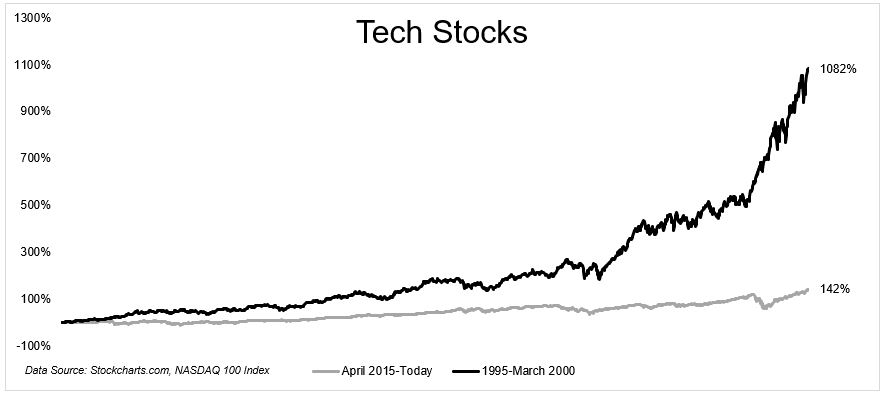
From April 2015 to today, $1 invested in the Nasdaq-100 grew to $2.42 (price only), compounding at 18.4% a year. In the dotcom bubble, $1 turned into $11.82 (at the peak), growing at 60% a year!

Research Report Excerpts #8
For the first time ever the S&P 500 was up 20% in a quarter, but still negative on a two-quarter basis (of the 17 previous times that the index had gained 15% or more in a single quarter, only two cases left it in negative territory on a two-quarter basis). Never before have we seen so much strength with so little to show for it. As strong as the 40- day rally off of the March lows was, it failed to overcome the weakness of the preceding 40 days. In this way, 2020 has more in common with the experience of 2001 than it does with 2009 (or many of the other top 40-day rallies in history). In 2009, strength overwhelmed weakness and following consolidation, additional strength was seen. In 2001, strength failed to overwhelm weakness and following consolidation, further weakness emerged. As can be seen in the chart below, we remain in a period of consolidation. But soon these paths diverge and which one the market takes will make all the
difference. (R.W. Baird)
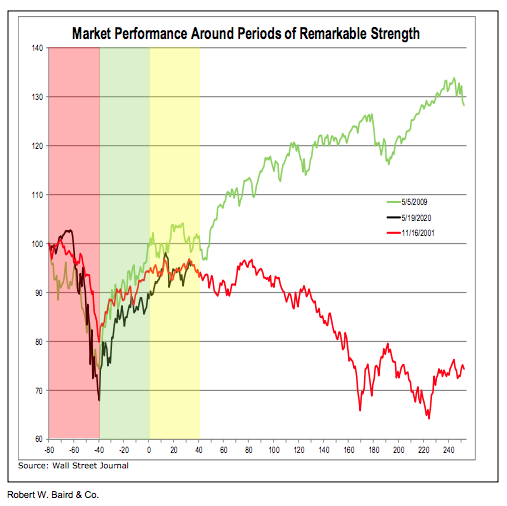
Time will tell which outcome is presented to investors. In the meantime, remember that making new highs is more bullish than not making new highs (stressing the importance of overcoming weakness) and rallies that fail to break above important thresholds can be vulnerable to reversal.
Thank you for joining us for another trading week and reviewing our weekly “Must Knows”! To receive and review our weekly, full-scale Research Report each Sunday and our State of the Markets weekly video analysis every Thursday, subscribe to our Contributor Membership level at just $7.99 monthly (Cancel any time)! With these two weekly deliveries, you’ll have all the unbiased and fact-driven market and economic data analysis at your fingertips. Don’t make capital allocation decisions based on headlines that brush the surface of what is and isn’t affecting markets. Let our deep-dive analytics supply you with bottom-up and top-down analytics. You won’t be disappointed. Upgrade today!!


