
Welcome to our Finom Group April Monthly Macro-Market Recap!
Suppose I told you that reading this report could be the key to unlocking disciplined, data-driven investing—would you read it with the focus it demands?
Would you take notes and reflect on the insights, or would you skim through and retain little? Would you ask Seth questions, or just nod along and hope for the best?
Let’s be candid: many members focus solely on the “Free Lunch” trade alerts via Telegram. While that’s a valid approach, it raises a critical question—are you truly optimizing your strategy? Remember, your outcomes reflect your effort, discipline, and willingness to engage with market realities.
Now, let’s address the elephant in the room:
This rally isn’t driven by institutional conviction or central bank liquidity—it’s fueled by short covering. Real buyers aren’t leading the charge, and liquidity remains constrained. If you’re chasing the market higher here, you’re likely late. The disciplined approach? Chase lower, not higher.
Why?
-
Tariffs are a rolling shock: Current trade policies will push PPI, CPI, and PCE higher through Q3, creating a step-function higher in the inflationary landscape. The Fed’s dual mandate (price stability + employment) is under tension, and rate cuts are off the table. Treasury yields reflect this reality.
-
VIX hedging is a trap: While volatility appears cheap, 85% of hedges fail to achieve their goals (CBOE data). Retail/Institutional investors chasing hedges now risk compounding losses.
-
Institutional vs. retail divergence: Wall Street is seeing record outflows, while retail traders pile into dips—a dynamic reminiscent of 2020. This isn’t wisdom; it’s recency bias masquerading as strategy.
The cold truth: Markets rise over time, but unpredictable chaos dominates the interim. Chasing rallies without understanding the mechanics (e.g., short squeezes, tariff impacts) is a recipe for underperformance.
Have I captured your attention?
If so, keep reading. This month’s macro-market recap cuts through the noise, arming you with the insights to navigate volatility, avoid herd-driven mistakes, and position for long-term success—no gimmicks, just data.
If not, you may as well keep taking food out of your kids’ mouths as Ray Dalio famously suggests, (kidding, kind of!) and go back to scrolling for breaking news on X.
This report (by Luis Solorzano) is intended to provide members with a clear and concise overview of the most important insights from our recent research and communications, offering a direct connection between our published analysis and the real-world market events of the past several months.
This recap draws directly from key excerpts of Finom Group’s major research reports and daily or weekly member communications, specifically covering the period from March to May 2025. Each section highlights a particular report or communication, beginning with a direct quote from the original material. Following each excerpt, you will find a summary of how those insights have been validated—or, in some cases, challenged—by actual market developments as of today, May 28, 2025. The intention is to bridge the gap between our research and the unfolding market environment, making it easier to see the relevance and application of our guidance.
By organizing our research alongside current market evidence, this recap helps members recognize the links between our forecasts and what has actually transpired in the markets. It also provides valuable context for our recommendations, allowing you to better understand the reasoning behind them. Whether you are a long-time member or new to Finom Group, this document offers a clear snapshot of our most relevant research and commentary, saving you the effort of sifting through every report to stay informed.
You can use this recap to review past research and see how it stands up in light of recent market action, to inform your current investment decisions with the rationale and evidence behind our guidance, or to introduce new members to the core ideas and track record of Finom Group’s research. Each section is clearly labeled with the source and date of the original material, followed by direct quotes and a summary of current market evidence. Additional commentary from Luis Solorzano is included to provide perspective and context.
With this introduction, you are now ready to explore the recap. The following sections will walk you through our most important research and commentary, and show you how they connect to the markets as they stand today.
Direct quote from Finom Group’s “Are We Nearing An Inflection Point In Markets?” Report (April 6, 2025):
Rather than outlining a whole diatribe concerning the reciprocal tariffs, it’s been made very clear by the markets that these are likely to produce recessionary-like economic conditions, which would also serve to produce another failed quant probability we’ve outlined since the publication of Finom Group’s 2025 Outlook report (table below).
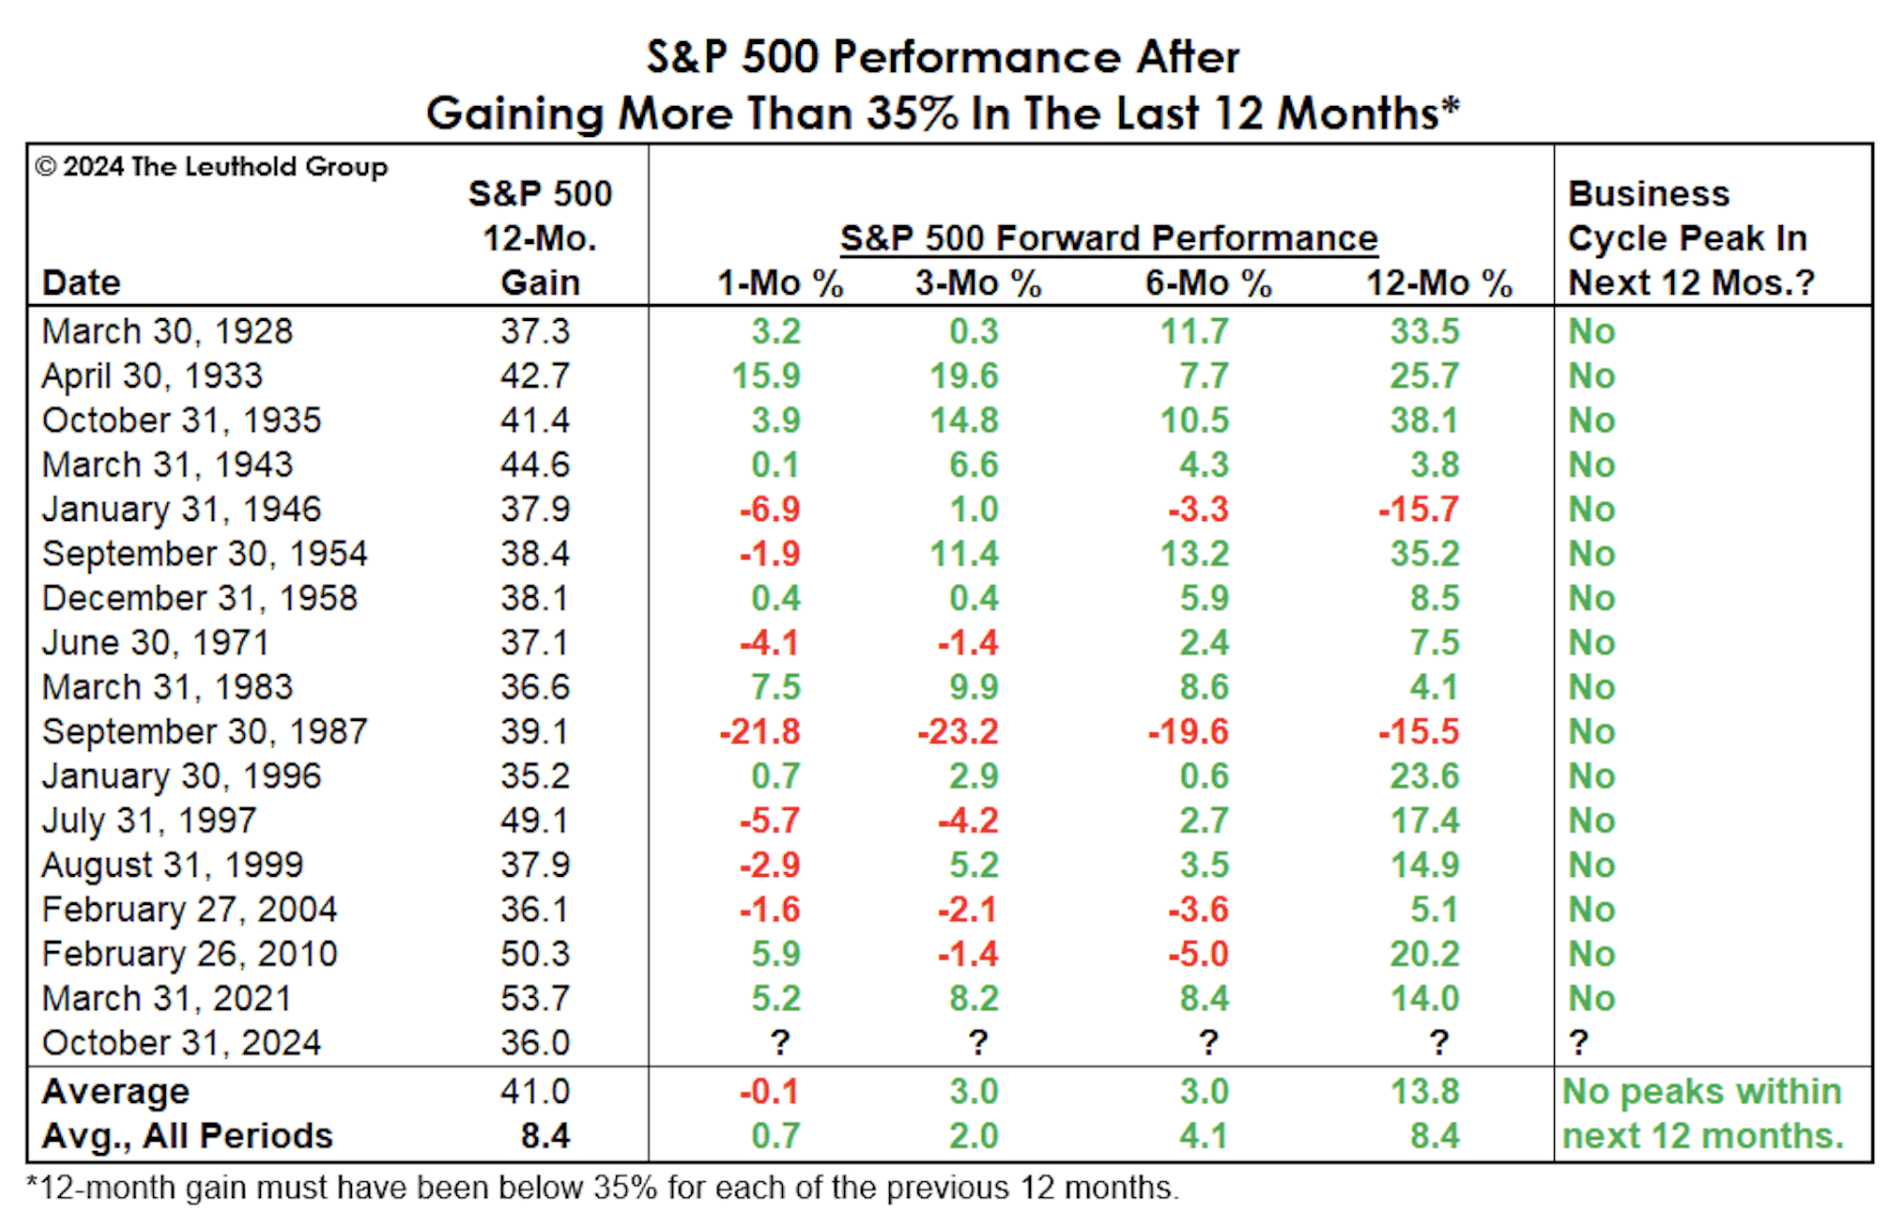
Since the publication of this report, the market’s response to reciprocal tariffs has been pronounced. The S&P 500 experienced a sharp correction in April, with the VIX volatility index spiking to levels not seen since the early stages of the COVID-19 pandemic, reflecting heightened uncertainty and fear. Leading Economic Indicators (LEI) have declined, signaling increased recession risk, while the Coincident Economic Index (CEI) has held up for now, indicating a mixed but elevated risk environment. The market’s swings—both downward and upward—have closely followed the pattern of rapid policy-driven shocks and recoveries described in the report. The current environment has indeed challenged some quant models, as the policy risk introduced by tariffs has disrupted historical patterns and increased the likelihood of failed quant probabilities. This unfolding scenario confirms the relevance of the Finom Group’s warning about the unique risks posed by aggressive tariff policies and the need for disciplined, flexible investment strategies in the face of such endogenous shocks.
Direct quote from Finom Group’s “Are We Nearing An Inflection Point In Markets?” Report (April 6, 2025):
Does this endogeny have the potential to deliver a recession. If we are being honest with ourselves, as investors/traders, the answer would have to be a resounding YES! Simply put, the level of the Reciprocal Tariffs is so high and so mis-calculated by the White House Administration that they can only result in 2 outcomes. If the tariffs are left in place and as outlined, a recession is likely within the coming 60 days at most. While the S&P 500 trend wouldn’t have pointed to a high probability of a recession in 2025, the post-election year would have, and in the context of the 4-year Presidential cycle indicated in the chart below:

The market has retraced much of its decline as tariff deadlines approach, but volatility persists, validating the report’s warning about policy-driven uncertainty and rapid market reactions. Worth noting, not all recessions are created equal.
It’s rare to see a policy-driven shock unfold so quickly and so dramatically. The market’s reaction to the tariffs has been a real-time test of our warnings, and the results speak for themselves. Members who heeded the call to maintain discipline and liquidity have been better positioned to weather the storm and take advantage of opportunities as they arise.
Direct quote from Finom Group’s “Are We Nearing An Inflection Point In Markets?” Report (April 6, 2025):
None of the endogenous impact should ever suggest investors throw out that which they understand to work a vast majority of the time; investing discipline/s. Cyclical, fundamental, technical, and quantitative understandings should not be dismissed simply because endogeny is overpowering them today and in a negative way. These disciplines carry the macro-market out of the trenches dug by endogeny or exogeny, eventually and inevitably. We know there to be hundreds of thousands of investors all around the world that have already given up, realizing all their gains over the prior year or two have been lost in such a short period of time, but failing to realize that in and of itself is/was a signal to ride through the storm and take advantage of what is historically a great buying opportunity, and one many were hoping for just a few short months ago.
This guidance, originally from the April 6, 2025 report, has proven especially pertinent as the market navigated a period of heightened volatility and uncertainty. The S&P 500’s sharp correction in April, followed by its rebound in May, tested the resolve of investors worldwide. Many sold at the lows, locking in losses, while those who adhered to disciplined investing principles—leveraging cyclical, fundamental, technical, and quantitative frameworks—were positioned to capture the recovery as markets stabilized. The recent market action underscores the value of maintaining a long-term perspective, even as short-term shocks and endogenous risks can temporarily disrupt performance. For members, this experience reinforces the importance of sticking with proven strategies, especially when market sentiment is at its most pessimistic. The rebound has not only validated the approach outlined in the report but also highlighted the risks of abandoning discipline during periods of high stress.
Direct quote from Finom Group’s “Are We Nearing An Inflection Point In Markets?” Report (April 6, 2025):
As mentioned above, investing disciplines will carry the market out of the trenches and the SentimenTrader quant table presented is one such quant with a perfect track record of outlining market returns. After 1-day 4%+ decline is followed with a 1-day 5%+ decline, the S&P 500 has been higher EVERY. SINGLE. TIME six months forward 💯 (above 5,074 by October 4, 2025). I get it! There are a great many investors/traders who do not desire to hear about perfect quants, especially given recent FIRST TIME EVER failed quants. Those investors/traders are more likely to fail themselves and their portfolio by failing investing/trading disciplines and by choosing to allow themselves to become “prisoner of the moment’s” price action. I’m encouraging investors to EMBRACE the opportunity from the price action and even the former failed quants, as is also being evidenced in this first quant of the week under consideration.
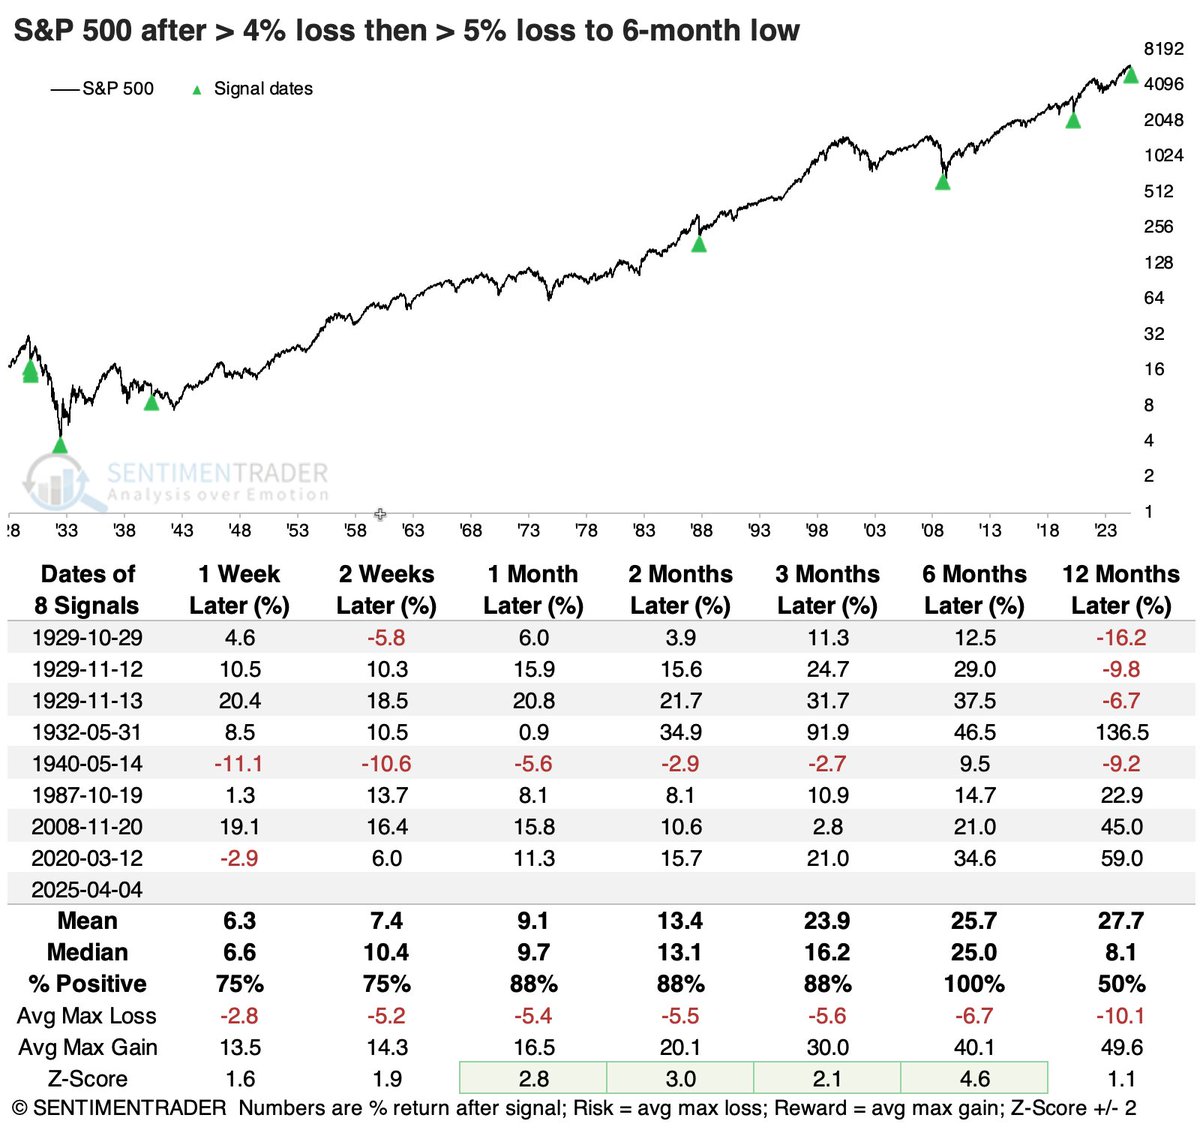
Since April, the S&P 500 has indeed experienced the kind of severe, back-to-back declines that trigger the SentimenTrader quant signal. In the weeks that followed, the market stabilized and began to recover, with the S&P 500 trading above the critical 5,074 level referenced in the report. This resilience aligns with the historical pattern highlighted by SentimenTrader, where such sharp selloffs have consistently been followed by positive returns over the ensuing six months. While the market environment remains volatile due to ongoing policy uncertainty and elevated VIX levels, the quant signal’s track record has so far held, providing a roadmap for disciplined investors.
Recent market action has also underscored the importance of not letting short-term price swings dictate investment decisions. Many investors who panicked during the correction found themselves on the sidelines as the market rebounded, missing out on the recovery. The rapid shifts in sentiment and price action have tested the resolve of even experienced traders, but those who maintained discipline and adhered to proven quantitative frameworks have been better positioned to navigate the turbulence. The current environment, marked by both sharp declines and swift recoveries, serves as a practical reminder of the value in embracing both the opportunities and the uncertainties that come with quant-driven investing.
As the S&P 500 continues to climb back above key technical levels—such as the 200-day moving average—market technicians note that similar historical patterns have often led to further gains in the months ahead. While nothing is guaranteed, the weight of evidence and the persistence of proven quant signals suggest that the market’s recent behavior continues to support the guidance provided in the report. The challenge for investors remains balancing the lessons of history with the unique risks of the current policy landscape, but the quant signal’s track record offers a compelling case for disciplined, long-term investing.
Direct quote from Finom Group’s “Are We Nearing An Inflection Point In Markets?” Report (April 6, 2025):
As it pertains to the SentimenTrader quant outlined, I’m a buyer of the correction in part due to this quant, but also because corrections and/or bear markets bring about cheaper prices and historically prove fleeting opportunities.
The Goldman Sachs chart referenced above visually supports this analysis, illustrating how corrections have historically been followed by recoveries, especially when technical and quantitative signals align. While the SentimenTrader quant focuses on the statistical likelihood of rebounds after sharp selloffs, the Goldman Sachs chart provides additional context by highlighting broader market trends and support levels. Together, these tools help members understand why corrections are often viewed as opportunities rather than threats, and why maintaining discipline during volatility is critical.
As of late May 2025, the market has indeed rebounded from its April lows, with the S&P 500 climbing back above key technical levels. This recovery is consistent with the historical patterns highlighted by both SentimenTrader and Goldman Sachs, reinforcing the report’s message that corrections can offer fleeting opportunities for those who are prepared. The current environment, marked by both sharp declines and swift recoveries, serves as a practical example of how quantitative signals and technical analysis can guide investment decisions and help members navigate uncertainty.
Direct quote from Finom Group’s “Are We Nearing An Inflection Point In Markets?” Report (April 6, 2025):
The quant below was offered inside our March 16, 2025 macro-market Research Report. It never guaranteed a bottom, but rather future return probabilities.
“Nasdaq took 50+ days to enter correction territory. Good news is this is typically a BUYING opportunity. 1-month forward the Nasdaq is higher 80% of the time. 12 months forward the Nasdaq is higher 90% of the time. So long as you have time, today’s cheaper prices are opportunity.”
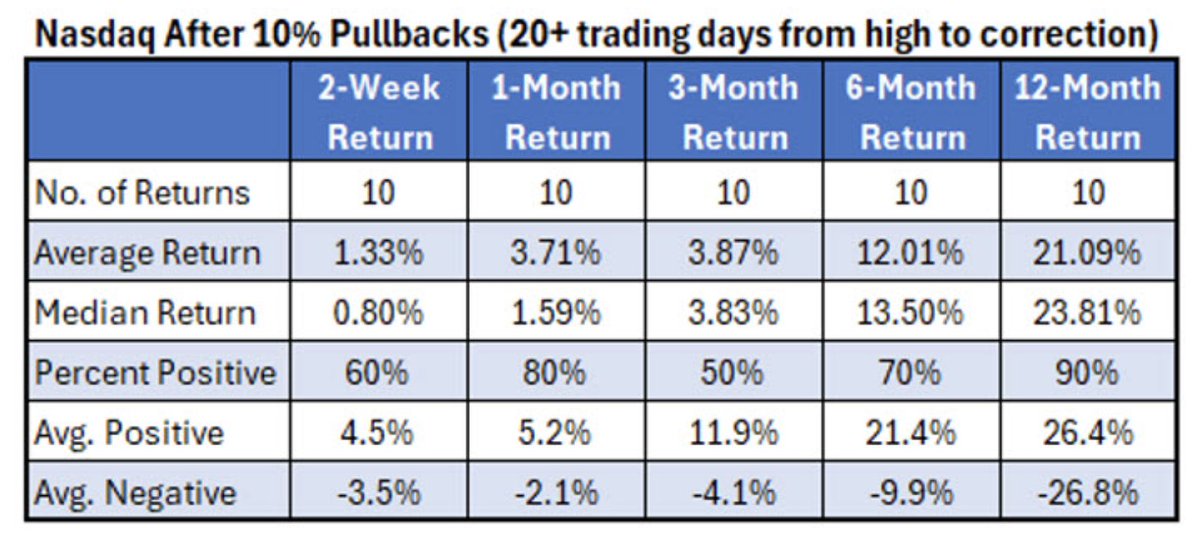
For members unfamiliar with the quant referenced from the March 16, 2025 macro-market Research Report, it is important to note that these quantitative signals are not meant to precisely predict market bottoms. Instead, they offer a statistical framework for understanding the likelihood of positive future returns following significant drawdowns. The recent market action—where the Nasdaq’s correction was followed by a rapid recovery—serves as a practical demonstration of this principle, reinforcing the value of maintaining a disciplined, long-term perspective even amid short-term volatility.
The Nasdaq’s performance since the April correction continues to validate the quant-based approach, as investors who remained patient and took advantage of lower prices have been rewarded by the market’s resilience. This pattern is further supported by broader market data, which shows that despite ongoing policy uncertainty, the tech-heavy index has remained resilient, with strong price action from major components helping to drive the recovery. For new and existing members alike, the recent market experience underscores the importance of relying on proven quantitative frameworks and not letting short-term volatility derail long-term investment strategies.
Direct quote from Finom Group’s “Are We Nearing An Inflection Point In Markets?” Report (April 6, 2025):
The chart above speaks to VIX levels and S&P 500 annualized returns. A VIX greater than 20 is typically associated with negative annualized returns, which we have been experiencing in 2025. Annualized is a fancy term for “rolling basis”. What the chart above fails to depict is that while investors are likely experiencing negative price action with VIX 20+, this is also a savvy investor BUY zone, which is more appropriately recognized in the chart below from Matt Cerminaro:

For new members, it’s important to understand that the VIX is not just a measure of fear, but also a reflection of the options market’s expectations for future volatility. When the VIX is elevated, it signals that investors are willing to pay a premium for protection against further declines. This often coincides with maximum pessimism and, historically, has been a reliable contrarian signal for patient investors.
In the current cycle, the VIX’s rapid ascent was followed by an equally swift decline, as the market viciously rebounded from its April lows. This pattern is consistent with historical precedents, where sharp spikes in volatility have often been followed by strong recoveries. The market’s resilience in the face of ongoing uncertainty underscores the value of the approach outlined in the report: periods of extreme volatility are not just risks to be feared, but also opportunities to be seized by those prepared to act.
Ultimately, the market’s recent action serves as a practical reminder that while volatility can be unsettling, it also creates the conditions for meaningful long-term gains for those who maintain discipline and perspective. The combination of quantitative signals and technical analysis provides a robust framework for navigating these periods, helping members distinguish between short-term noise and genuine opportunity.
Direct quote from Finom Group’s “Are We Nearing An Inflection Point In Markets?” Report (April 6, 2025):
As outlined by the quant, there is a high probability and across all time periods, that the S&P 500 is nearing a trough while the VIX is likely nearing a peak. Ultimate troughs and peaks are still yet to be better understood after the fact. Having said that…
In speaking of terms of short-Volatility ETPs, I’ve been adding short-VOL exposure through the totality of the VIX spike, and still yet have ample liquidity and time to continue this process. Short-VOL is a guaranteed investment, even though the masses perceive it as “a trade.” There is no such thing as generating alpha with a perspective or idea held by the masses. Be where they’re not, do not what they do, and alpha will be realized.


The VIX’s spike above 40 in April–May 2025 was among the most dramatic in recent years, creating the conditions for the short-VOL strategy to shine. As the index rapidly retreated from its highs, those who maintained liquidity and discipline were able to capitalize on the elevated volatility, with short-VOL ETPs and strategies delivering strong returns. The S&P 500’s subsequent recovery from its April lows further validated the quant’s signal that the market was likely nearing a trough as the VIX peaked. While the exact timing of these turning points is only clear in hindsight, the disciplined approach—adding short-VOL exposure during the volatility spike—has once again demonstrated its value for members, particularly as it runs counter to the fear-driven actions of the broader market. This contrarian positioning, focused on maintaining liquidity and acting when others hesitate, continues to distinguish Finom Group’s strategy and has been rewarded as markets stabilize.
Direct quote from Finom Group’s “Are We Nearing An Inflection Point In Markets?” Report (April 6, 2025):
That’s a lot of red for the VIX across all-time frames!! The more time one has, the more profits are realized from the short-VOL investment thesis. From a practical portfolio management approach and the way I also manage through market drawdowns, corrections and bear markets, here is something I’ve learned and expressed within the Golden Capital Portfolio and as it relates to the holdings formerly disseminated above:
“If a market decline and VOL regime continues its path of destruction and fear and if need be, future demands on portfolio liquidity/time can be captured from individual stocks. The guaranteed profits should be respected as individual stocks don’t always come back to former highs. To continue a short-VOL process implementation, liquidity may be needed and to satisfy such liquidity demands, selling individual stock holdings may become part of the process. There are potentially 3 benefits from this exercise if an individual stock loss occurs: 1) tax loss harvesting 2) the guaranteed profit is more secure 3) short-VOL ETPs do not wholly require the S&P 500 to get back to even to achieve their former lows due in part to contango and SPX:VIX is not a 1:1 relationship. In short, forgoing individual stock holdings during such liquidity demand regimes from stock market corrections is a reasonable consideration, with a strong success rate.”

The report’s guidance on managing liquidity demands by selectively selling individual stock holdings—especially those at a loss—has also proven relevant. This approach not only frees up capital for short-VOL opportunities but also allows for tax loss harvesting and reduces reliance on individual stock recoveries, which can be uncertain. Short-VOL ETPs, benefiting from contango and the non-linear relationship between the S&P 500 and the VIX, do not require the broader market to fully rebound for profits to be realized—a key insight for members navigating drawdowns and corrections.
As the market has stabilized in recent weeks, those who followed this disciplined approach have been able to reinvest in short-VOL strategies at advantageous levels, reinforcing the framework’s effectiveness and providing a roadmap for future periods of volatility. The ability to adapt and reallocate capital during market stress, rather than being forced into reactive decisions, has been a defining feature of this cycle for members who adhered to the guidance.
Direct quote from Finom Group’s “Are We Nearing An Inflection Point In Markets?” Report (April 6, 2025):
Remember… ALPHA! Oh and I’ve done this before, many a time before in fact! What, you think I got lucky in our trade alert dissemination language since the first week of March?
Since the report’s publication, the market’s volatility has created both risk and opportunity. Members who followed the guidance and acted on timely alerts have been able to capitalize on the VIX spike and subsequent retreat, as well as the broader market’s recovery from April lows. This approach has allowed them to generate alpha—outperformance relative to the market—by maintaining discipline and liquidity, and by taking advantage of short-VOL strategies and other opportunities highlighted throughout the period.
The ability to deliver consistent results, as referenced in the report, is not the result of luck but of a repeatable process that has been refined over time. The recent market cycle, with its sharp drawdowns and swift rebounds, has once again demonstrated the value of this approach for members who remained engaged and responsive to the guidance. This track record reinforces the practical benefits of the framework, particularly during periods when many investors are caught off guard by rapid shifts in sentiment and price action.
Direct quote from Finom Group’s “Are We Nearing An Inflection Point In Markets?” Report (April 6, 2025):
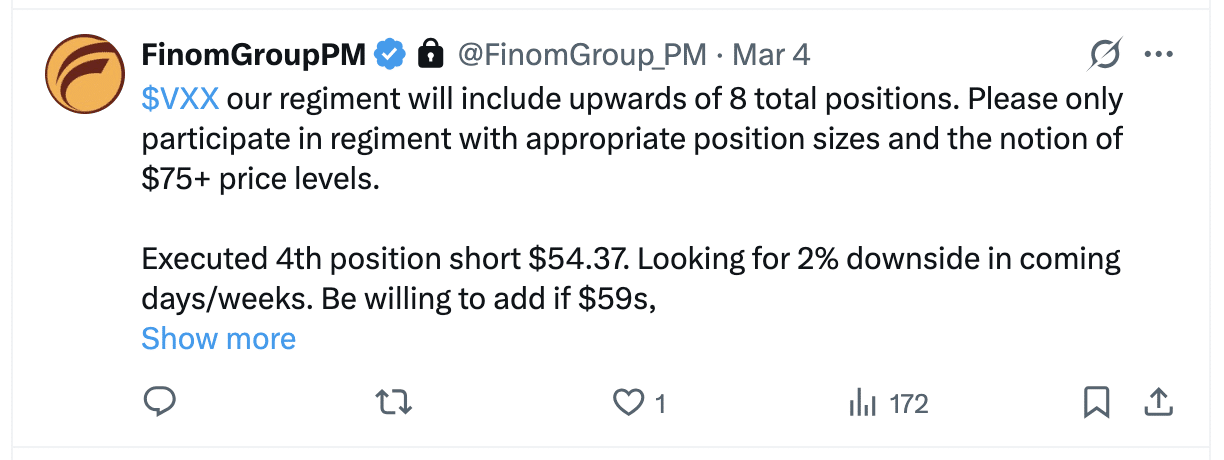
In early March, I thought there were enough inputs to deliver at least a 10% market correction and spike in VIX to potentially 30. With this in mind I desired for Finom Group volatility traders to consider the probability of VXX achieving $75+, which was not a guarantee but rather a probability. With this in mind well in advance of April’s price action, a volatility trader/investor could better position size and plan for liquidity demands accordingly. Not only did these trade alert disseminations help investors define future liquidity needs, but potentially game plan where they would pull liquidity into the portfolio from other holdings, if need be. Now go look at where VXX ended this past week, in terms of price.
The volatility forecasts and trade alerts issued in early March proved prescient as the market delivered a correction exceeding 10% and the VIX surged past 30, ultimately peaking near 45 in April. VXX, the short-term VIX futures ETF, rallied sharply during this period, reaching and surpassing the $75 threshold highlighted in the report. This allowed volatility traders who acted on the guidance to position size appropriately and plan for liquidity needs well ahead of the volatility spike.
For members, the practical value of these alerts has been clear: by anticipating the potential for heightened volatility, investors were able to adjust their portfolios in advance, ensuring they had the necessary liquidity to capitalize on the VIX spike and subsequent opportunities. The accuracy of these forecasts and the actionable nature of the alerts have once again demonstrated their worth, as those who followed the guidance were better prepared to navigate the market’s swings and capture value during a challenging period.
Direct quote from Finom Group’s “Are We Nearing An Inflection Point In Markets?” Report (April 6, 2025):
It’s an open book quiz every week folks, and there are multiple places I personally offer Finom Group members the answers to when and where price will or won’t. Or maybe you think I got lucky 🍀… again? Then why didn’t I just go all cash if I can and often do display the probabilities as well as they become realized? That is not how investing is done well, period. If I felt there was a 90%+ probability of a recession and/or bear market in the next month, I would still hold my portfolio and remain positioned for the long-term, period! You can be afraid and find disdain for drawdowns in your portfolio but still yet achieve every uptick when the uptrend is renewed or do the other thing… and NOT!
Despite the temptation to exit the market amid heightened volatility and negative sentiment, the strategy of remaining invested and focusing on long-term probabilities—rather than attempting to time the market—has once again proven its value. The recent recovery, with the S&P 500 retracing much of its decline and the Coincident Economic Index (CEI) remaining robust, underscores the importance of staying the course and trusting in the process. Members who maintained their positions have been positioned to capture the market’s renewed uptrend, while those who let fear dictate their actions may have missed out on the rebound.
This approach is not about luck, but about consistent application of disciplined principles—even when the outlook appears uncertain. By providing clear, actionable guidance and maintaining transparency, Finom Group continues to help members achieve their long-term investment objectives, regardless of short-term market noise.
Direct quote from Finom Group’s “Are We Nearing An Inflection Point In Markets?” Report (April 6, 2025):
It’s black and white folks, it’s buy and hold and achieve every tick or be able to time perfectly getting out and getting back in with the worse performing trend-following strategies, as they have historically been defined as such! I don’t begrudge those who value trend-following strategies as they mainly get you in after an uptrend has been validated (well after the start of that uptrend) and get you out once a downtrend has been validated, thus avoiding more severe portfolio drawdowns. The problem and underperformance of trend-following strategies is that 1) you don’t get an award of any sorts for “less down” and 2) you have no potential to achieve every uptick when the uptrend is renewed (see below from 2025 Outlook).
More often than not, such strategies employ an entertainment variable for active portfolio managers, while also developing a false sense of controlling outcomes, especially downside outcomes. Let’s face it, we’d all like to avoid the downside while capturing all of the upside. That is simply not how investing works, based on the data let alone the investing Emotional Quotient (EQ). As I’ve articulated many a time over my 25 years of investing/trading, “If one is not able to accept a double-digit drawdown they will likely not capture a double-digit return.” There are few things about investing that prove reciprocal or recursive, but the Emotional Quotient is one that will more often than not prove both.
Below is another graphic and explanatory regarding Buy and Hold vs. Trend-Following strategies:

Recent performance data for trend-following strategies in 2025 has been notably weak, with leading indices such as the HFRI 500 Trend Following Directional Index and HFRX Macro: Systematic Diversified CTA Index posting negative year-to-date and twelve-month returns, reflecting ongoing challenges in a volatile, choppy market environment. This underperformance stands in sharp contrast to the resilience of buy-and-hold strategies during the same period, especially as markets have rebounded from their lows.
Trend-following strategies, while effective at reducing drawdowns during sustained downtrends, often lag during periods of rapid recovery or when trends are short-lived and unpredictable—precisely the conditions experienced in 2025. These strategies typically enter positions only after a trend is confirmed, which means missing the initial upside of market recoveries. As a result, while they may mitigate some losses, they also sacrifice the potential to capture the full upside of renewed uptrends.
The data-driven rationale for a disciplined buy-and-hold approach is clear: accepting short-term drawdowns is often the price of participating in long-term market gains. The emotional discipline required to stay invested through volatility is a recurring theme in successful investing, and recent market action has validated this perspective. Members who maintained their positions through the recent correction have been positioned to benefit from the market’s recovery, while those relying on trend-following signals may have missed out on key opportunities.
Ultimately, the choice between trend-following and buy-and-hold strategies comes down to risk tolerance, investment horizon, and emotional discipline. The current environment, with its rapid shifts and unpredictable trends, has highlighted both the limitations of trend-following and the enduring value of a disciplined, long-term approach.
Direct quote from Finom Group’s “Are We Nearing An Inflection Point In Markets?” Report (April 6, 2025):
1. Every single trend following strategy underperforms Buy and Hold
2. Timing the market with your new-fangled, high profile, because some Twitter guy who wrote a book gets a good deal of publicity, underperforms as well.
3. If you are too afraid of drawdowns, and do everything you can to avoid them, good, the market will void your participation in due time.
4. Chart shows the annualized excess returns for different quantitative rules applied from 1926 to present, where Y-axis is the sell-off from peak at which you buy, and X-axis is the upside point from purchase at which you sell.
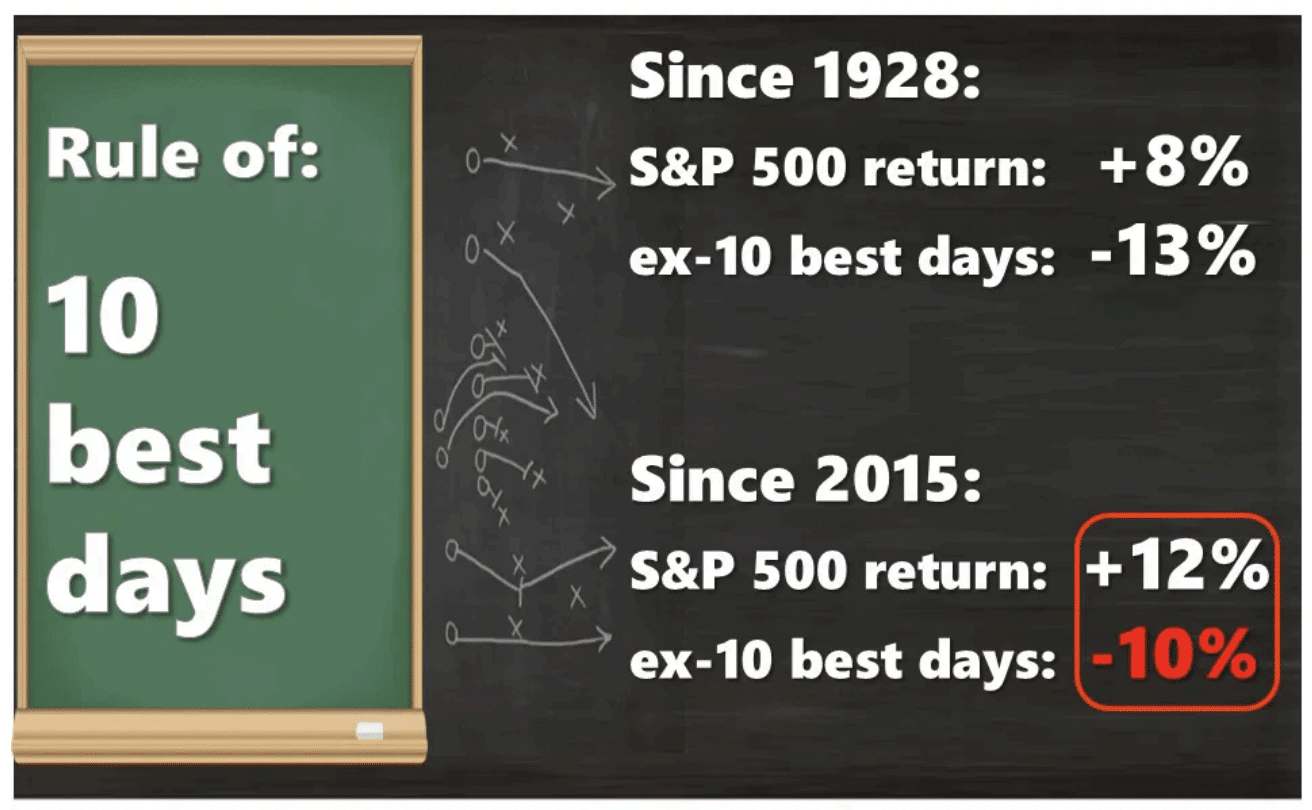
5. Buy-and-hold over same time has an annualized return of +6.4%, a Sharpe of 0.38. Denoted in black italics, the only configuration which results in a superior annualized return is buying when market is down 5%, and then selling when your initial investment is +70%. This results in an annualized excess return of 6.44% versus 6.41% for buy-and-hold. In Sharpe space, that equates to 0.378 versus 0.376. Not worth getting out of bed. (Mann Institute study)
6. If doing anything short of Buy-and-hold, just know it is not likely investing, but more an expression of ego and/or an unhealthy competitive spirit.

The recent market environment has once again validated the enduring strength of a disciplined buy-and-hold approach. While trend-following strategies and market-timing efforts, often popularized by social media influencers and book authors, may offer short-term appeal or the illusion of control, they consistently underperform over the long term. This underperformance is not only evident in historical data but also in real-time results during the volatile market swings of early 2025.
As referenced in the Mann Institute study and illustrated by the chart in the report, buy-and-hold investing has delivered a robust 6.4% annualized return since 1926, with a Sharpe ratio of 0.38. Even the most optimized timing strategies fail to meaningfully surpass these results, and the difference is negligible when accounting for risk and complexity. The psychological challenge of enduring drawdowns remains a critical factor; those who attempt to avoid every market decline often find themselves sidelined during the subsequent recovery, missing out on the very returns they seek.
For investors, the message is clear: the temptation to time the market or chase the latest trend is not only difficult to execute successfully but also counterproductive to long-term wealth creation. The recent market correction and rebound have highlighted the value of staying invested, as those who maintained their positions have been rewarded as the market stabilized. This disciplined approach, grounded in data and emotional resilience, continues to provide the most reliable path to achieving long-term investment objectives.
Direct quote from Finom Group’s “Are We Nearing An Inflection Point In Markets?” Report (April 6, 2025):
I’ve been doing this for 25 years, and when you’ve think you’ve seen everything, that in and of itself should be a warning signal! At the end of the day one has to know themself as an investor/trader. Not everyone can suffer a significant drawdown well and make well-informed or resourced decisions absent emotion. Emotion is a son of a _ _ _ _ _ within behavior finance and MOST, MOST can’t control their emotions well when money is on the line. Through a well-telegraphed correction within our 2025 Outlook Report, that never meant Finom Group had the power to change price then anymore than we can change price today. We are all at the mercy of price action, but we can choose how to perceive price action. Today, many are stuck in a place where the price action going forward is perceived to be NOTHING BUT RISK.

The volatility experienced in April and May 2025 has been a stark reminder of the importance of self-awareness and emotional discipline in investing. Even experienced investors have been tested by the sharp swings in the market, with the S&P 500 suffering a double-digit correction before rebounding. This environment has underscored the value of Finom Group’s guidance, which has consistently emphasized the need for members to understand their own risk tolerance and emotional responses to market stress.
While no one can control market prices, investors can control how they react to them. The current market has seen many participants become paralyzed by fear, viewing every price movement as a potential risk rather than an opportunity. This mindset can lead to reactive decision-making, such as selling at the lows or missing out on the subsequent recovery. Finom Group’s approach, rooted in long-term discipline and psychological resilience, has helped members navigate these challenges by focusing on proven strategies and maintaining perspective, even in the face of uncertainty.
The recent market action serves as a practical example of why emotional discipline is so critical. Those who have remained self-aware and adhered to their investment plan have been better positioned to weather the storm and capitalize on opportunities as they arise. For members, the message is clear: while we cannot control the market, we can control our response—and that makes all the difference in achieving long-term success.
Direct quote from Finom Group’s “Are We Nearing An Inflection Point In Markets?” Report (April 6, 2025):
UNFORTUNATELY, those same investors/traders will be found with regret for the past (which is the present). They sold too soon, they shouldn’t have sold at all, and they should have dollar-cost-average into guarantees, because despite the narrative that carries no advanced genius, the markets go up OVER TIME, always!
“This simple image should remind you that humans just cannot accept the fact that the future is out of their control, even as they survived every moment of the past. That’s why investing is about behavior and not economics.” ~Michael Antonelli
The recent market correction and subsequent rebound in 2025 have once again demonstrated the dangers of emotional selling. Investors who reacted to short-term volatility by exiting positions found themselves locked out of the recovery, while those who maintained discipline and stuck to their investment plans have been rewarded as the S&P 500 and Nasdaq have recouped much of their losses. This pattern is consistent with historical data, where attempts to time the market or avoid drawdowns have often resulted in missed opportunities and regret.
The ongoing market turmoil, driven by tariff uncertainty and macroeconomic headlines, has made behavioral discipline more critical than ever. The simple truth—that markets trend upward over time—remains valid, but it is often overshadowed by fear and short-term thinking. The quote from Michael Antonelli underscores the reality that successful investing is less about predicting the future and more about controlling one’s own behavior and maintaining a long-term perspective.
For Finom Group members, this experience has reinforced the value of disciplined, systematic investing and the importance of not letting short-term noise dictate long-term decisions. The ability to remain invested, and even use volatility as an opportunity to add exposure through dollar-cost averaging, continues to differentiate successful investors from those who fall victim to the emotional traps of the market.
Direct quote from Finom Group’s “Are We Nearing An Inflection Point In Markets?” Report (April 6, 2025):
From a quantitative perspective, if this is JUST a normal and to-be-expected correction, it would be the most severe correction if it would then after return to a new all-time high (2011’s 19% correction was during a secular bear market that still had not achieved a new all-time high). For this exercise in forward probabilities, I’ve tapped into my resources at The Leuthold Group. The accompanying table shows all S&P 500 corrections between 12-19% since the index’s 1957 inception, which would eventually find a new all-time high.
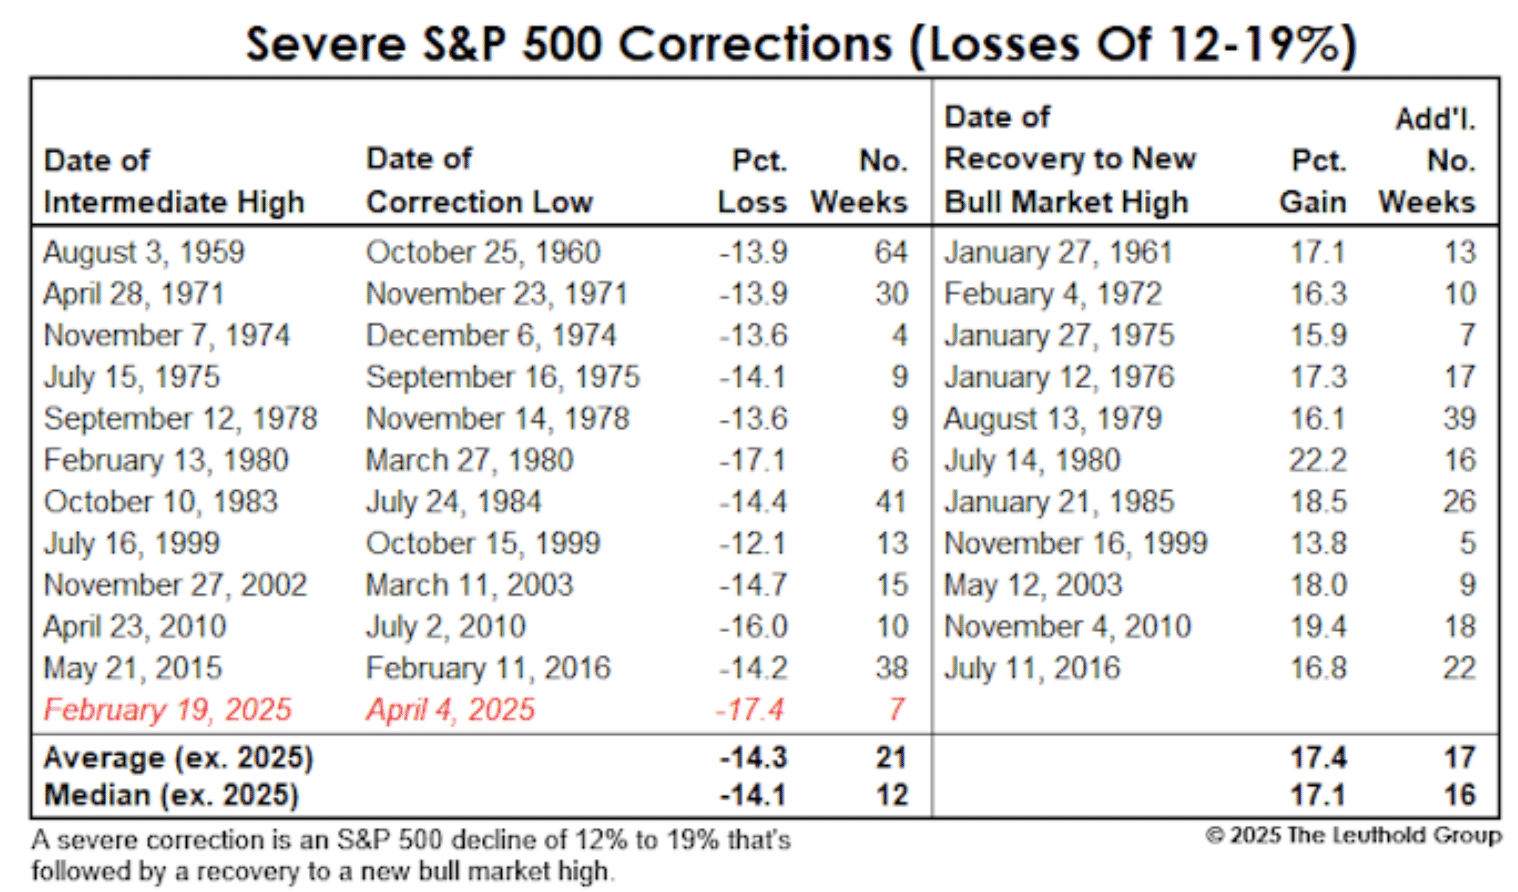
Seth’s use of Leuthold Group data continues to provide a robust framework for evaluating the current correction. As of today, the market’s behavior is tracking the severe end of historical corrections, but the possibility of a new all-time high remains—especially if policy headwinds ease.
The loss to-date already qualifies as the deepest of the severe corrections in the 1957-to-date record book (intraday basis). Investors who are fundamentally or temperamentally inclined to buy this dip should be cheered by the short time frame it would take to reverse the loss (average of 17 weeks), provided the decline stopped short of 19% drawdown.
This insight has proven valuable for members: the market’s rapid decline has indeed created a historic buying opportunity, and the average recovery window remains a useful benchmark as we monitor for signs of reversal.
Direct quote from Finom Group’s “Are We Nearing An Inflection Point In Markets?” Report (April 6, 2025):
Uncharacteristically for a post-election year, the back half of 2025 may prove stronger than the 1st half. This correction occurring in early 2025 may set up a more favorable Midterm-Election year 2026 as well, assuming the endogeny of today is remedied in the near-term. Come the back half of 2025, markets may be in the midst of their recovery process and ahead of highly desired and anticipated tax cut legislation. Assuming such stimulative tax cuts include either corporate tax rate or income tax cuts, the market will look to price such benefits into the market even before such legislation is officially achieved. Instead of the typically weakest S&P 500 returns within a 4-year Presidential calendar cycle (Midterm year), 2026 has the potential to produce its best Midterm year since the double-digit return Midterm year of 2014.

The market’s swift exit from bear market territory (-20% DD on intraday basis) in April and its return to positive year-to-date performance by mid-May suggest that the conditions for a sustained recovery are in place.
Looking ahead, the possibility of stimulative tax legislation and the resolution of current policy uncertainties could further bolster investor sentiment and market performance. Finom Group’s expectation that the back half of 2025 may outperform the first half—despite the typical weakness seen in post-election years—is consistent with the market’s recent resilience and the potential for policy catalysts. If these dynamics continue, 2026 could indeed see a robust Midterm year, breaking the historical pattern of muted returns during that phase of the presidential cycle.
For members, this forward-looking perspective offers actionable insights: the correction has created opportunities for recovery, and disciplined investors who remain focused on long-term trends may be well positioned to benefit from the next phase of the market cycle. If you feel like this is NOT you, are you sure you’re doing that whole investing thing right?
Direct quote from Finom Group’s “Are We Nearing An Inflection Point In Markets?” Report (April 6, 2025):
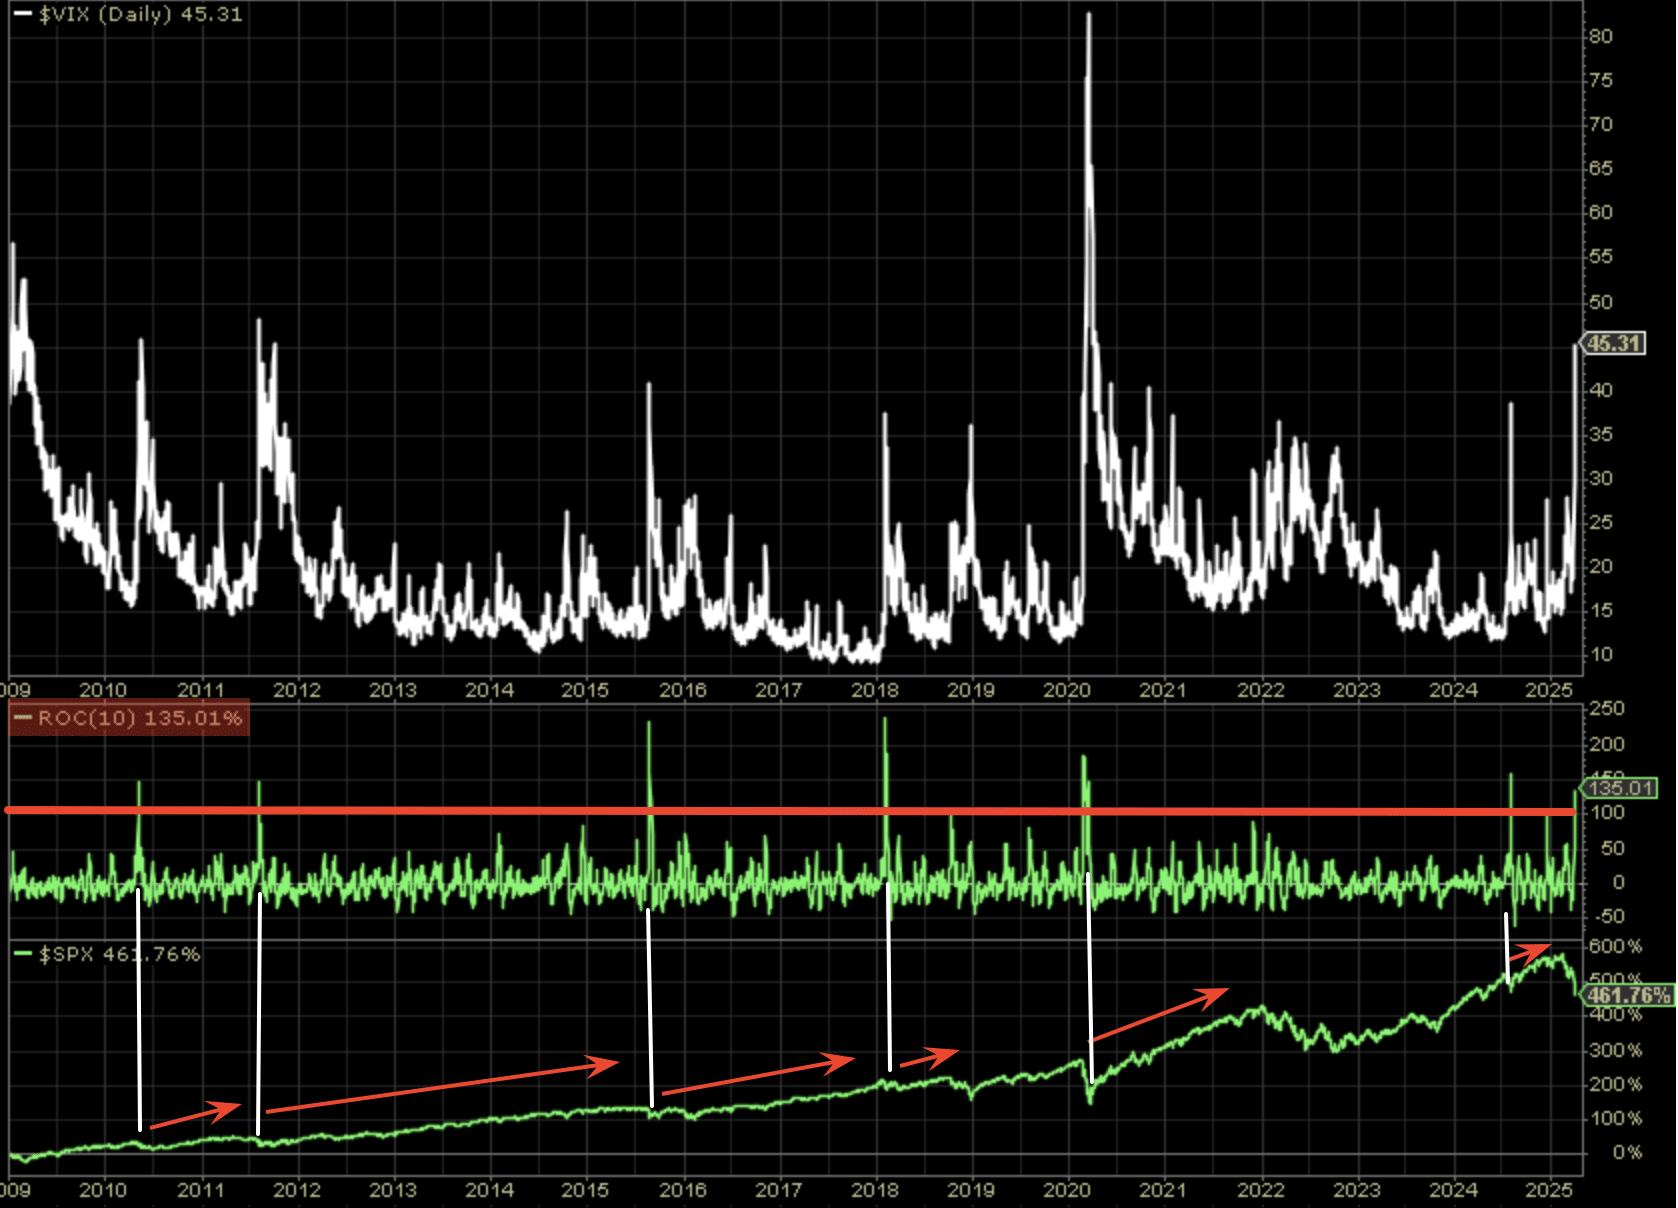
If this back half of 2025 and 2026 probability should be realized, the VIX at 45 today may be forgotten by then, and history suggests that is the HIGHEST PROBABILITY outcome (table of VIX levels and forward returns above) which is also seemingly confirmed by my favorite VIX indicator (VIX 10-day Rate of Change middle panel with SPX chart bottom panel, chart below)! Every time the VIX 10-day Rate of Change got above 100, the market was higher than the signal date 6 and 12-months later. (Starting on October 10th 2025 and 6 months forward, you should remain a buyer of any other dips below SPX $5,074).
Despite recent turbulence, the data suggests that policy clarity (e.g., Fed rate decisions, tariff impacts) and improving breadth metrics could drive stabilization.
While some traders speculate on further volatility (e.g., large VIX options bets for August 2025), Finom’s analysis emphasizes long-term discipline. Historical precedents show that even during extreme VIX regimes (closes above 50), the S&P 500 delivered positive 12-month returns without exception. For members, this reinforces the value of using pullbacks to build exposure to high-conviction ETFs (e.g., QQQ, SPY) and maintaining a diversified portfolio anchored by cash equivalents like SGOV.
In summary, the current environment mirrors past inflection points where volatility spikes masked underlying strength. By focusing on time-tested indicators and avoiding recency bias, investors can capitalize on what Finom describes as a “guaranteed” opportunity—provided they maintain conviction through near-term noise.
Direct quote from Finom Group’s “Confidence Scarring Market Moves” Report (April 13, 2025):
If we hadn’t suggested strapping yourself in and hanging on tight beforehand… what are you waiting for? There’s a veiled suggestion within “strapping yourself in”, as investors are best found remaining long the markets rather than leaving the movie theater, regardless of how volatile it has been or will remain.
Empirical evidence underscores the peril of market timing. Studies reveal that missing just a handful of the market’s strongest rebound days can erode returns dramatically, underscoring the asymmetry of gains and losses in equity markets. This asymmetry is compounded by behavioral biases—loss aversion, recency bias, and emotional decision-making—that often prompt premature selling during downturns, locking in losses and forfeiting participation in recoveries.
In essence, “strapping in” is not merely about passive endurance; it is an active discipline that requires emotional intelligence, rigorous process adherence, and a comprehensive understanding of market dynamics. As history demonstrates, those who embrace this mindset are better equipped to navigate uncertainty and capitalize on the compounding power of sustained market participation.
Looking ahead, while volatility may persist as a feature of the investment landscape, the evidence and experience of seasoned investors alike affirm that remaining invested—anchored by discipline and strategic foresight—is the most prudent path toward achieving long-term financial objectives.
Direct quote from Finom Group’s “Confidence Scarring Market Moves” Report (April 13, 2025):
What could regenerate the bull market after a technical bear market? Typically, that which drove the downturn is what renews the uptrend. If the endogenous trade-tariff policy is what caused the correction, a more positive trade-tariff policy outcome should drive the recovery. That seems to be playing out as of this past week.
Recent developments confirm this thesis. On May 28, 2025, the U.S. Court of International Trade blocked the implementation of several sweeping tariffs imposed under the previous administration, triggering a notable rally in U.S. equity futures and global markets. This ruling, while subject to appeal, has alleviated some of the most immediate trade policy uncertainties that weighed heavily on corporate investment decisions and consumer sentiment. Market participants welcomed the decision as a “marginal positive” that could ease supply chain pressures and reduce costs for importers, thereby supporting earnings prospects and economic growth. Technology stocks, led by companies like Nvidia, surged on the news, reflecting optimism about a less restrictive trade environment and sustained innovation-driven demand.
However, the ruling does not fully resolve trade tensions, as the administration has signaled intentions to appeal and explore alternative legal frameworks to maintain tariff authority. This ongoing uncertainty tempers enthusiasm but does not negate the positive momentum generated by the court’s decision. The pattern is consistent with Finom Group’s analysis: the policy factor that precipitated the correction is now showing signs of reversal or moderation, laying the groundwork for a market recovery.
For investors, this evolving landscape underscores the importance of monitoring policy developments closely, as shifts in trade relations remain a primary driver of market sentiment and volatility. Should a more constructive trade environment materialize, it would likely catalyze renewed investor confidence and support a sustained bull market phase, validating the strategic positioning advocated in prior reports.
Direct quote from Finom Group’s “Confidence Scarring Market Moves” Report (April 13, 2025):
The argument for a V-Shaped bottom/recovery is predicated on the speed of the market decline/correction, inclusive of technical bear markets. We already know this is the 5th fastest correction in history.
…I have also suggested that as a discipline, this endogeny should not find investors/traders losing their discipline. Just because a quant fails to deliver on higher probability outcomes, this does not mean we throw the quant in the garbage and stop using quantitative analysis as part of our investing discipline and framework for engaging price. It simply means it will be harder to maintain the discipline and demands stoic behavior. An example of this can be read at the end of this report, or skip to it now if you like. My friend Brad Carter would suggest this market environment demands “aggressive discipline.”
A failed quant, but that doesn’t mean we throw it in the trash, especially since the S&P 500 is within 1% of that level as of this past Friday. Additionally, we maintain the quant for its absolute perfect forward 3, 6, and 12-month positivity/win rates. Time on the clock ⏰!
Given that such rapid declines have historically produced positive returns; the market achieved its correction label on 3/11/2025 and with a closing price of 5,572. Come 6/11/2025, investors might anticipate the S&P 500 rallying above this level and to remain perfect with respect to the fastest corrections.

Check! ✅ 😉
This data-driven framework gives members both confidence and clarity: rapid, sentiment-driven selloffs are typically followed by robust recoveries, often catching pessimistic investors off guard. As the S&P 500 closed at 5,572 on March 11, 2025, history suggests a strong probability that the index will trade above this level by June 11, 2025, maintaining the unbroken streak of positive outcomes after the fastest corrections. For disciplined investors, this underscores the importance of staying invested and using historical precedent as a guide, rather than reacting emotionally to short-term volatility. In sum, the speed of this correction is not a cause for alarm, but rather a signal to remain patient and positioned for the recovery.
Direct quote from Finom Group’s “Confidence Scarring Market Moves” Report (April 13, 2025):
Such corrections and bear markets hold similar characteristics, likely because what contributed or caused them was endogenous or exogenous.
It took 47 days, which is the third fastest bear market decline in the table. This is good news, as hasty declines have typically led to big gains. Of the 15 bear market declines, 6 took less than 100 days. The SPX was phenomenal after those declines, except for the 1929 crash at the beginning of the Great Depression. Despite that data point, the SPX averaged a +19% gain over the next six months after these declines, and a +23% return over the next 12 months.
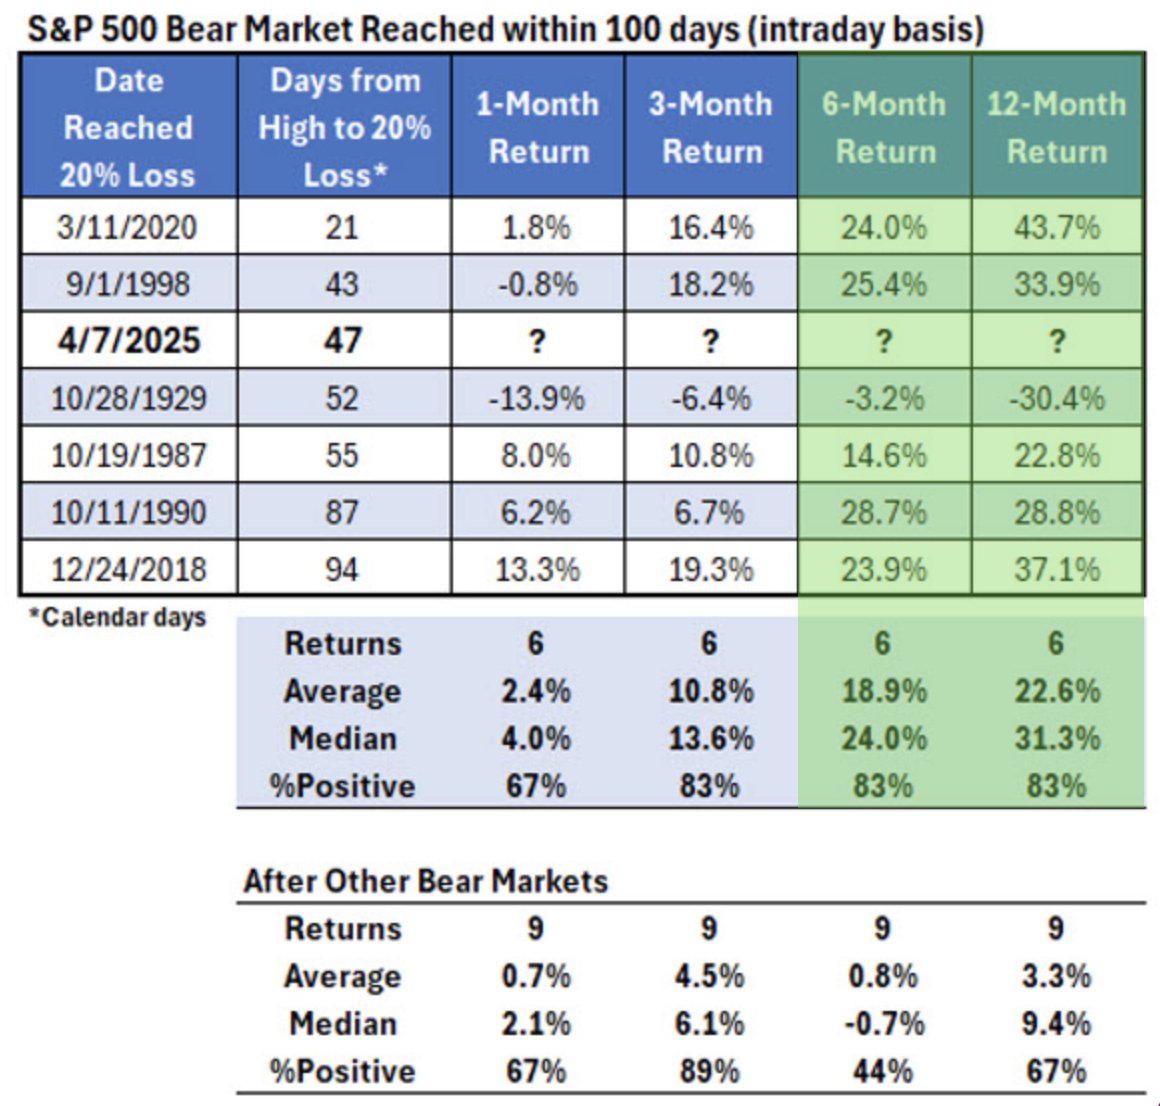
Unlike modern corrections, the 1929 downturn was exacerbated by structural weaknesses such as rampant speculation fueled by margin debt, absence of deposit insurance, the gold standard limiting monetary policy, and inadequate fiscal responses. Today, while some parallels exist—such as sharp market declines and policy uncertainty—key safeguards like the FDIC, flexible monetary policy, social safety nets, and market circuit breakers significantly reduce the risk of a similar systemic collapse. However, should a 1929-style scenario unfold, it would imply a prolonged bear market with potentially devastating economic consequences, requiring investors to prepare for an extended period of volatility, capital preservation, and selective opportunity identification. Historical lessons emphasize the importance of liquidity, diversification, and patience, as the recovery from 1929 took 25 years to regain prior highs, far longer than more recent crises. While current conditions do not perfectly mirror 1929, vigilance is warranted given the severity of recent shocks and the potential for policy missteps to deepen downturns.
If another 30% drawdown were to hypothetically occur, would you be content or disappointed? Your cash levels should provide the answer. While there are no guarantees, it is prudent to always leave room in your portfolio for potential disappointment.
Direct quote from Finom Group’s “Confidence Scarring Market Moves” Report (April 13, 2025):
Moreover, history informs of another quant related to a 50% retracement of a bear market decline. Since 1957, if this feat of bullish strength occurs, the S&P 500 has only made a lower bear market low one time after a 50% retracement of the bear market decline. Yes, that occurrence took place in 2022, which may lead some investors/traders toward recency bias. For this quant to have failed its former perfect track record, you might recall what that demanded. In 2022, this would require another endogenous event, which was Fed chairman Jerome Powell to inform the masses that “more pain” was likely to come and before the end of the rate hiking cycle, at his now famous Jackson Hole speech.
This analysis highlights the importance of understanding both historical market patterns and the potential impact of unexpected policy shocks. While historical data show that a 50% retracement of a bear market decline has been a strong indicator of market resilience, exceptions like 2022 remind investors that endogenous shocks—such as hawkish Federal Reserve communications—can disrupt these patterns. For members, this underscores the need to balance reliance on quantitative historical probabilities with vigilance toward evolving policy developments and market sentiment shifts that may alter expected outcomes.
Direct quote from Finom Group’s “Confidence Scarring Market Moves” Report (April 13, 2025):
Bottom Is POSSIBLY In
While we do not need to know what the absolute bottom of the market will or has been… this breadth stochastic for Tech…
… As of April 7, 2025 there were no Technology stocks trading above their 50-EMA. This has happed only 5 other times since 2009 and marked the bottoms for the Nasdaq (bottom panel) each time.
This analysis highlights the importance of using multiple indicators to confirm market bottoms. The 50-day EMA is a widely respected technical tool for assessing intermediate-term trends, and its utility is further underscored by historical instances where extreme readings—such as zero technology stocks trading above their 50-EMA—have reliably signaled market lows for the Nasdaq. While these signals are compelling, members are reminded that no single indicator is infallible. Combining this insight with additional breadth and sentiment data provides a more robust framework for navigating market cycles and making informed investment decisions. As always, the discipline of seeking confirmation from multiple sources remains a cornerstone of prudent market analysis.
Direct quote from Finom Group’s “Confidence Scarring Market Moves” Report (April 13, 2025):
Given Technology makes up so much of the S&P 500 and even more of the Nasdaq 100/Composite, we understood the weakness in Technology would likely become a reasonable gauge for signaling a bottom of sorts. Hence, the Nasdaq Bullish Percent Index (BPI) was reviewed and understood to have been expressing oversold conditions coming into this past trading week. It got worse, however, much worse! Remember, down is good for both recognizing oversold conditions and potential bottoms.
The Nasdaq 100 BPI fell all the way below 7.5 at its trough this past week, and before bouncing to finish the week sharply higher. What a V-shaped recovery might look like?
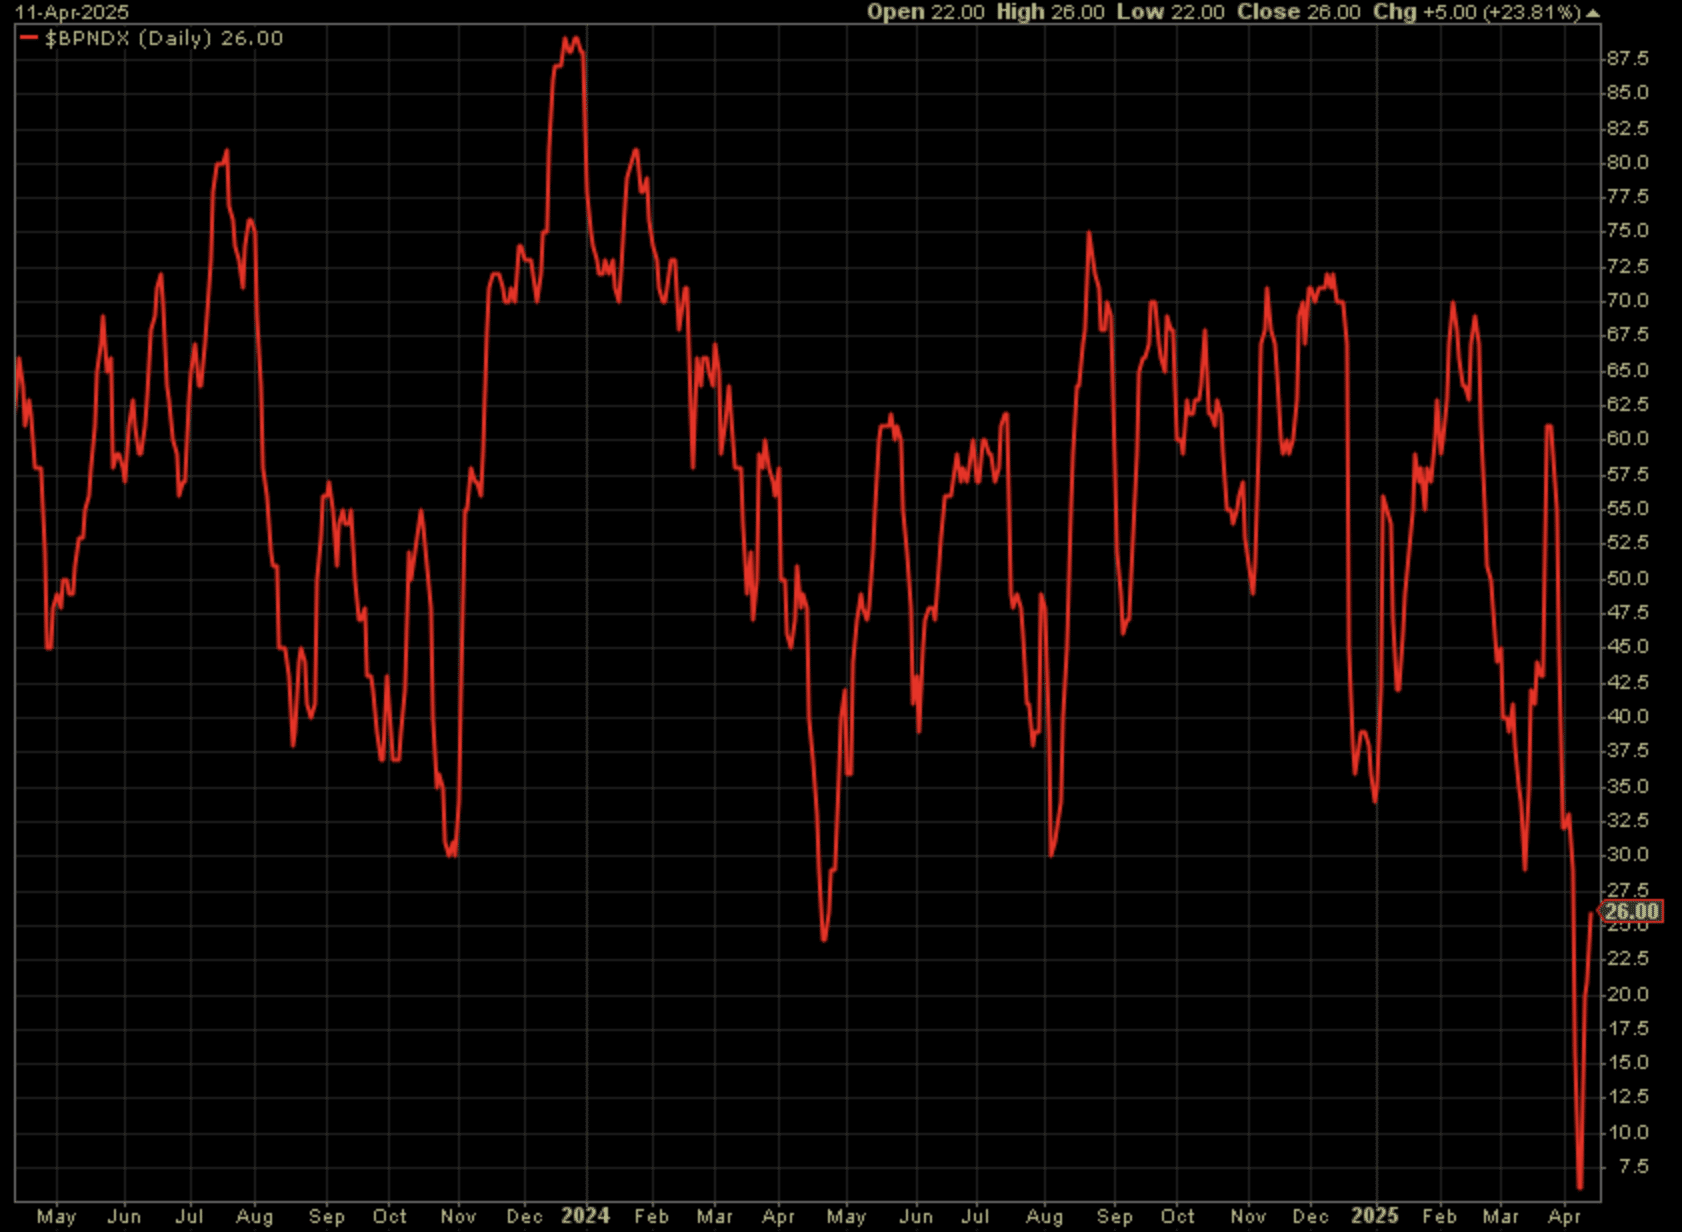
This call has been validated by the subsequent rebound in tech and broader indices, lending credence to Seth’s analysis; members who acted on these oversold signals have seen positive results. Still, it’s a reminder that oversold can get “more oversold” before a true reversal (now 79, levels not last seen since Dec, 2024).
Direct quote from Finom Group’s “Confidence Scarring Market Moves” Report (April 13, 2025):
Individual stock correlations can also inform of market bottoms, as well as tops. Since the start of this technical bear market regime stock correlations have ratcheted higher and hit near record-levels not seen since March 2020. The chart of 3-month forward stock correlations first getting above the 25 threshold informed investors that there was likely endogeny or exogeny in the works.
At it’s recent peak, however, 3-month forward stock correlations informed that everything was getting discarded/sold. Such investor behaviors also played out in commodities and treasuries, further cementing the probability that equities were forming a bottom.
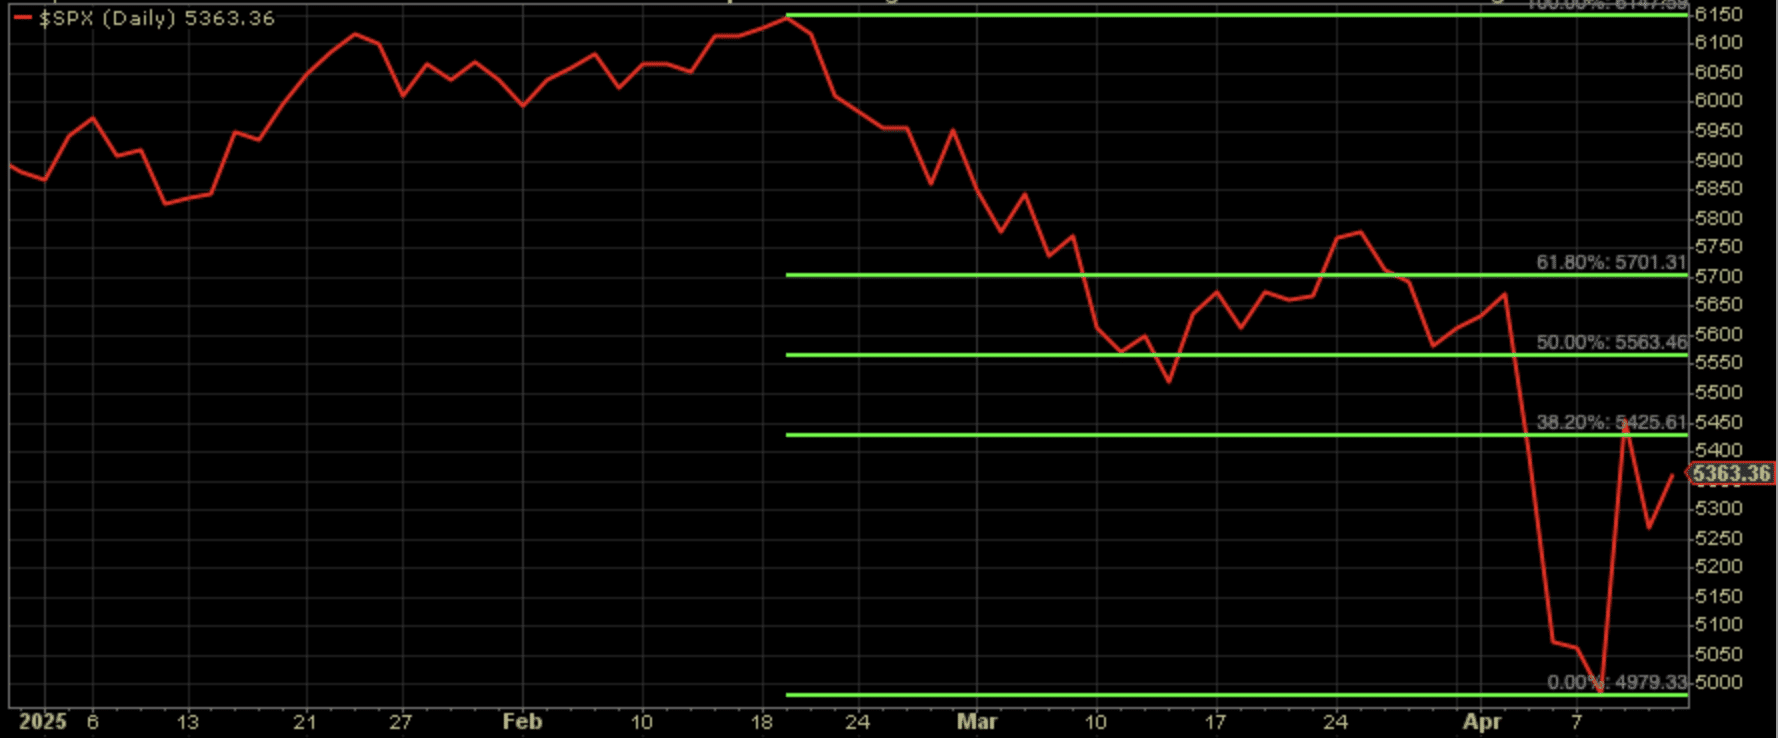
High correlations have indeed signaled panic selling, a classic bottoming feature which supports Seth’s 6,150 $SPX thesis:
However, members should remain alert for any renewed policy shocks that could disrupt this process, and remain alert for a subsequent decline in correlations as a sign that healthy market function is returning (now back below 25 threshold). 😉
Direct quote from Finom Group’s “Confidence Scarring Market Moves” Report (April 13, 2025):
There are so many different ways to validate or invalidate a market bottom has formed. On April 8th, which is now the closing low of the year, the S&P 500’s Average True Range (ATR) was greater than the peak of the March 2020 Covid crisis. This was not good, HOWEVER, this had no ability to prove sustainable. This is how markets force THE END! The end of what?

The ATR spike did mark a capitulation point, as Seth anticipated. The subsequent volatility decline has validated this as a current market low, but members should be aware that ATR can spike again if new shocks emerge.
One of two things either happen or are in the midst of happening, a market crash/ing, which would otherwise force a shift in policy, be it monetary or fiscal. Well, we’ve seen the shift in fiscal trade policy from this kind of ATR, which usually creates a bottom for markets.
Could these find lower levels? Yes! Should you still be buying? Yes! Historically, sentiment doesn’t survive in its current pessimistic/bearish state for very long.
This dynamic has played out, with policy shifts following market stress. Members should continue to watch for further policy responses as confirmation of a sustainable turn and should size positions appropriately, as rare “oversold can get more oversold” scenarios do occur.
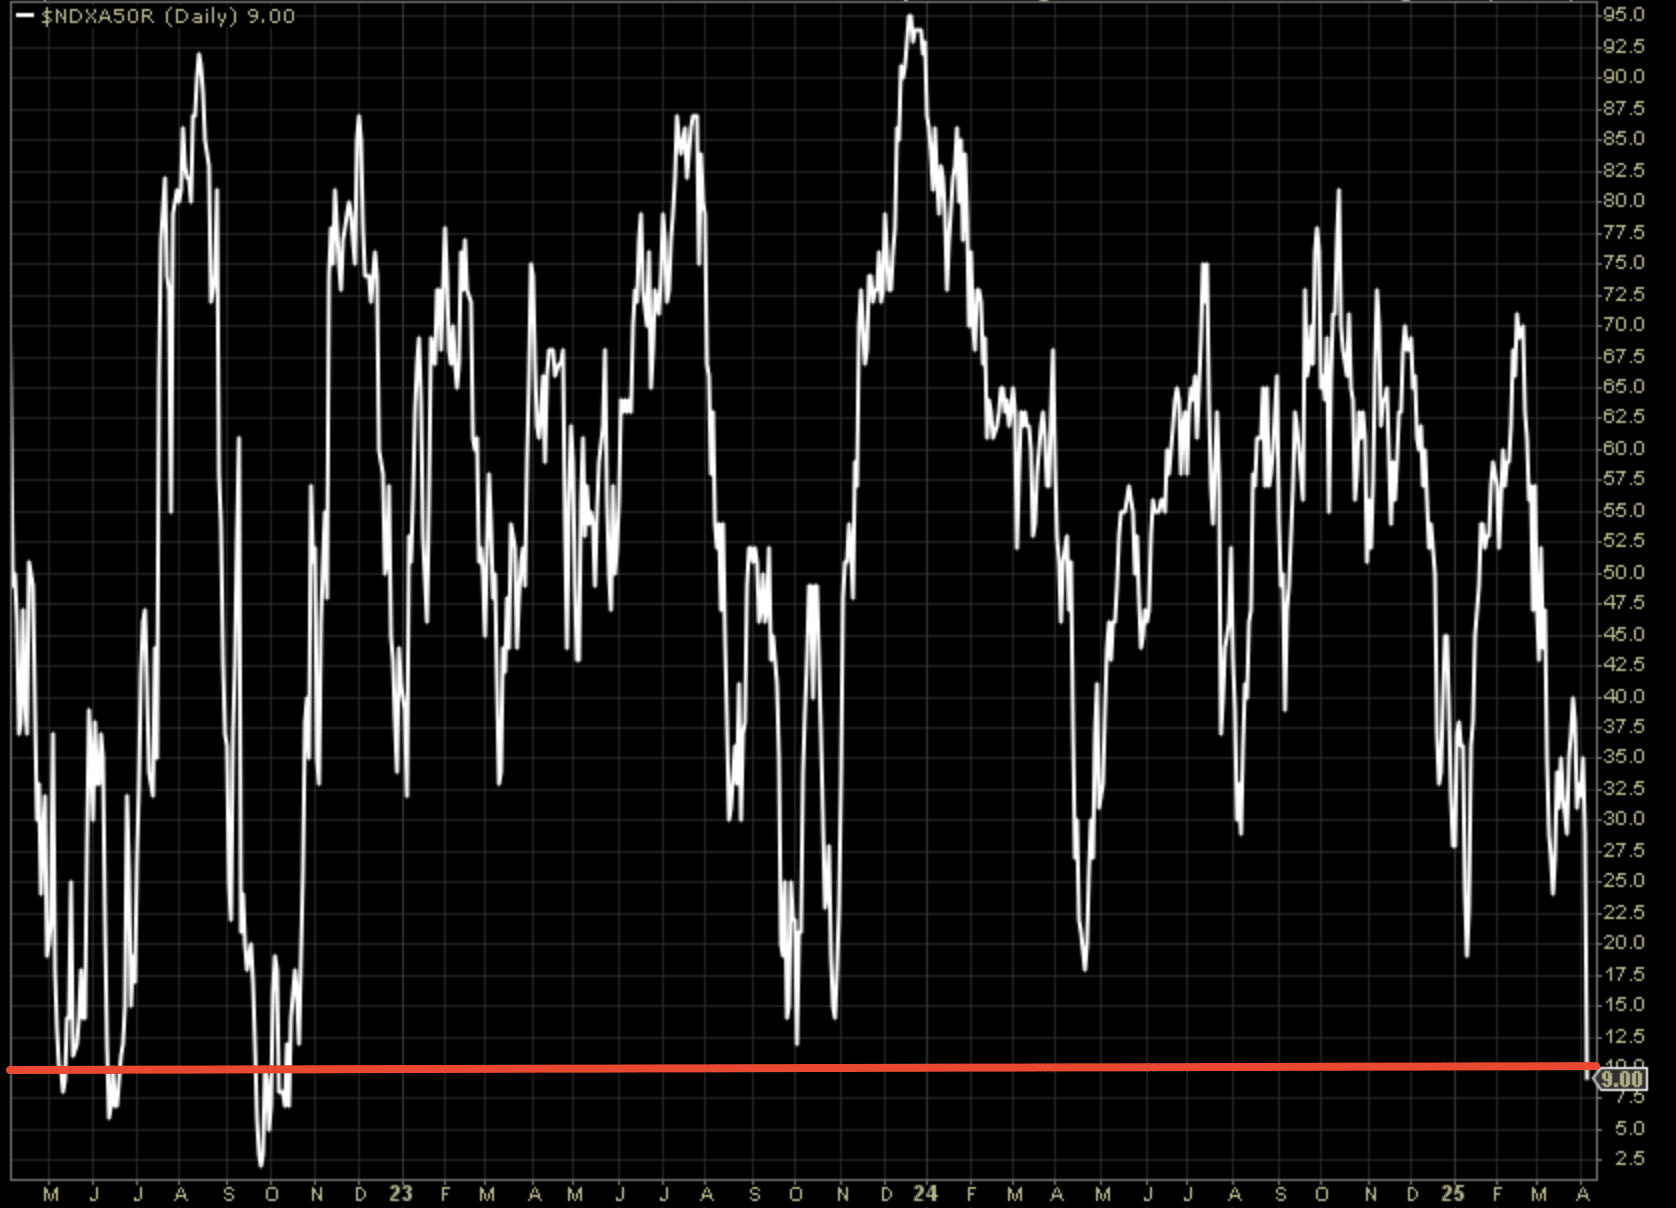
Direct quote from Finom Group’s “Are We Nearing An Inflection Point In Markets?” Report (April 6, 2025):
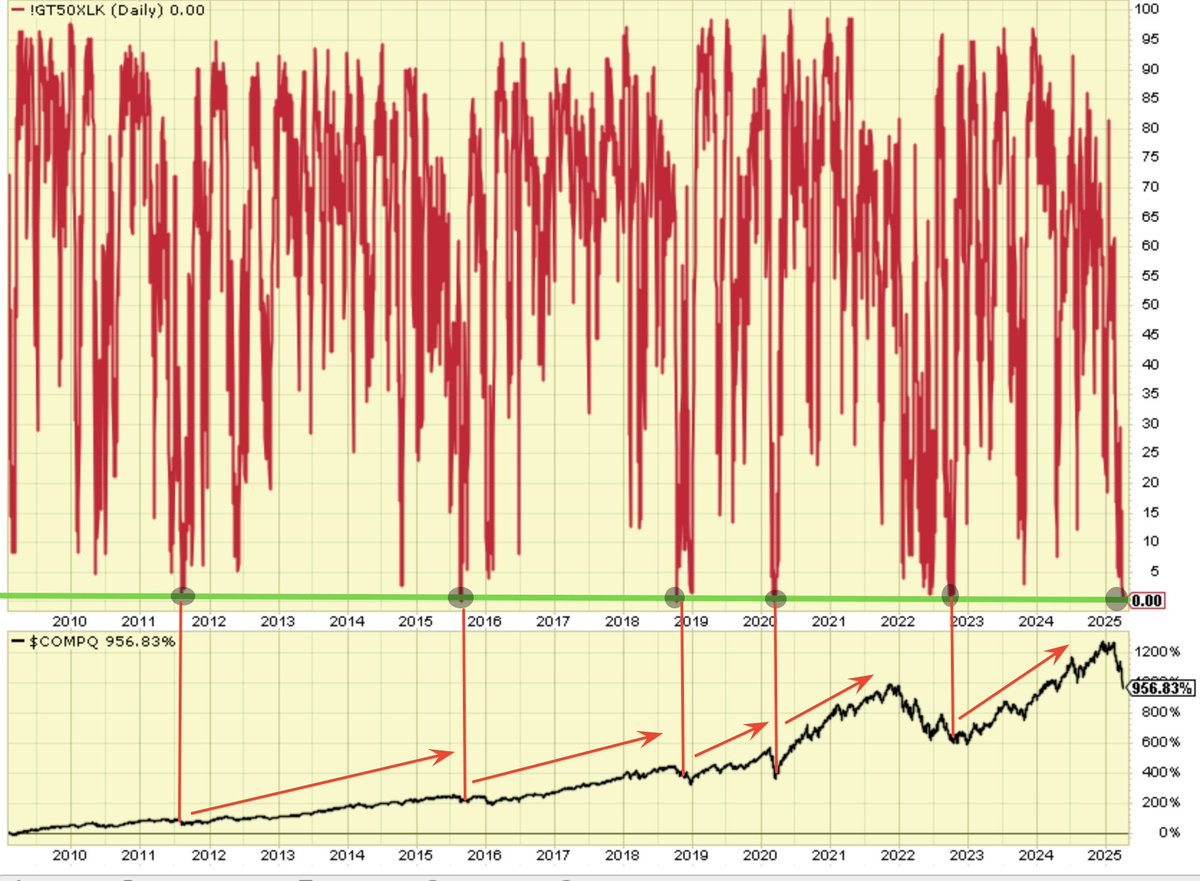
Other index breadth stochastics paint a similar picture, simply confirming the litany of oversold and/or historic buy zones. The top chart identifies the percentage of stocks within the Nasdaq 100 trading above their 50-DMA, which has dropped below 10% for the first time since 2022’s bear market. If you had only bought that bear market, right?

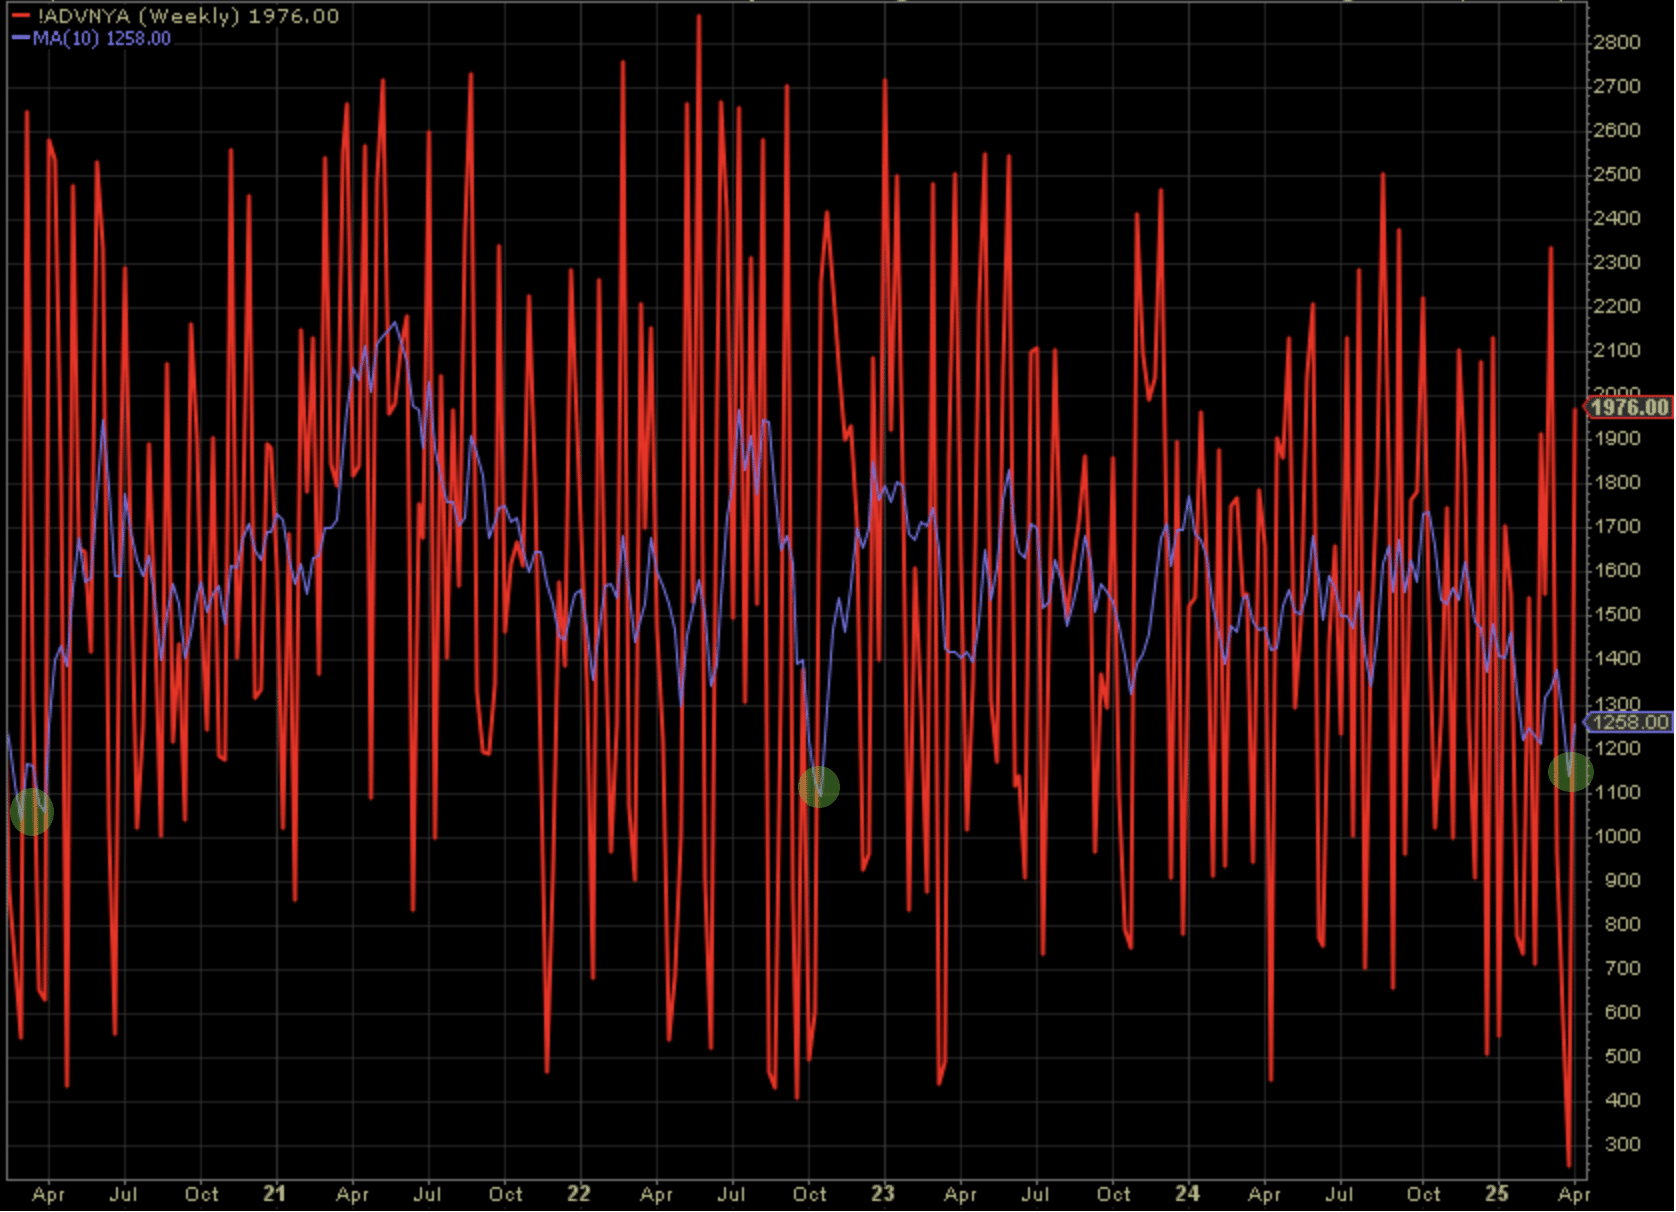
And as it pertains to another one of our potential bottom indicators for this week, the 10-WMA of NYSE Advancers, which we’ve been monitoring as a bottom signal for 2 weeks now.
The only time this stochastic indicator was lower than this past week was during the Covid Crisis in March of 2020. Are today’s forward economic and earnings probabilities really as bad as Covid? Then again, and as we fully recognize, markets tend to exaggerate which tends to be your grand opportunity!
Given the current extreme oversold breadth in major indices and the rarity of so many stocks outperforming the S&P 500—a signal last seen during the Dotcom bubble—investors should selectively add to quality positions now, but only in tranches and with disciplined risk management, as further volatility is likely. Treat this as a stock picker’s market: focus on resilient sectors and individual leaders, watch for confirmation of new market leadership, and remain flexible to adjust as conditions evolve, understanding that while these signals often precede durable rebounds, timing the absolute bottom remains uncertain.
Direct quote from Finom Group’s “Confidence Scarring Market Moves” Report (April 13, 2025):
At Finom Group, we think you should have been buying every aspect of this market decline if one had anticipated a double-digit correction coming into 2025 (as we had forecast), and planned a cash position for dedicated allocation. What is taking place in markets was always a high probability outcome at this stage of the bull market. While I won’t lay claim to a V-shaped or W-shaped recovery process in markets, I will suggest the Smart Money/Dumb Money Indicators suggests if you haven’t been buying the correction, you should be going forward!
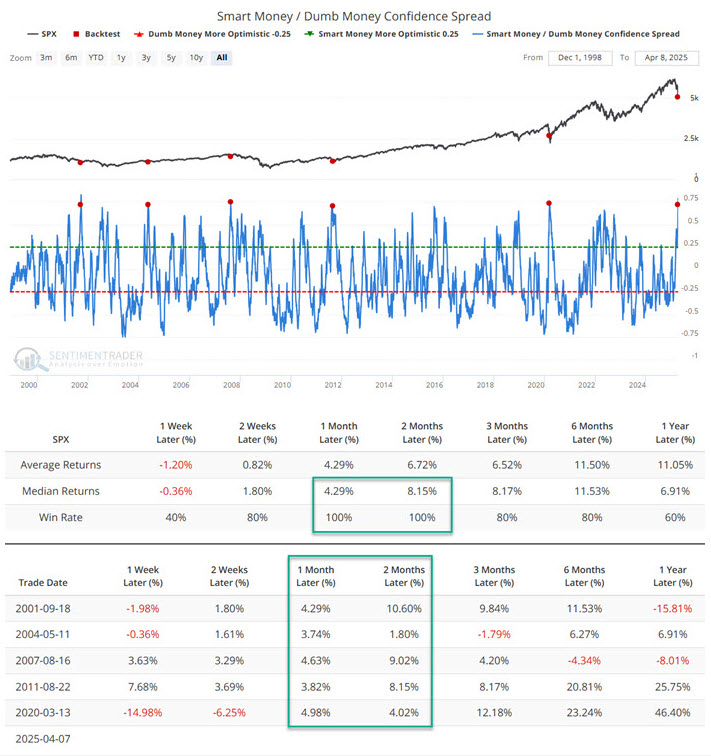
Our forecast for a double-digit correction has been validated, and the Smart Money/Dumb Money indicators continue to support a bullish stance. Members who followed this plan are now well-positioned, but should remain flexible in case of renewed volatility.
Direct quote from Finom Group’s “April Macro-Market Mash-up” Report (April 20, 2025):
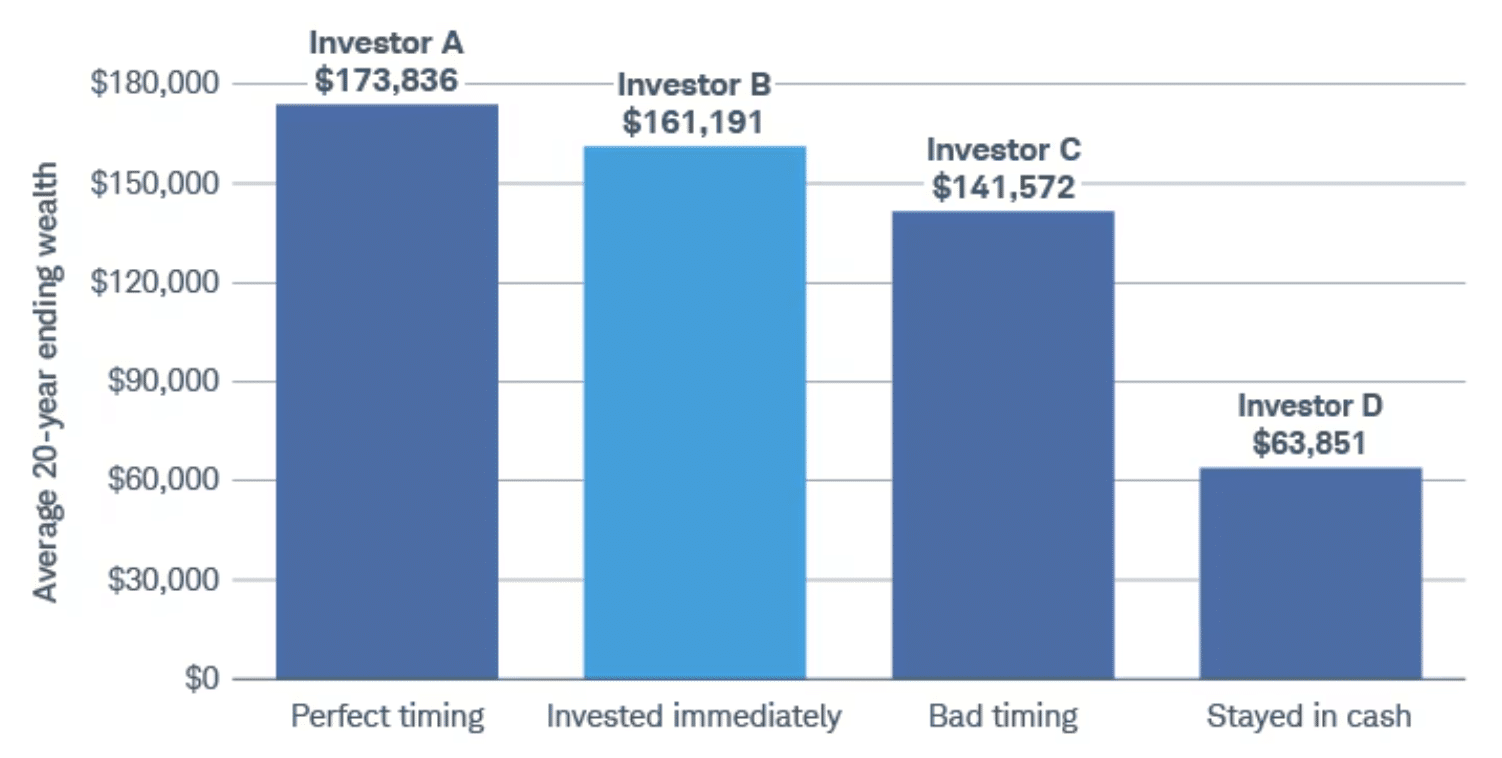
Charles Schwab
What this might mean for you
If you make an annual investment (such as a contribution to an IRA or to a child’s 529 plan) and you’re not sure whether you should invest in January of each year, wait for a “better” time or dribble your investment out evenly over the year, be decisive. The best course of action for most of us is to create an appropriate plan and take action as soon as possible. It’s nearly impossible to accurately identify market bottoms on a regular basis. So, realistically, the best action that a long-term investor can take, based on our study, is to determine how much exposure to the stock market is appropriate for their goals and risk tolerance and then consider investing as soon as possible, regardless of the current level of the stock market.
If you’re tempted to try to wait for the best time to invest in the stock market, our study suggests that the potential benefits of doing this aren’t all that impressive—even for perfect timers. Remember, over 20 years, Peter Perfect amassed $10,537 more than the investor who put her cash to work right away. That’s about $500 extra per year.
Even badly timed stock market investments were much better than no stock market investments at all. Our study suggests that investors who procrastinate are likely to miss out on the stock market’s potential growth. By perpetually waiting for the “right time,” Larry sacrificed $68,344 compared to even the worst market timer, Rosie, who invested in the market at each year’s high.
Consider dollar-cost averaging as a compromise
If you don’t have the opportunity, or stomach, to invest your lump sum all at once, consider investing smaller amounts more frequently. As long as you stick with it, dollar-cost averaging can offer several potential benefits:
- Prevents procrastination. Some of us just have a hard time getting started. We know we should be investing, but we never quite get around to it. Much like a regular 401(k) payroll deduction, dollar-cost averaging helps force yourself to invest consistently.
- Minimizes regret. Even the most even-tempered stock trader feels at least a tinge of regret when an investment proves to be poorly timed. Worse, such regret may cause you to disrupt your investment strategy in an attempt to make up for your setback. Dollar-cost averaging can help minimize this regret because you make multiple investments, none of them particularly large.
- Avoids market timing. Dollar-cost averaging ensures that you will participate in the stock market regardless of current conditions. While this will not guarantee a profit or protect against a loss in a declining market, it will eliminate the temptation to try market-timing strategies that rarely succeed.
That said, if you use dollar-cost averaging instead of lump sum you need to keep some things in mind. If the stock price rises over time, continuing to buy throughout the year will result in an increased average price per share. That would cause you to miss out on possible gains. (That’s what held Matthew back in our example above.) However, if the stock falls over time, you will keep buying at lower prices. But there’s also no guarantee that the stock price will recover.
As you strive to reach your financial goals, keep these research findings in mind. It may be tempting to try to wait for the “best time” to invest—especially in a volatile market environment. But before you do, remember the high cost of waiting. Even the worst possible market timers in our studies would have beat those who neglected to invest in the stock market at all.
In brief
- Given the difficulty of timing the market, the most realistic strategy for the majority of investors would be to invest in stocks immediately.
- Procrastination can be worse than bad timing. Long term, it’s almost always better to invest in stocks—even at the worst time each year—than not to invest at all.
- Dollar-cost averaging is a good plan if you’re prone to regret after a large investment has a short-term drop, or if you like the discipline of investing small amounts as you earn them.
- Lastly, it’s important to note that there’s no guarantee you’ll make money through investing in stocks. For instance, there’s always a chance we could enter another period like the 1960s through early 1980s.
Have you ever heard of the age wealth multiplier? 🤔
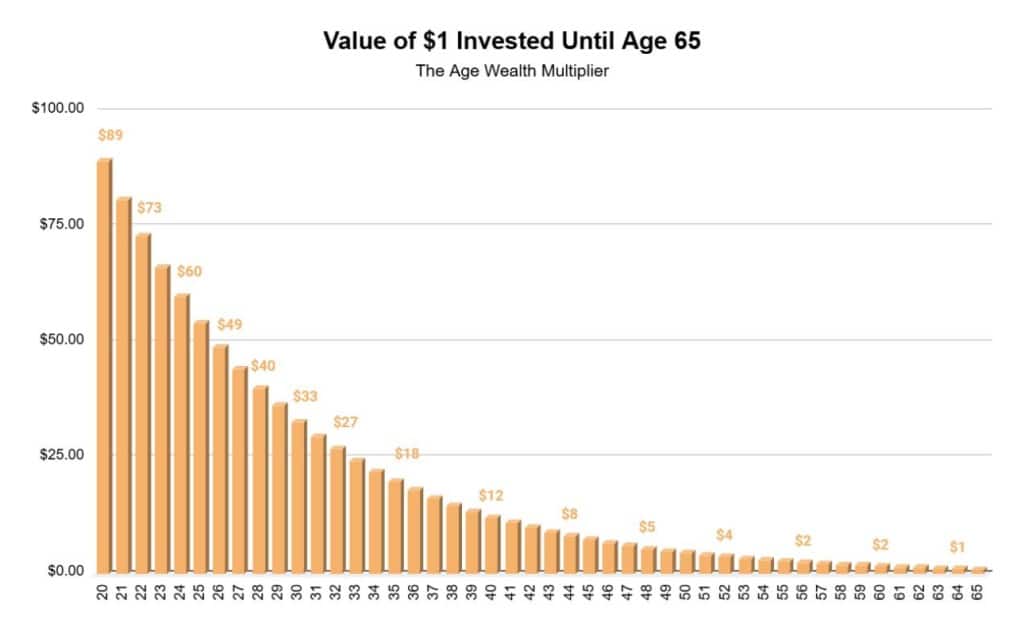 The age wealth multiplier is a measure of how much $1 would be worth
if invested at stock market averages until retirement age. 📈
It’s straightforward, but seeing it presented in this way can be sobering.
If you can invest $1,000 at age 20, it will be worth $89,000 at retirement.
If you wait until age 30, you’d need to invest $2,697 to get that same result. 🎯
It’s very difficult to earn higher returns than your peers, but it’s comparably very easy to be more disciplined than your peers, and start investing sooner. 💸
No matter how old the client, one thing I hear from everyone: “I wish I had started sooner.” Yet, one thing I always hear from young people is that they don’t feel like they have the resources or capacity to be investing.
Let me be clear – if you’re in your twenties, no one is expecting you to be Warren Buffet, but you need to be doing something.
Even if it’s contributing 1% of your salary to your 401(k), or $25 per month in your Roth IRA, those small, good decisions will compound.
Direct quote from Finom Group’s “April Macro-Market Mash-up” Report (April 20, 2025):
The Leuthold Group
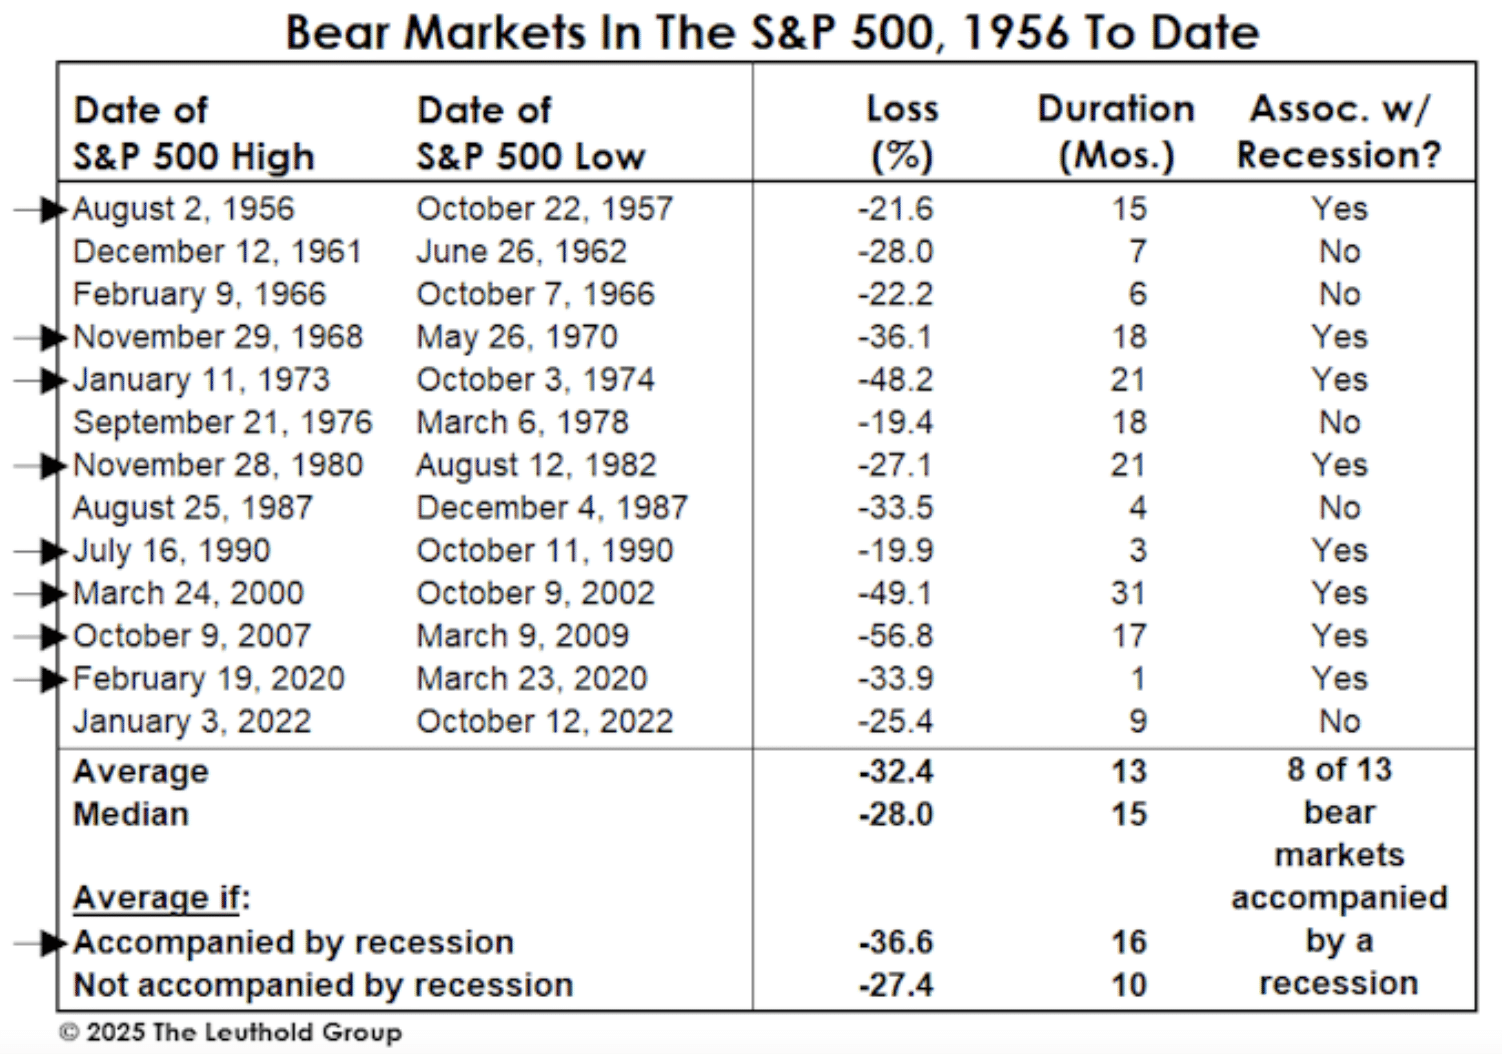
“Chronocentrism” is the belief that the current period is more important or significant than others, past or future. Frequently and often tragically, that view culminates with an investor boasting that “this time is different.”
It’s therefore worth considering that “this time” might well be the same as it ever was, and the recent market plunge could morph into a perfectly normal cyclical bear market. If the S&P 500 were to suffer the 32.4% average loss tallied over the last 13 bear markets, it would fall to 4,153. Of course, when the bear is associated with (or happens to cause) a recession, the downside tends to be deeper and longer lasting. For the eight recessionary bears shown in the table, the S&P 500’s loss was 36.6%, yielding a target for the current cycle of 3,895.
The second table, showing S&P 500 valuations at bear market lows, can easily be used to calculate price targets that aren’t appropriate for a family-oriented publication. A PG-rated exercise would be to assign the median P/E ratio seen at the four “New Era” bear market lows (16.9x) to a 5-Yr. Normalized EPS estimate one year out of around $208. That takes the S&P 500 down to 3,515—just below its October 2022 low. However, we’ll base our decisions on conditions, not price levels.
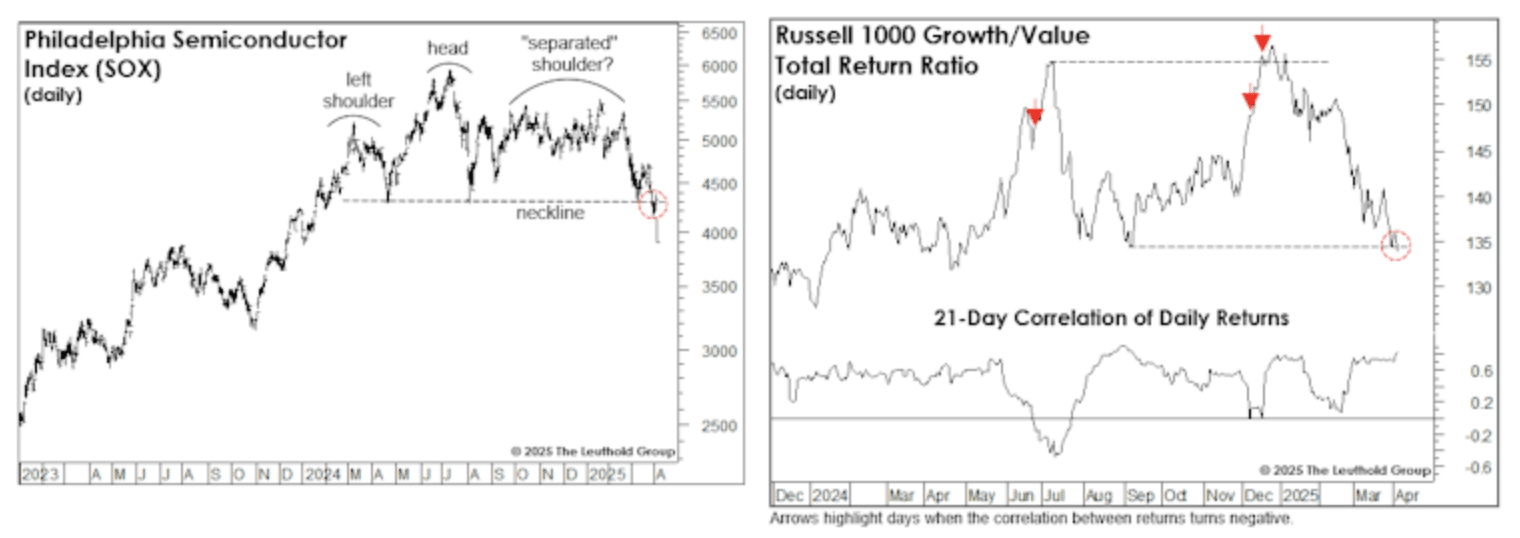
The declines of April 3rd and 4th were a mass liquidation in which investors didn’t bother distinguishing between Growth and Value. However, there are signs that a rotation from the former to the latter is underway. Keep in mind that the most reliable catalyst for a leadership change is a bear market.
First, the bellwether Philadelphia Semiconductor Index (SOX) has broken down from the 15-month head-and-(separated)-shoulder pattern we began to write about several weeks ago. If the SOX fulfills the “measured move” price target prophesied by the pattern, it will drop below 3,000—a 50% loss from the peak. Take that with a grain of salt. The important message is that the backbone of the mania—AI and the technology that enables it—has been broken.
Second, Large Cap Growth has (just barely) broken below last summer’s initial relative-strength low vis-a-vis Large Cap Value. Growth stocks have looked rich compared to Value for a long time, and we noted last summer that the breakdown in the correlation between these styles’ returns might herald a turning point, as it did in both 2000 and 2020. So far, so good.
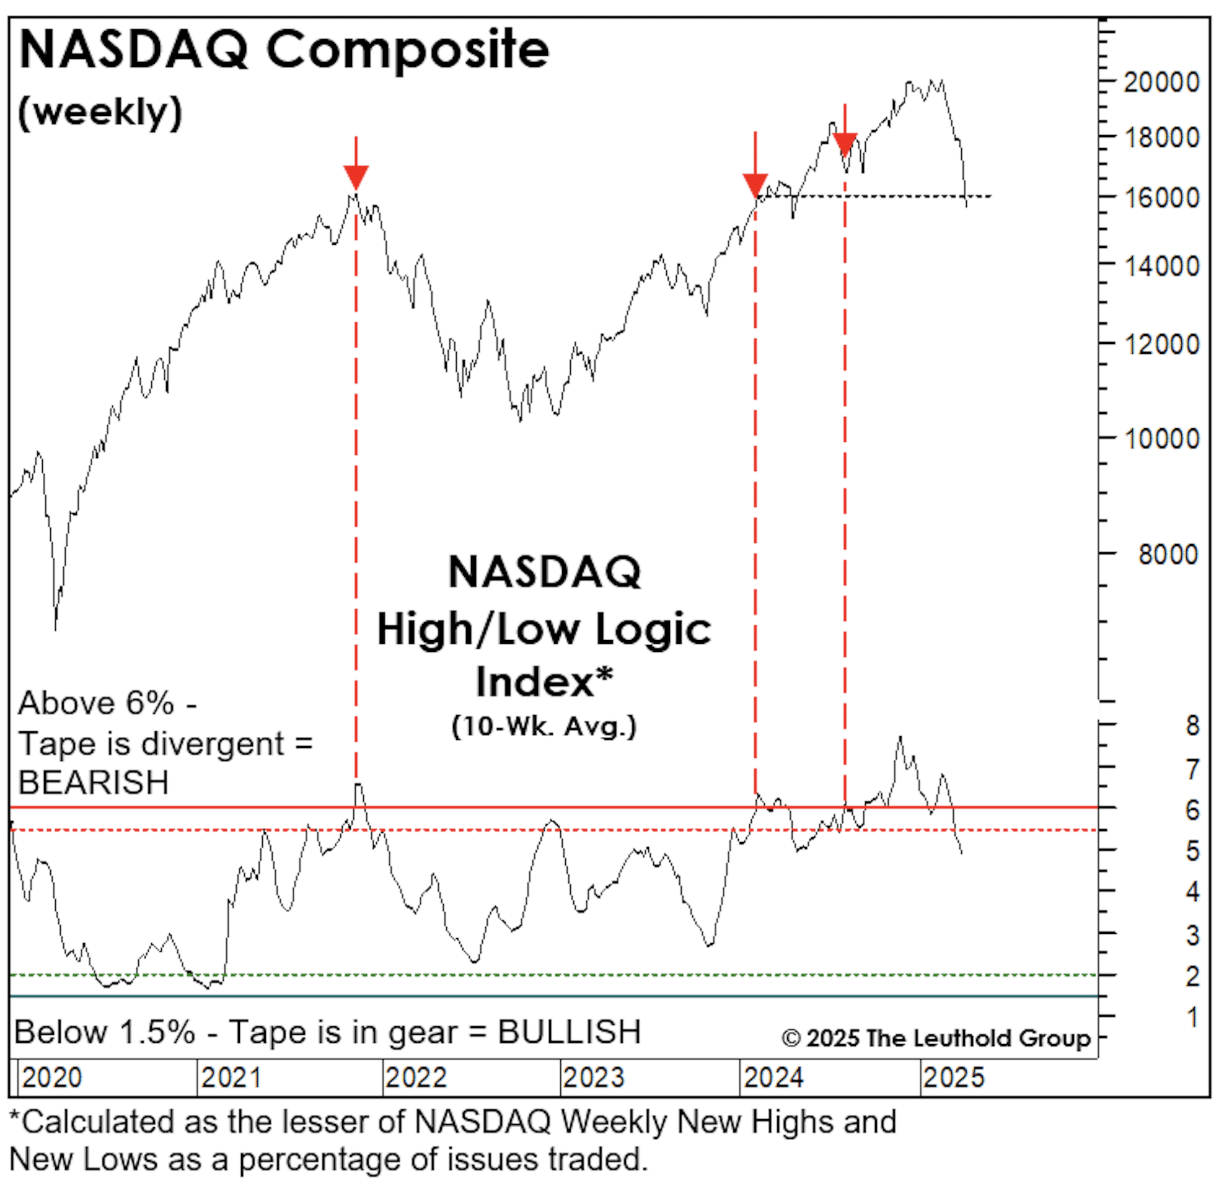
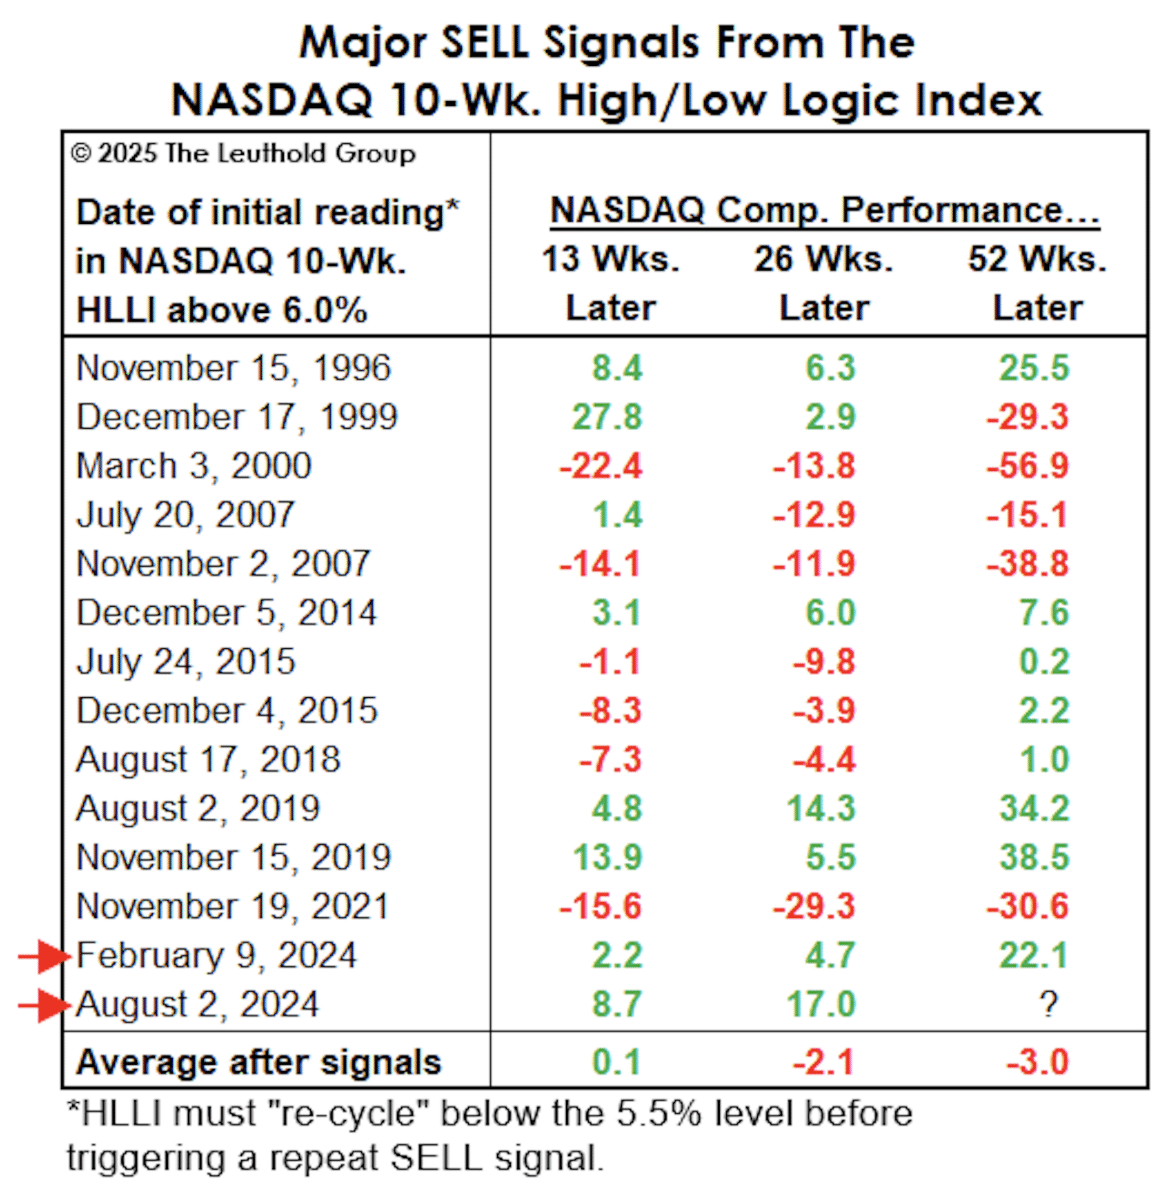
Finally, the NASDAQ Composite has fallen to the extent that the initial SELL signal from the High/Low Logic Index (HLLI) issued on February 9, 2024 is now in the money. Elevated readings on the HLLI indicate simultaneously high levels of 52-Wk. Highs and 52-Wk. Lows on the NASDAQ, a “bi-furcated” situation that usually spells trouble. In this case, though, that trouble didn’t materialize for eight months after the initial signal. (NASDAQ’s peak was December 16th.) As a reminder, while this is a noted Sell Indicator, had you sold in February of 2024, one would have missed another 20% upside before the Nasdaq eventually went into a bear market in 2025.

Strategic Implications for Investors
-
Avoid Timing the Bottom: Leuthold stresses that bear markets often overshoot fundamentals, urging investors to prioritize “conditions over price levels”.
-
Rotate to Defensive Sectors: Value stocks and sectors with stable cash flows (e.g., utilities, healthcare) may outperform as Growth unwinds.
-
Monitor Tariff and Policy Risks: The “rogue tariff regime” and Fed restraint could extend the downturn, particularly if inflation remains sticky.
-
Prepare for Volatility: The S&P 500’s narrow leadership (top 20 stocks driving 85% of returns) and high valuations suggest ongoing turbulence, favoring active management.
In summary, while history suggests this was a typical cyclical bear, exogenous shocks (tariffs, recession) could further erase gains. Investors should balance defensive positioning with selective opportunities in oversold tech sectors, guided by robust, cash-management disciplines.
Direct quote from Finom Group’s “Markets Will Test Investors’ Patience And Resolve” Report (April 20, 2025):
Nobody said 2025 was going to be easy? Well, maybe the Wall Street strategists implied so with their median S&P 500 (SPX) forecast of 6,500. Either way, keep your seatbelt buckled, arms and legs inside the market vehicle at all times and until the ride/year comes to a stop, kindly!
How have you performed in 2025? How has your behavior benefited or detracted from your portfolio’s year-to-date performance? Asking for a friend, and we all need friends in this business of portfolio management/investing.
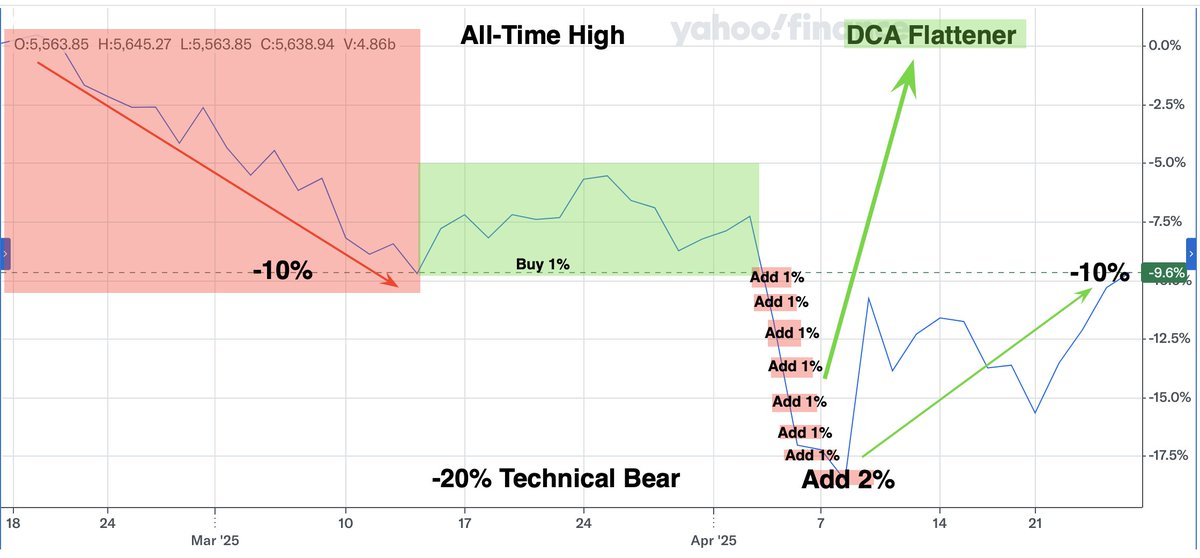
I had originally planned for the probability that if the Finom Group 2025 Outlook was to come to fruition (it largely has), the Golden Capital Portfolio was likely to underperform in 1H 2025. A -10%+ correction with elevated volatility (VIX) and with Growth stocks/VXX the most heavily weighted holding in the Portfolio, this was a reasonable expectation. Having said that, I’ve been pleasantly surprised to-date with Portfolio outperformance. The outperformance has been due to behavior. The behavior was simply sticking to a time-tested, disciplined process. Just keep buying, just keep selling rips, and since the -10% correction level, build back those core holdings and increase long-term exposures.
Look, most of my positions are still under water to-date (down Y/Y on price basis) and since the February all-time highs. Most of the outperformance was a dedicated long position in SGOV (38% weight at highs) and other dividend producing holdings. SGOV is simply a Treasury bond, high yielding ETF that is as liquid as cash. Additionally, the fact that most Golden Capital Portfolio holdings are no more than 1% – 2% holdings limited total exposure to the near-bear market decline in 2025. Lastly, the decision to continue buying the Nasdaq 100 (QQQ) into its full bear market teeth has greatly benefited the Portfolio as a whole and since QQQ’s rebound. From the highs, QQQ fell some -23% (intraday basis) and has since rebounded +11%, now down just -8.3% year-to-date. The dollar-cost-averaging efforts, and going after this Growth index, was part of the game plan issued in the Finom Group 2025 Outlook report. With this holding’s performance of late, I’ve since begun to reduce QQQ in the Portfolio given it became overweighted and due to the tenets of the Golden Capital Portfolio. This action was disseminated to Finom Group Premium members who participate in our Trader’s Corner platform on Telegram.
To reiterate, the reduction in this holding is largely due to certain of the tenets of the Golden Capital Portfolio, but I also believe the market will remain volatile for the foreseeable future and should be recognized as a “buy the dip and sell the rip” market environment until further notice. Please don’t conflate this action taken as an indication that I believe the rally is over. For that we will want to look at the technicals. For that we will care not, regardless! Remember; game-plan using a time-tested process… and execute. There’s no such thing as an ultimate top if you have time on the clock and manage cash well. If we place ourselves in win-win situations and look to capitalize on long-term guarantees (index and most sector ETFs), there are only downside opportunities to rejoice.


In 2025’s volatile, correction-prone market, disciplined portfolio management—not market timing—has driven outperformance. The Golden Capital Portfolio’s strategy of maintaining high cash-equivalent allocations (like SGOV), limiting individual stock exposures, and systematically dollar-cost averaging into major index ETFs (such as QQQ) during downturns has allowed it to capitalize on rebounds while mitigating risk. As markets remain choppy, the playbook is clear: stick to a “buy the dip, sell the rip” approach, rebalance regularly to keep allocations in check, and use volatility as an opportunity to build core positions rather than a reason to panic. This process-driven mindset, combined with prudent cash management, positions investors to thrive in both rebounds and continued volatility, underscoring that long-term success is less about perfect timing and more about consistent execution and risk control.
Direct quote from Finom Group’s “Markets Will Test Investors’ Patience And Resolve” Report (April 27, 2025):
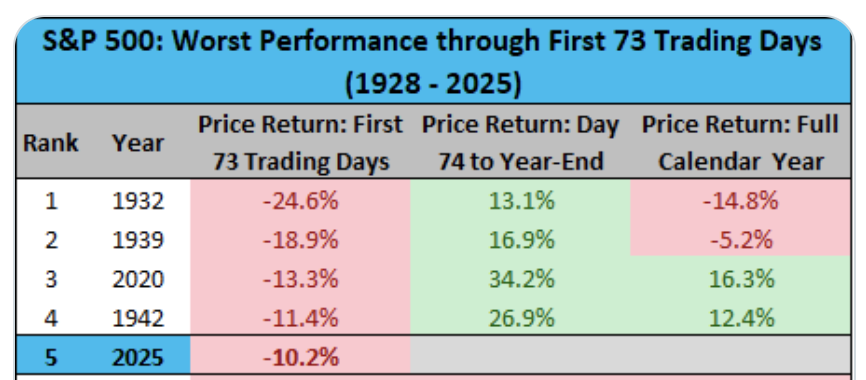
As I have also said over the last couple of months and since the end of the Q1 period, “When near-term probabilities fail, start to move the goal posts and think/position longer-term.” Sometimes, getting the garbage price action, the correction out of the way early in the calendar year can be a very, very good thing, especially when combined with waterfall-like price action.
As one can discern by the sample size in the table of worst first 73-trading days of the year, such waterfall-like declines are rare. Even so, they have always led to higher prices for the remainder of the calendar year while delivering double-digit returns. I’m not using this quant as a guide, but when paired with the former quant from Fundstrat above, the probabilities still look favorable for higher prices by year-end.
This is not a market with normal price action. I offer this as a fact and as determined by the limited samples in the 2 positioned quants regarding the price action year-to-date. If it’s rare then it’s not normal, period! And if it’s not normal then we should exercise a higher level degree of caution reflected in position sizing.
Rather than reacting with panic, investors should use such periods to shift their focus to the longer term and adjust position sizes to reflect heightened caution, ensuring portfolios are resilient to continued volatility. By pairing robust quantitative analysis with disciplined cash management, investors can navigate abnormal price action while positioning for favorable year-end outcomes via DCA.
Direct quote from Finom Group’s “Markets Will Test Investors’ Patience And Resolve” Report (April 27, 2025):
The VIX having delivered one of its highest volatility regimes in history helps to validate the abnormal price action thesis. So does the following failed quant:
“Another VIX quant studies when the VIX climbs and closes above the 25 level on consecutive days and for the first time in 6 months. (Nautilus Investment Research)
Since satisfying the 3-week forward probability, the 1-month probability has failed to deliver, and due to the endogeny surrounding the April 2nd reciprocal tariff outline. Again, that is how endogeny detracts from the quants. Having said that, the worst of the endogenous force factor may be in the rear-view mirror as the negative force has already played out with a technical bear market and a softer policy stance by the White House administration since April 2nd. If a negative endogenous factor produced the negative price action, then a more positive endogenous factor can remove the negative price action, which has been taking place over the last couple of weeks.
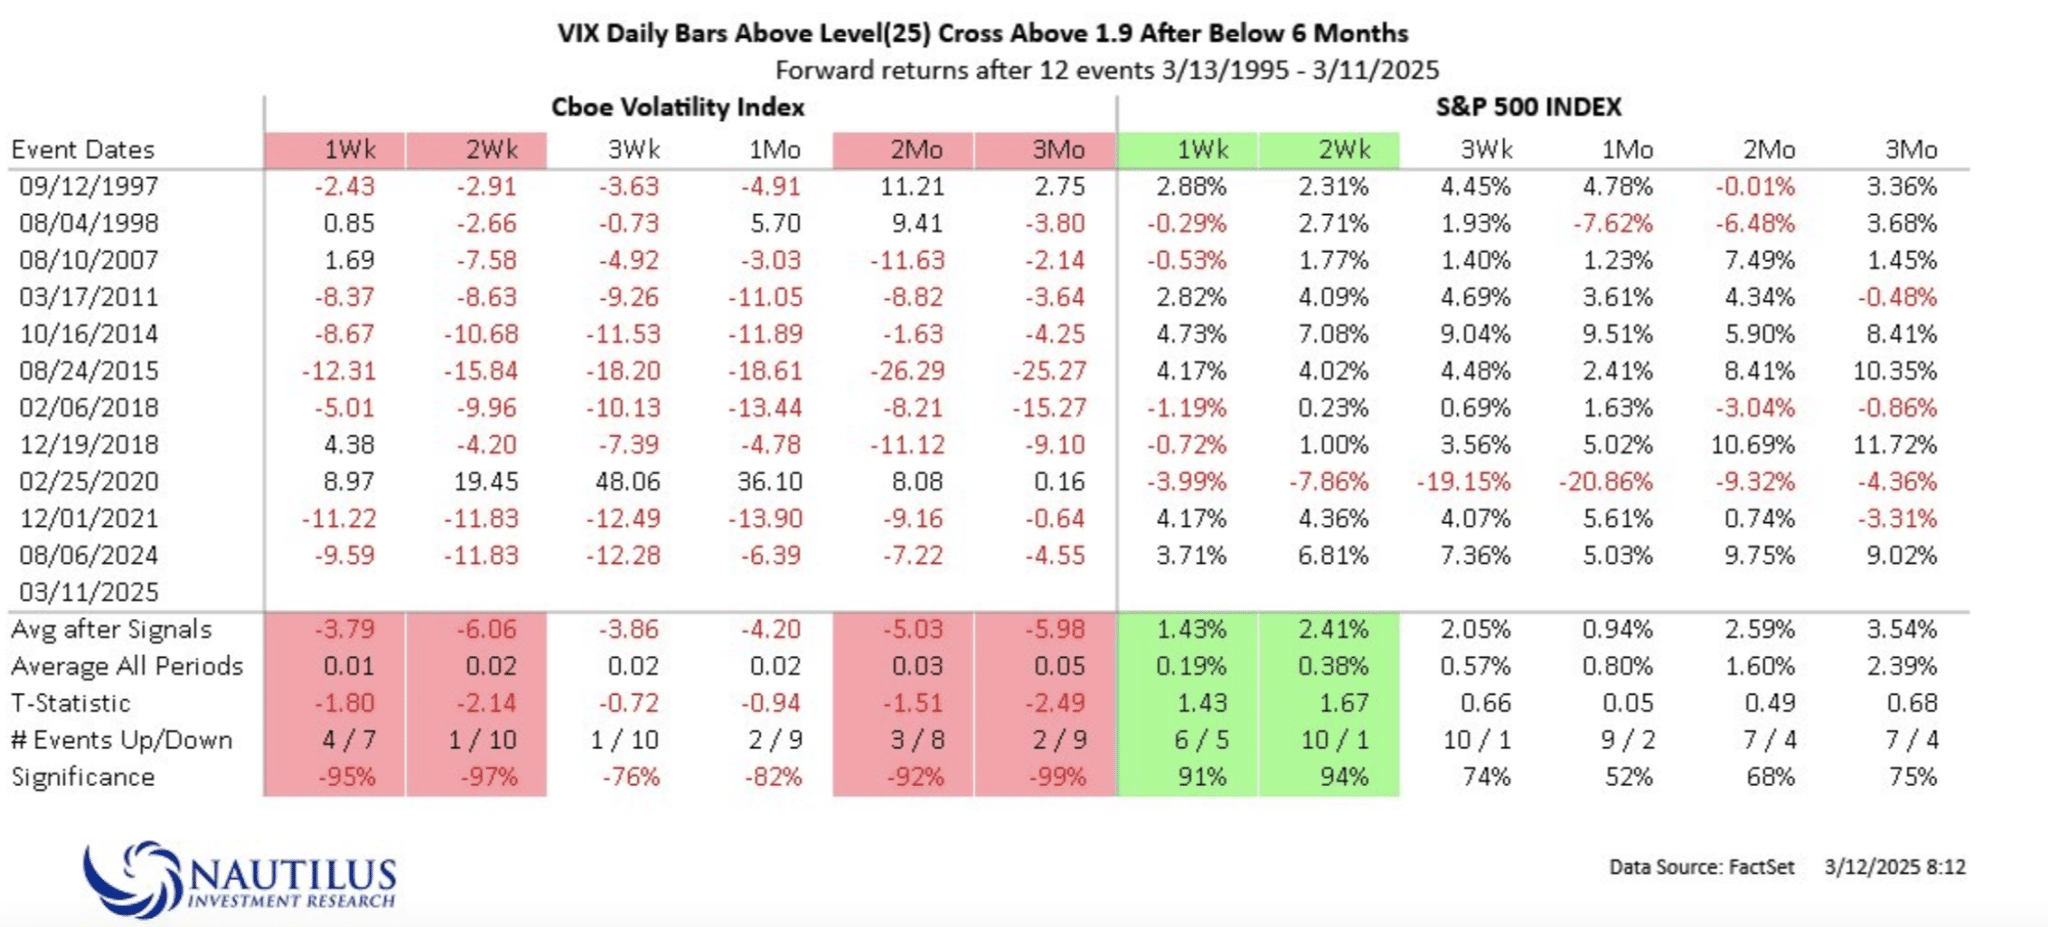
The current environment, marked by a rare confluence of extreme volatility and a shift toward more positive policy, sets the stage for a potential rebound. Investors who view these periods as opportunities—rather than reasons for alarm—can position themselves to benefit from renewed market strength on any dips. By keeping a long-term perspective, selectively adding to quality positions on weakness, and staying adaptable, you stand to capture the upside as the market transitions from fear to recovery, with history suggesting that patience and conviction are likely to be rewarded.
Direct quote from Finom Group’s “Markets Will Test Investors’ Patience And Resolve” Report (April 27, 2025):
Moreover, and not to solely focus on the S&P 500 when the VIX is elevated, let’s look at the Nasdaq’s forward performance potential and probabilities within the following SentimenTrader quant study:
After getting above 45, the VIX closed back below this level on April 9, 2025. A bullish signal generated for the Nasdaq whereby the Tech-heavy index was higher 3, 6, and 12 months later 94% of the time.
For those looking for actionable guidance, this quant-driven indicator encourages adding exposure to quality tech or Nasdaq-linked positions after such volatility events, as the odds of positive forward returns are strongly in your favor. This approach is not about timing the exact bottom, but about recognizing statistically robust opportunities and acting with conviction when the data supports it.
Direct quote from Finom Group’s “Markets Will Test Investors’ Patience And Resolve” Report (April 27, 2025):
From this point, however, again we will look at technicals. In between now and then, please review the quant below regarding the Smart Money/Dumb Money Confidence Spread disseminated 2 weeks ago:
“At Finom Group, we think you should have been buying every aspect of this market decline if one had anticipated a double-digit correction coming into 2025 (as we had forecast), and planned a cash position for dedicated allocation. What is taking place in markets was always a high probability outcome at this stage of the bull market. While I won’t lay claim to a V-shaped or W-shaped recovery process in markets, I will suggest the Smart Money/Dumb Money Indicators suggests if you haven’t been buying the correction, you should be going forward!
What could regenerate the bull market after a technical bear market? Typically, that which drove the downturn is what renews the uptrend. If the endogenous trade-tariff policy is what caused the correction, a more positive trade-tariff policy outcome should drive the recovery.
The S&P 500 closed at 5,062 on the signal date. While we might anticipate some consolidation of the rally since the signal date, history suggests that 5,062 would not be revisited over the coming 2 months and a high probability for higher prices into Q4 2025.
The Smart Money/Dumb Money Confidence Spread—a proven sentiment indicator—recently signaled a compelling opportunity for investors, especially after the market’s double-digit correction and amid ongoing policy uncertainty. When such indicators show “smart money” (institutional and commercial hedgers) is confident while “dumb money” (retail and trend-chasing investors) is fearful, history suggests a high probability of sustained market recovery. With the S&P 500 at 5,062 on the signal date, and the likelihood of a more favorable policy environment ahead, investors who have not already added exposure to equities should consider doing so now (not later!, refer to Charles Schwab Case Study above). Dribs and drabs folks, instead letting uncertainty be reflected via position sizes 💯. The current setup, supported by both technical and sentiment indicators, points to a favorable risk-reward for higher prices into the end of 2025—making this a time for decisive action and confidence in the market’s resilience.
Direct quote from Finom Group’s “Markets Will Test Investors’ Patience And Resolve” Report (April 27, 2025):
It’s hard to ignore the market path taken since Covid, and just how much it resembles the path from the post GFC era (as of April 23, 2025). Every time the paths of the 2 time periods has diverged, they come back together rather quickly. The path is what matters most!
In 2014, the correction ended and uptrend renewed where the bear market in 2025 may have also ended. This cyclical analogue remains the most highly correlated! There are no guarantees with such analogue analysis, but the paths once again speak loudly to scheduled fund flows. All else proving “equal”, the fund flows are scheduled to repeat. And I repeat this point of interest to remind investors that if indeed the negative endogenous factor has been mostly removed or replaced with a softer/positive policy stance, then all things revert to “equal”.

The market’s path since the pandemic closely mirrors the post-2008 recovery, with divergences between the two periods consistently converging over time. This cyclical analogue—especially when comparing the end of the 2014 correction to the potential end of the 2025 bear market—suggests that scheduled fund flows and historical patterns are likely to repeat, particularly now that the most negative policy shocks have been replaced by a more constructive backdrop. For investors, this means the current environment offers a strong probability for renewed market strength, and sticking to a disciplined investment approach, rather than attempting to time the market, positions you well to capitalize on the next leg higher as conditions normalize and positive momentum returns.
Direct quote from Finom Group’s “Markets Will Test Investors’ Patience And Resolve” Report (April 27, 2025):
I am inclined to hold fast to a belief that the markets’ rallying since these bottom indicators is sustainable, and would demand a reinforcing of endogeny to make a lower-low. Consolidation of the rally to one degree or another is to-be expected, but a lower-low is not our base case moving forward. In short, I do NOT agree with my friend at 3Fourteen Research Warren Pies when he offers…
As Warren offers, sentiment/positioning has been washed out, but a technical confirmation is lacking, which is proprietary to 3Fourteen Research. I hate when I see things like this. This is essentially Wall Street strategists creating their own indicators to rely upon, as if the existing and widely distributed indicators aren’t good enough. Everyone has to be the smartest guy in the room syndrome on display. Again, Warren is a friend but I’m no friend if I don’t shoot straight. I offer my friends feedback:
Given the current market context—where the rally off the April lows has been robust, sentiment is washed out, and widely distributed longer-term technical and sentiment indicators are flashing positive signals—there is a strong case for optimism. Finom Group’s view is that the rally is sustainable barring a new, significant negative shock (“reinforcing of endogeny”), and that while some consolidation is normal, a retest of the lows is not the base case.
The critique of proprietary, complex indicators—as opposed to relying on established, widely followed metrics—is a reminder that overcomplicating market analysis can lead to missed opportunities and unnecessary risk aversion. In practice, the best investors focus on proven signals, maintain discipline, and avoid the trap of thinking they are “the smartest in the room.” The current setup, with sentiment washed out and technicals improving, suggests that investors should remain engaged, use pullbacks as opportunities, and avoid overreacting to noise or the latest proprietary indicator. The market’s path—mirroring resilient recoveries from past crises—reinforces the value of sticking to a disciplined process and trusting the weight of evidence over the allure of complexity and stock or commodity picking. 😉
Direct quote from Finom Group’s “Markets Will Test Investors’ Patience And Resolve” Report (April 27, 2025):
For those investors/traders not familiar with this past week’s market price action. A Zweig Breadth Thrust (ZBT) has occurred. This proves the 19th time in the post WWII era. The ZBT is thought to be the most reliable and strongest of breadth thrusts. So when Warren suggests “ZBT has had some false signals (plural), I reject that notion as a matter of FACT:
The screenshot above was taken from Finom Group’s January 13, 2019 macro-market Research Report and after that periods ZBT triggered. It is a reminder that there has never been a false signal, and only one ZBT that resulted in a lower-low. A lower-low is not a false signal, as the forward 6 and 12 months returns were still sharply positive for the S&P 500, as outlined in the Subu Trade quant study below:
That’s a blistering amount of green on the table folks! I’m not saying that Warren’s technical bottom indicator can’t be proven right, but the weight of the evidence suggests if a technical bottom has not been achieved, then it DEMANDS reinforcing endogeny or a new exogenous event. Not Seth Golden, the weight of the evidence says what it says. Took ya’ll back to 2019 with this analysis 😉! There’s not much that gets passed us at Finom Group ✅, including MAXIMUM DRAWDOWNS from a Zweig Breadth Thrust:
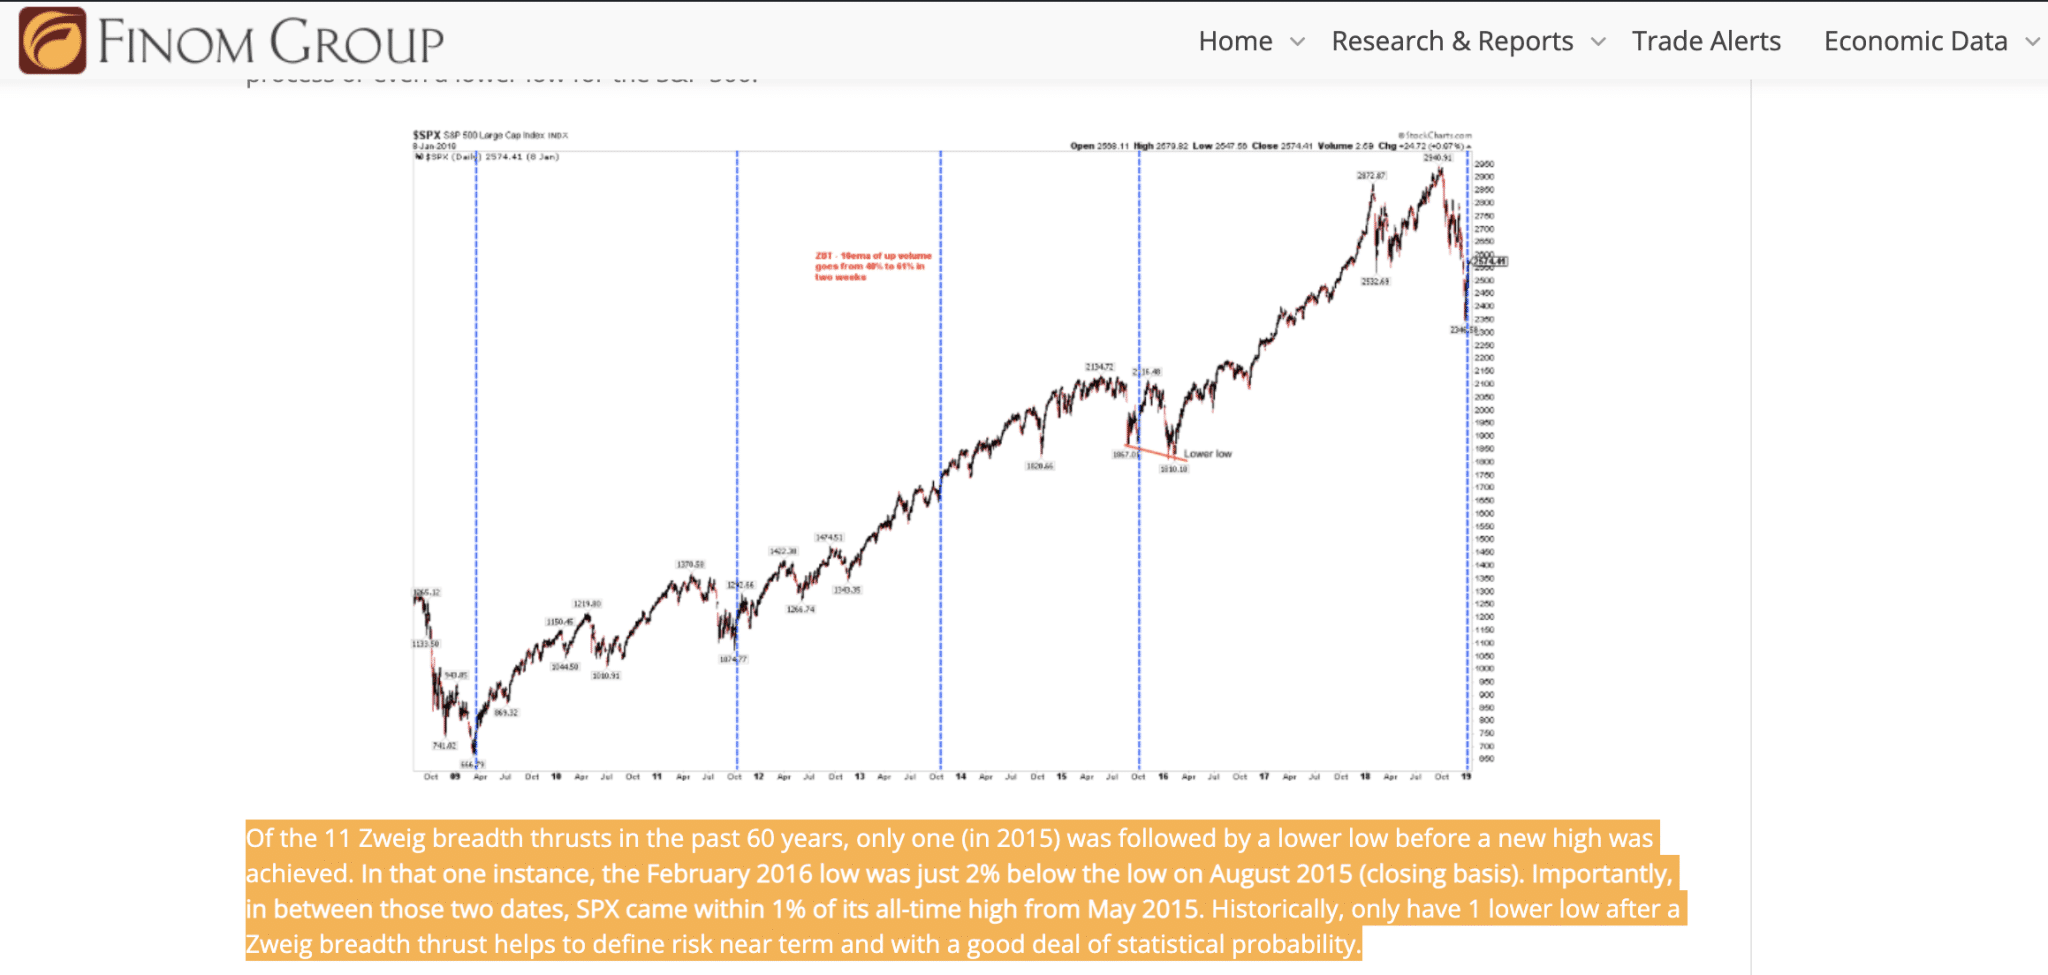

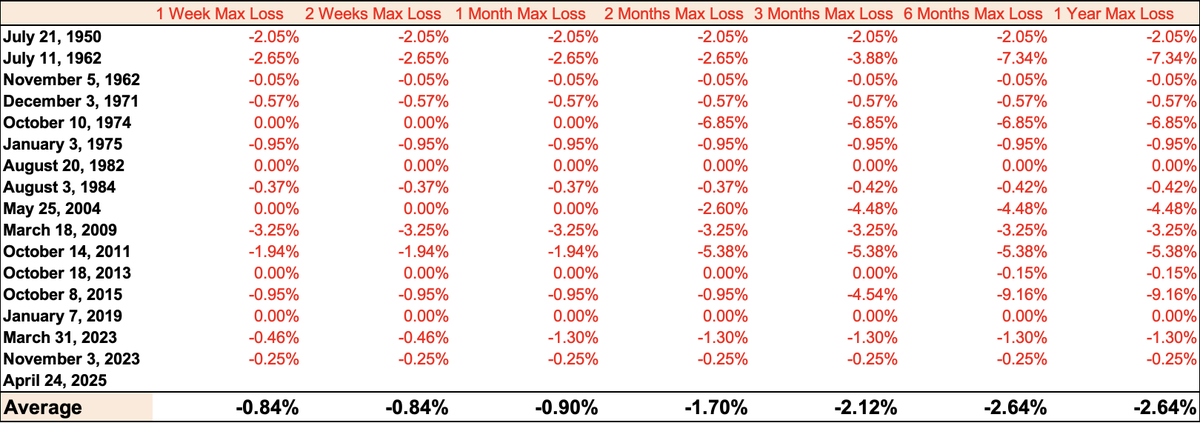
The confirmed Zweig Breadth Thrust (ZBT) in April 2025 is a rare and historically bullish signal, marking only the 19th such occurrence since World War II. Despite the S&P 500’s Normalized P/E multiple hitting a record 28.0x at the time of the signal—well above the historical average of 14.6x—recent precedents (March 2023 and November 2023) saw the market surge 26.8% and 32.7% respectively in the following year. This underscores that while valuations may be stretched, the ZBT remains one of the most reliable indicators for sustained market momentum and positive forward returns, especially when sentiment shifts from oversold to broad participation so rapidly.
However, the current long-term momentum (VLT) reading of 24.6 is the most overbought at a ZBT signal since 1943, raising a caution flag for those expecting explosive gains. The May 2004 ZBT, which occurred with a similar VLT reading, delivered a modest 6.9% 12-month return. Thus, while the ZBT’s track record is stellar—with only one instance of a lower-low and no outright false signals—investors should temper expectations for returns in the near term and remain vigilant for any new exogenous shocks or policy shifts that could disrupt the uptrend.
Direct quote from Finom Group’s “Markets Will Test Investors’ Patience And Resolve” Report (April 27, 2025):
From a practical portfolio management perspective, the history of the S&P 500’s post-ZBT performance also informs that it is the greatest “Buy The Dip” breadth thrust indicator. So if you think I’m not excited about a ZBT and won’t be buying future dips… com’on!
In addition to triggering a Zweig Breadth Thrust this past week, the Triple 70 Breadth Thrust was also triggered. Recall that this particular breadth thrust had also recently triggered toward the end of 2024. The Triple-70 Thrust requires the NYSE Up Issues % to close at 70% or greater for 3 days in a row, which it did!
There are a lot of positive numbers and the edge generally appears to be to the upside. Results between 70 and 90 days appear especially strong and consistent.
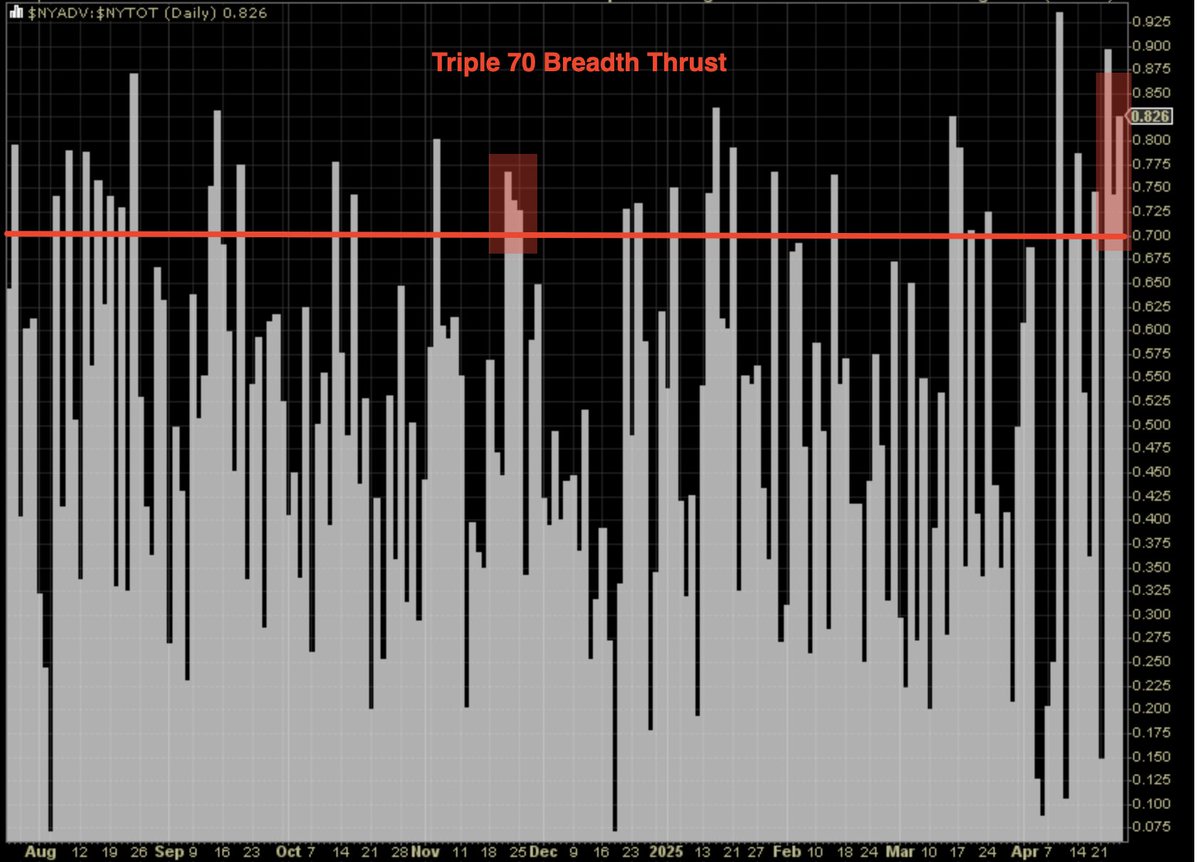
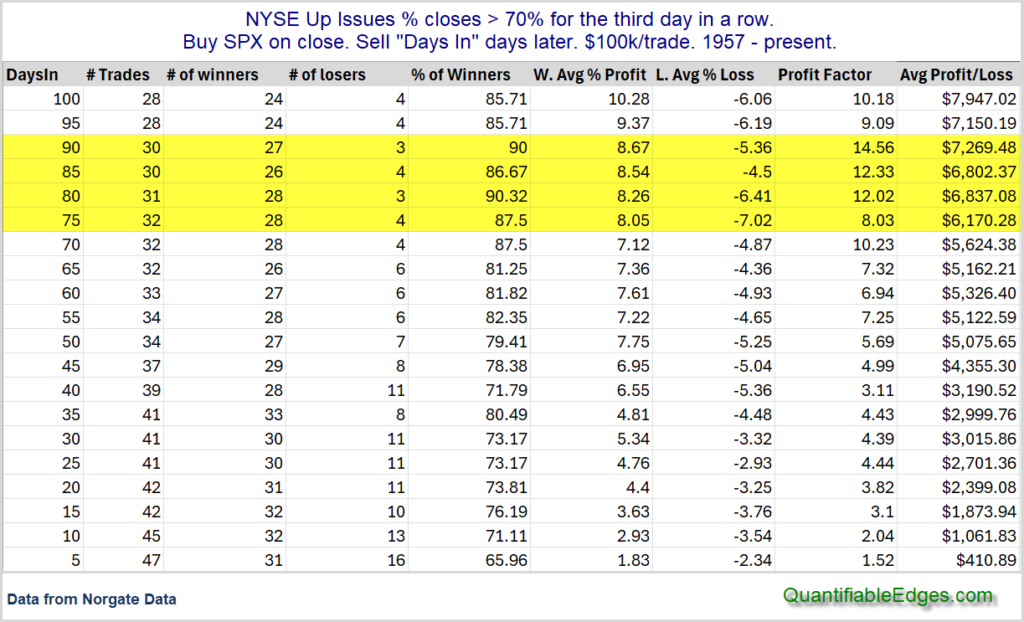
From a portfolio management standpoint, these signals are a strong prompt to add exposure to equities, particularly on any subsequent pullbacks. The weight of evidence from both breadth and momentum indicators suggests that the market’s current setup is highly favorable for investors, with the “buy the dip” strategy proving especially effective in similar historical contexts. The edge remains firmly to the upside, and disciplined investors who capitalize on these rare, high-probability signals are well-positioned to benefit from the next leg of the market’s advance.
Direct quote from Finom Group’s “Markets Will Test Investors’ Patience And Resolve” Report (April 27, 2025):
Some 85% of market transacting volume is done via algorithms. The algorithms are 95% closing basis driven. Analysis therefore should always reflect what the algorithmic volume demands, closing basis prices. When market participants wonder why this technical thing or that technical thing didn’t work, it’s almost invariably because they choose to use intraday vs. closing day prices. I reinforce this principle understanding because we would rather see a 50% retracement on a closing day basis, which looks more like the following chart (50% fibonacci lelve at 5,563):
The market came close to achieving the 50% Fibonacci retracement level as of Friday and is now within .50% of doing so. This may prove the next feat of bullish 🐂 strength in the recovery📈.
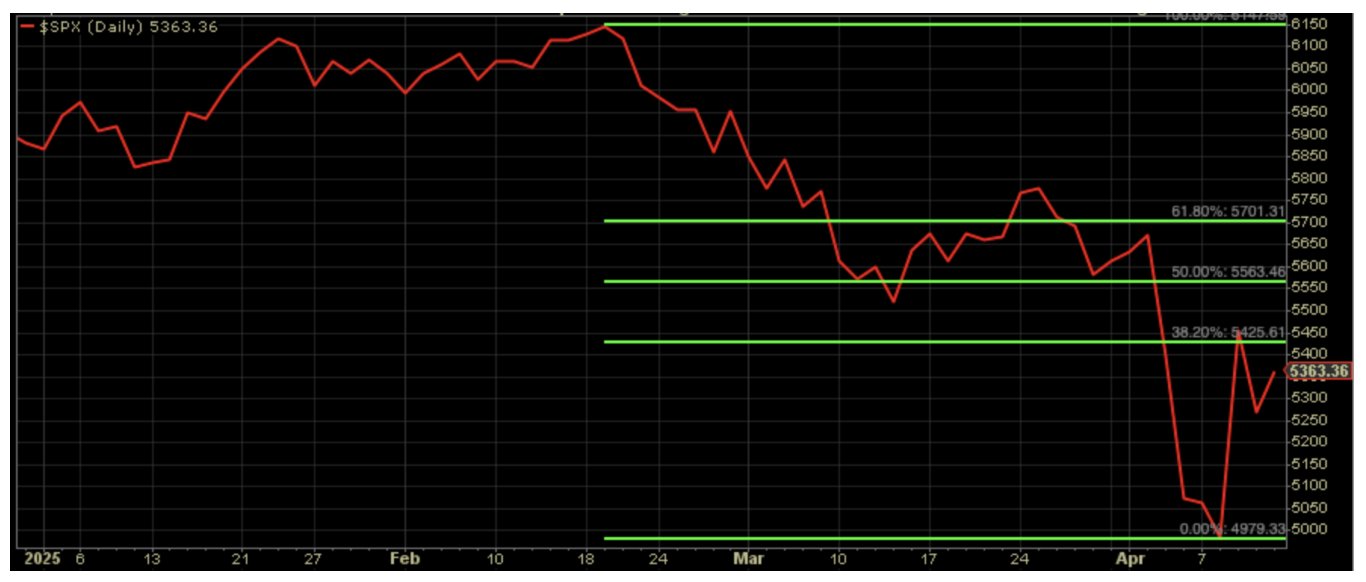
This rapid recovery and move toward 6,150 (ATHs) further validates the bullish signals from recent breadth thrusts and algorithmic-driven technical analysis. The market’s ability to not only retake but also surpass key technical levels (5,563)—despite elevated valuations and overbought momentum—underscores the strength of the current rally and the resilience of the “buy the dip” narrative, especially when backed by robust breadth and closing-price confirmation.
Even with the S&P 500’s P/E ratio still elevated (around 27.99–28.0x), the market continues to reward investors who have remained engaged and focused on closing-price technicals, as highlighted by Finom Group’s analysis. The current setup suggests that, unless a new major negative shock emerges, the path of least resistance remains to the upside, with $SPX 6,150 in sight.
Direct quote from Finom Group’s “Markets Will Test Investors’ Patience And Resolve” Report (April 27, 2025):
It may feel as though with all these breadth thrusts and double-digit rallies of the lows for the major averages that overbought conditions have materialized. This is a good consideration, given we are also nearing a 50% Fibonacci retracement probability. For the S&P 500 to be oversold, I would be looking at these 3 charts below:
While the S&P 500’s 5-day RSI (top chart) is nearly at overheated levels (70+), nearly may not trigger algorithms until achieved. Secondly, the rally from the lows doesn’t find the McClellan Oscillator above 70 or the percentage of stocks trading above their 20-DMA above 70% either. As such, overbought conditions have not been achieved during the current recovery/rebound. This doesn’t guarantee more upside, but rather suggests there is room for further upside and until overbought conditions are met.

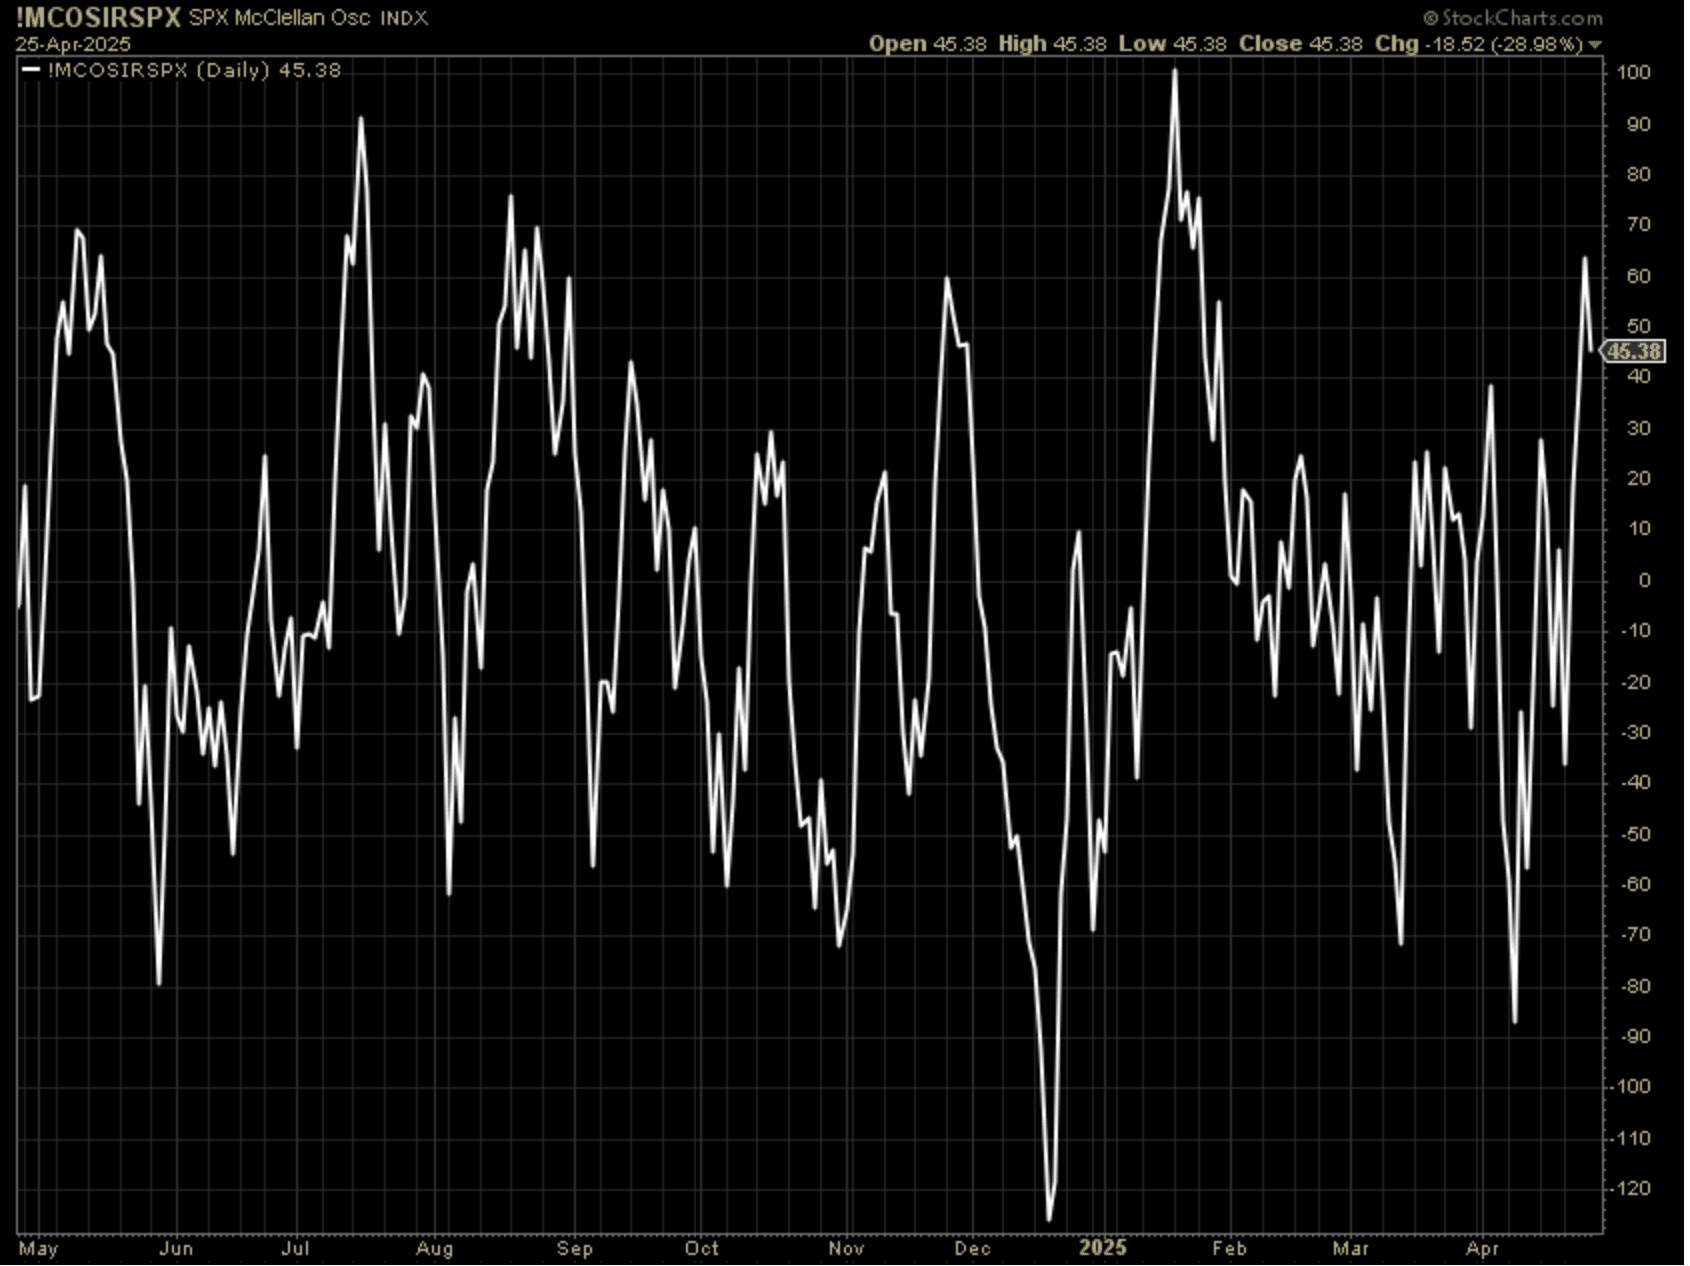

In summary, while the S&P 500 is now much higher and some indicators are stretched, the absence of broad overbought signals in breadth and momentum suggests the rally may still have room to run—especially if supported by strong sector participation and algorithmic buying at the close. However, with the index near all-time highs and sentiment elevated, prudent risk management remains essential
Direct quote from Finom Group’s “Markets Will Test Investors’ Patience And Resolve” Report (April 27, 2025):
In an effort to keep things simple, as we are more index and sector ETF-centric once a major correction has taken place (you don’t want to start picking stocks after a major correction, stocks typically don’t recover as quickly as the index, shy of Growth stocks which typically lead the index), we want to recognize that the Nasdaq/Growth has led the market rebound. Having said that, we might anticipate this leadership to pause in the near-term. That might take additional earnings releases from certain of the MAG-7 names set to report this coming week, but also mainly looking at the overheated condition in the QQQ:SPY performance ratio’s 5-day RSI:
At 79+, the performance ratio’s 5-day RSI (bottom panel) is well into overheated territory, but has been even more overheated in recent past. Possibly more importantly from a price basis, the recent rally has taken the Growth/Value-like performance ratio over the end of March peak in price. If this is to prove a new uptrend, we would want to see higher-highs from the March forward. Additionally, it may be a bullish sign that the low for the cycle was slightly higher than the September 2024 low price.

While growth leadership is extended and may consolidate, the technical and fundamental backdrop remains constructive for further gains in Growth and Nasdaq indices, provided higher highs are confirmed and fundamentals continue to deliver. Investors should remain index- and sector-focused, using pullbacks as opportunities to add exposure to leading areas of the market
Direct quote from Finom Group’s “Markets Will Test Investors’ Patience And Resolve” Report (April 27, 2025):
Another chart performance ratio savvy technicians/investors use helps to measure risk-on vs. risk-off as well as cyclical market strength: The Equal-weight Consumer Discretionary vs. Staples performance ratio. On April 21st, I caught this bullish divergences in the performance ratio, which was a similar bullish divergence expressed at the low point in the performance ratio during the 2022 bear market.
Fast-forward to April 25th and the performance ratio has improved greatly. Turns out, the bullish divergence proved a good indication that investors had exhausted their risk-off posture and selling of Consumer Discretionary stocks, as the performance ratio increased sharply since April 21st and to end this past trading week.
The bulls have the strength of Tech/Growth/QQQ leadership and risk-on cyclical appetite. A continuation of this rebound at the index level will demand a continuation of macro-economic strength, resilient corporate fundamentals, some resolution around trade deals and a steady Federal Reserve hand. For now, the breadth thrusts inform investors should be opportunistic dip buyers but be on the lookout for additional feats of bullish strength to further confirm the renewed uptrend.
With Tech/Growth and QQQ leading the rally, and the Consumer Discretionary vs. Staples ratio surging as risk appetite returns, the market’s breadth and sentiment are flashing strong buy signals. The recent bullish divergence in cyclical sectors—similar to the 2022 market low—suggests that the worst of the selling is likely behind us, and the path of least resistance is higher. While continued macro support and a steady Fed are needed for sustained gains, the combination of breadth thrusts, sector rotation, and risk-on momentum means investors should stay engaged and use any pullbacks as opportunities to add exposure to leading sectors and indices.
Direct quote from Finom Group’s “Markets Will Test Investors’ Patience And Resolve” Report (April 27, 2025):
The last chart of the day will hope to validate a hypothesis surrounding the usage of Price to Earnings in order to define economic outcomes. On April 21st, I posted the chart of the Value Line Geometric Index, which is essentially an index that defines the median stock in the stock market’s price trend.
The top of the 2007 bull market has proven support and resistance multiple times since 2014, most recently proving the bear market trough in 2022 and correction trough in 2023. It may have also proven the bear market trough of 2025. Remember, the Value Line Geometric is the median stock index, likely also a good representation of the path of median stock earnings trend and median S&P 500 P/E.

Given its strong correlation with the median S&P 500 P/E and median stock earnings, the Value Line Geometric Index provides a unique lens for investors to assess whether market corrections are driven by technical factors or fundamental shifts. Its recent test and hold of major support suggests that, while large-cap indices like the S&P 500 may be influenced by a handful of mega-cap stocks, the broader market—as represented by the median stock—is still anchored by robust technical and valuation support. This is a positive signal for the durability of the current rally, especially as market breadth and cyclical leadership continue to improve.
Direct quote from Finom Group’s “Markets Will Test Investors’ Patience And Resolve” Report (April 27, 2025):
In reviewing the S&P 500 median Forward P/E Ratio from the chart above (red trend line), we can see that it hasn’t quite come down to the 2022 and 2023 trough levels, but the Value Line Geometric Index already has done so as evidenced in the prior chart. Additionally, we know that the S&P 500 literally tagged its 2022 peak price or the former calendar year earnings high from 2022. Remember the old saying, “markets are forward discounting mechanisms.” If you are concerned about valuations not having “come down enough”, that’s perfectly fine, but you might concern yourself more with the fact that markets have likely already priced lower earnings at the trough on April 8, 2025, and despite all the tumult in early 2025, markets may still not believe in a recession. There’s always a message from the market, and I’m of the opinion this is the markets’ message to investors. Like certain of the already outlined data and analytics in this weekend’s research report, this analysis is suggesting that lower-lows demand reinforcing endogeny to produce a recession. I’m not underestimating the trade war situation, but that’s out of my control and seemingly within the control of the markets to demand better policy implementation.
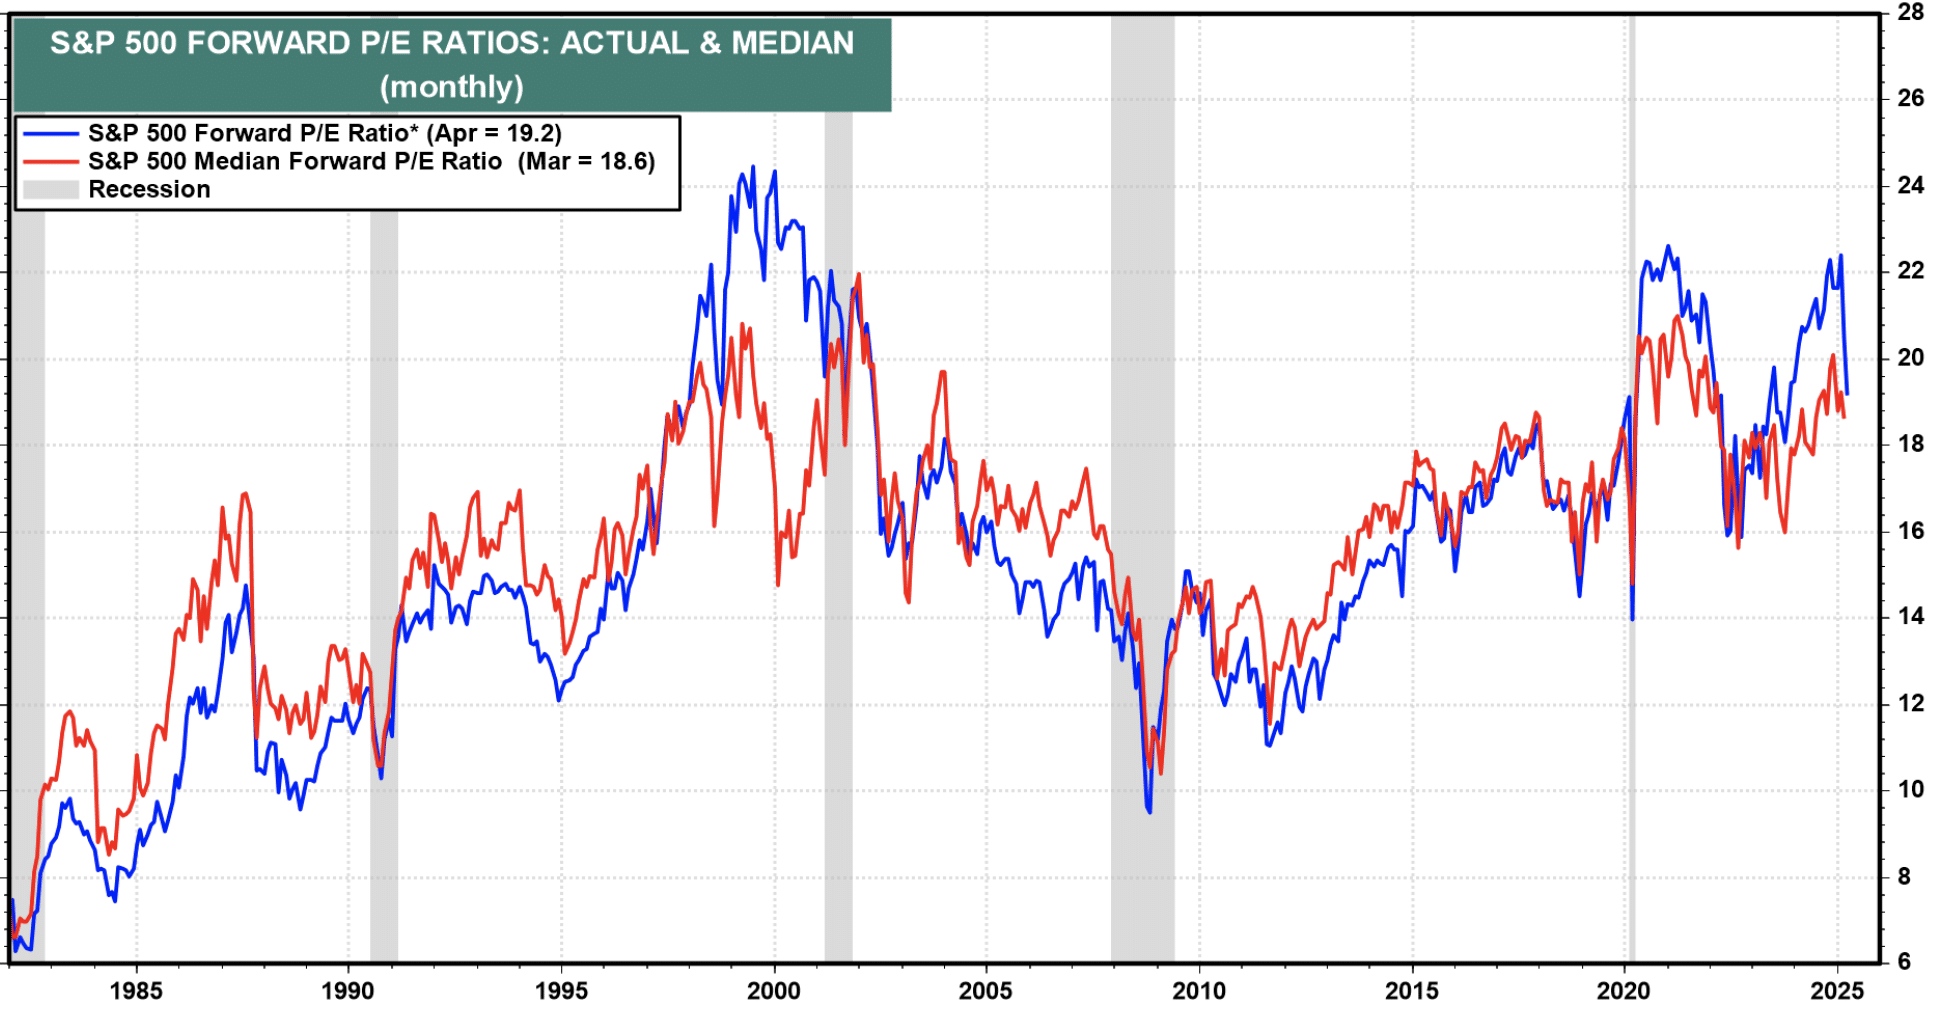
The S&P 500’s recent test of its 2022 peak price, despite ongoing macro uncertainty, signals that investors are forward-looking and have likely already discounted a softer earnings environment. The market’s resilience—driven by breadth thrusts, improving risk appetite, and robust sector rotation—suggests that unless a new, significant negative shock emerges, the path of least resistance remains higher. In other words, while trade policy and other risks remain, the market’s message is clear: barring a recession or renewed policy turmoil, the bull case for equities remains intact.
Direct quote from Finom Group’s “Markets Will Test Investors’ Patience And Resolve” Report (April 27, 2025):
Plenty Of Time For Bulls… And Bears
My takeaway from the last couple of weeks price action is that investors/traders have decided that this weekly news flow basically takes the worst-case scenario off the table. And since Wall Street had been busy taking their estimates for just about everything down, stock prices needed to be adjusted a bit to reverse course. Thus, a correction of some of the correction appears to be happening.
From our perspective, the recovery of about half of this bad news panic decline makes sense. At least for now. Or until all things related to tariffs and threats become clearer, which may still yet take another couple of months. Be prepared for some degree of sticky volatility.
To be sure, positive action in the stock market has been in short supply this year. In fact, the back-to-back +1% gains on the S&P 500 seen on Tuesday and Wednesday were the first since the election. And since every market analyst worth their salt knows that “follow through” is essential to any bounce during this type of environment, seeing a third and then fourth consecutive day of gains can be interpreted to mean that the bulls are trying to get back in the game.

The market is currently in a “prove it” phase. Refrain from chasing losses/gains or panicking; instead, adopt an offensive and defensive cash strategy simultaneously. The upcoming weeks will be crucial for capitalizing on existing momentum while maintaining meticulous “risk management” as we seemingly, retest ATHs. I acknowledge that this message may appear repetitive or even irritating at this juncture. However, I believe it holds significance and may serve a future purpose.
Direct quote from Finom Group’s “Markets Will Test Investors’ Patience And Resolve” Report (April 27, 2025):
We’ve outlined a couple of new breadth thrusts having triggered this past week, and we should never find ourselves brushing these all-important signals off while elevating fearful narratives. Consider these breadth thrusts are akin to institutional investors reaching out to retail investors, informing they have become much more bullish. With this in mind, I reiterate the opinion that the S&P 500 has an outsized probability of achieving 5,700 over the coming 2 months and 5,667 at worst by July 16, 2025… or had you forgotten about the Whaley Breadth Thrust?
While most Wall Street strategist DID NOT have 5,600s or lower as part of their 2025 playbook, we certainly did when recognizing a high probability afoot for a 10%+ correction in 1H 2025. The Whaley Breadth Thrust maintains a perfect 💯 track record 12-months forward. On the July 16, 2025 signal date the S&P 500 closed at 5,667. It’s quantifiably accurate to forecast the S&P 500 higher than the signal date price, given the Whaley Breadth Thrust occurrence.

The Finom Group’s April analysis called for the S&P 500 to reach at least 5,667–5,700 by mid-July 2025 following the Whaley Breadth Thrust—a signal with a flawless 12-month forward track record. The market has already far exceeded that target, now trading near 6,000 as of June 2025. This rapid advance validates the predictive power of breadth thrusts, which indicate broad-based buying and institutional conviction.
The Whaley Breadth Thrust gave you a clear bullish edge—now, almost back at new highs, focus on cash levels and selective rotation into ETFs like XLK and XLV rather than chasing the rally. The signal’s historical accuracy has already played out, so use this as an opportunity to rebalance and stay disciplined.
Direct quote from Finom Group’s “Markets Will Test Investors’ Patience And Resolve” Report (April 27, 2025):
As a strategist, analyst and portfolio manager, I’ve seen a great many investors/traders come and go, doubting and dismissing breadth thrusts. The range is from the “lowly” retail investor to the most popular and revered of investors. I remember the last Whaley Breadth Thrust, keeping in mind that another could be triggered this coming week, where even Wayne Whaley and Walter Deemer called it “a dud”.
Please read these comments to my original posts about the Whaley Breadth Thrust that triggered last year. Note, the comments that include my own were in response to the correction that was ensuing during the month of August and directly after the Breadth Thrust signaled. “Ye of little faith, eh?” Now when most people hear these words they correlate it to a Bible passage denoting Peter’s attempt to walk on water, and toward Jesus. How could Peter, one of the 12 Apostles be “of little faith” after all. Keep in mind that little does not solely refer to size.

The market’s rally since the disputed Whaley Breadth Thrust is a powerful reminder: faith in robust, data-driven signals—despite noise and doubt—remains a winning strategy.
Direct quote from Finom Group’s “Markets Will Test Investors’ Patience And Resolve” Report (April 27, 2025):
“Short in duration; time” ~ Merriam Webster
When Jesus informs that Peter is of little faith and as Peter fell into the water, Jesus may have been speaking of faith that doesn’t span the test of time, it is little in duration. Walter Deemer, Wayne Whaley, and all others who engaged my post with comments may have simply been tested during the -9% pullback of 2024, and been found of little faith as the S&P 500 traveled to ~6,150 thereafter. In revisiting this commentary and analysis of the former Whaley Breadth Thrust still in play, MY COMMENTS should also remind you how to block out the noise, and stick to savvy investing disciplines. That’s your “alpha”! (apologies if this segment offended any persons)
It is important to remember that some of the best rallies in stock market history have occurred during bear cycles. And don’t look now, but both the S&P 500 and Nasdaq 100 finished the week right into an area of important technical resistance. If I was a bear 🐻 looking to make money on the short side, this is exactly the type of set up I’d be looking for before reloading the sell programs.
Cutting to the chase, we are probably not out of the woods here. Yes, the worst-case scenario may be off the table. However, the key question now becomes, is there durable improvement? Yes, it’s certainly possible that the trade war could have turned the corner. After all, bonds are acting better. Gold has reversed. The liquidation events seem to have dissipated. And the correlations among stocks seems to be falling (identifies dispersion, which is historically more bullish).
However, there is no deal with China, or any other country for that matter…yet. Beijing is saying the two sides aren’t even talking. So, until investors can get the feeling that this trade war is not going to send the economy, and in turn, earnings off a cliff, and the consequences (both intended and unintended) can be digested, we can’t flash the all-clear signal, but we can suggest the weight of the evidence is increasingly bullish, and bears may be losing… faith.
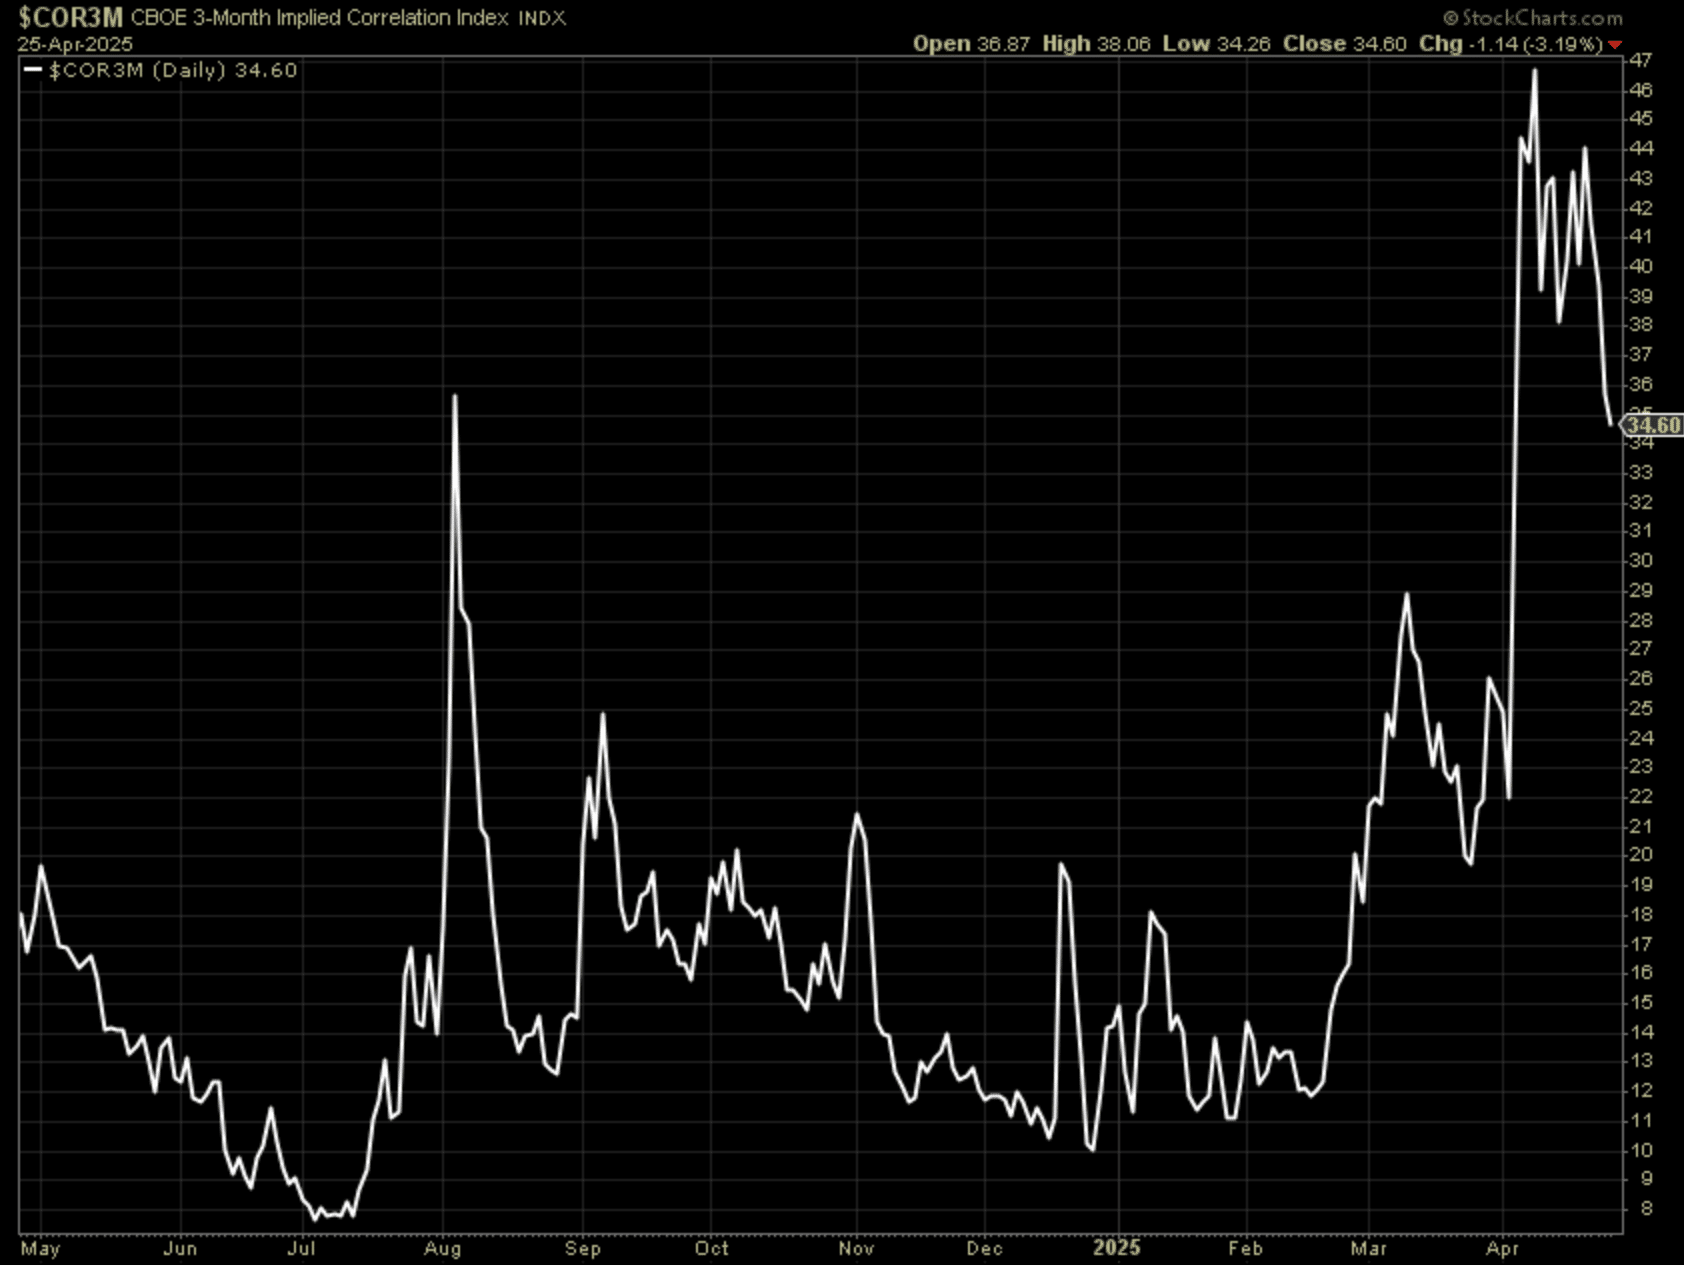
The market’s resilience is a testament to the strength of robust technical and sentiment signals, but ongoing macro uncertainty means the rally is not yet on autopilot. Stay disciplined, block out the noise, and let the weight of evidence—not short-term fears—guide your next savvy investor, cash disciplines. Keep that register ringing traders! I see you all KILLING IT daily/weekly via Traders Corner on Telegram. 🤑
Direct Quote from Finom Group’s “Only 2 Ways For The Market To Go From Here” (May 4th, 2025) Report:
Additional April Considerations
Here are all calendar years where the index closed April down -5% or worse. Not exactly a great sign for the remainder of the year.
- If the index closes down greater than -5% at the end of April, the rest of the year has only been positive 4 other times the rest of the year. (1958, 1960, 1970, 2020, n = 14) ~Steve Deppe
- As of April 29, 2025 (closing price), the S&P 500 is down -5.5%
The S&P 500 has now gained in 6 consecutive trading sessions, a rare feat of bullish strength after one of the worst starts to an April month in history. What does the data inform about the forward probabilities for the benchmark index?
After 6 consecutive positive daily returns and a cumulative return of 7% over that time period, their has never been a negative return 6 and 12 months forward, with average returns of 16% and 19% respectively (Subu Trade).
Our last quant of the day references the rapid and waterfall-like decline in the S&P 500 during the month of April. The QUANT foretells: Waterfall declines of 10%+ since the 1930s have met bullish price action thereafter. 3-months forward from the official correction, price has been higher EVERY. SINGLE. TIME. since 1936. (Wayne Whale quant below)
Signal date = 3/13/2025
Signal price = 5521
Forward date = 6/13/2025


Despite a concerning, and historically ominous April—with the S&P 500 down more than 5% for the month—the market’s subsequent six-day winning streak and rapid recovery have completely changed the narrative. Historically, such sharp rebounds after extreme declines are rare and almost always bullish: after six straight positive days and a 7% cumulative gain, the S&P 500 has never posted a negative return over the next 6 or 12 months, averaging gains of 16% and 19%, respectively. Moreover, every 10%+ “waterfall” correction since 1936 has been followed by higher prices three months later.
This data suggests that while a weak April has typically been a bad omen for the rest of the year, the market’s ability to recover sharply and string together multiple up days is a powerful bullish signal. The current setup—with the S&P 500 now near all-time highs—validates these historical precedents and reinforces the idea that, after a severe correction, buying into strength has been a winning strategy for long-term investors.
Last, but not least, from our May 4th 2025 Research Report: Only 2 Ways For The Market To Go From Here
Finom Group has called every market bottom since inception. Will this prove another timely call? What does it matter, especially if the opportunity was not achieved by the masses? There are no awards handed out for top or bottom calls, none. Savvy investors/traders focus more so on buying cheaper prices; the market will ultimately deliver its own reward/s!

For current investors, the takeaway is clear: avoid the trap of waiting for awards or validation from the crowd. Instead, focus on disciplined entry points, use proven signals like breadth thrusts, and let the market’s resilience—not short-term noise—drive your long-term returns. The market’s ability to rebound sharply, even without Fed intervention, suggests that opportunities are best seized when fear is highest and conviction is lowest.
Stay focused on process over prediction, and let the market’s own momentum be your guide. The real reward comes not from perfect timing, but from consistently buying “value” and holding through the noise.


