
Having posted YouTube videos on just about every popular chart indicator, I’ve become familiar with everything from MACD to stochastics to the Bollinger bands and many more. The most common one, however, would be the simple moving average (though the exponential moving average is also popular). To be more specific, the 200-day moving average (200DMA) and the 50-day moving average (50DMA) are very well-known among chartists worldwide.
In fact, these moving averages are so well-known that it might be suggested that they become a self-fulfilling prophecy: if enough traders expect the price to bounce off of the moving average and they consequently place a buy order, then the price might indeed bounce off of that moving average.
Even if this phenomenon does take place, it wouldn’t be tradable unless it happens with consistency. Personally, I don’t expect any trading strategy to work 100% of the time, but I do require it to be significantly better than a coin flip. Looking at a few randomly chosen examples of daily candlestick charts, we can begin to evaluate whether buying at a popular moving average such as the 50DMA is a consistently successful strategy:

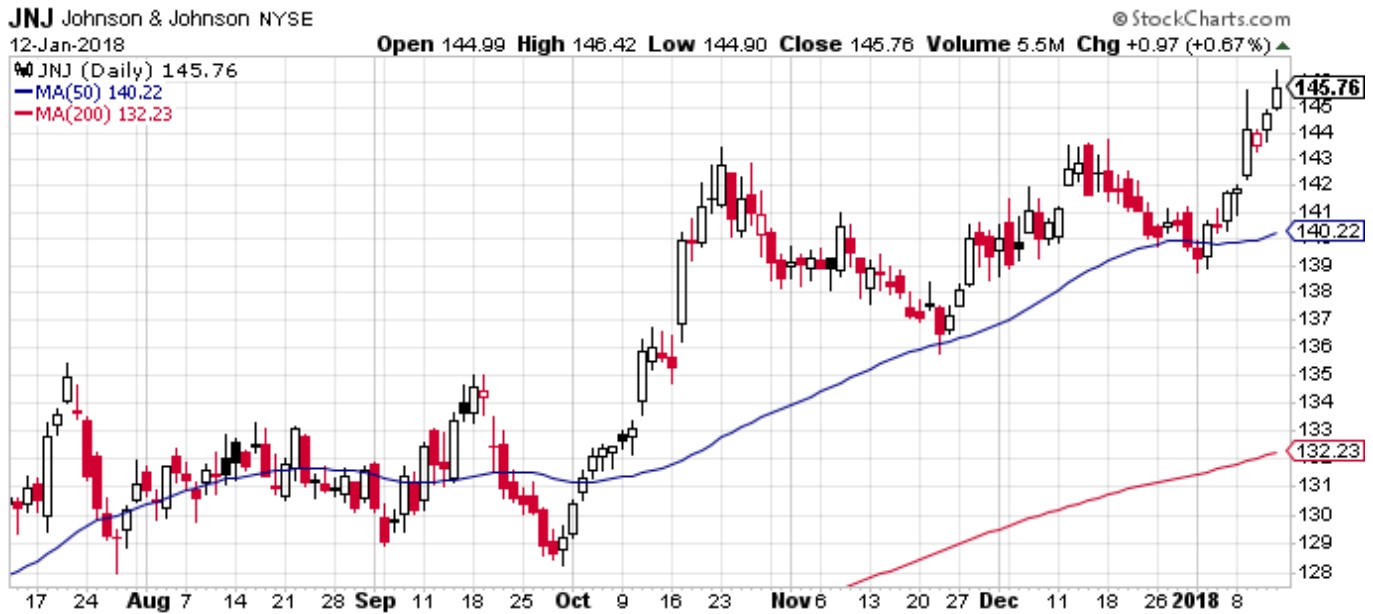

In all of these charts, we can see times when the candlesticks seem to bounce off of the 50DMA perfectly; this makes it easy for us to ignore the times when the price action completely disregards this “magical” line. Unfortunately, I’ve seen enough charts on multiple time frames to conclude that there’s no tradable consistency when attempting to use these moving averages as buy or sell signals. Believe me — if these lines had any “magic” or predictive power, I would have built a small fortune with them… but then, so would everyone else, and then the strategy would cease to work.


